| Param | Original file | Final file |
|---|---|---|
| Filename | modeM0/AS1A05_034T01_9000002404_16311cztM0_level2.evt | modeM0/AS1A05_034T01_9000002404_16311cztM0_level2_quad_clean.evt |
| Size (bytes) | 460,549,440 | 74,485,440 |
| Size | 439.2 MB | 71.0 MB |
| Events in quadrant A | 3,286,692 | 450,150 |
| Events in quadrant B | 3,552,279 | 467,511 |
| Events in quadrant C | 3,349,907 | 453,078 |
| Events in quadrant D | 3,329,540 | 443,568 |
| Mode M0 | |||
|---|---|---|---|
| Quadrant | BADHDUFLAG | Total packets | Discarded packets |
| A | 0 | 13516 | 3 |
| B | 0 | 14310 | 2 |
| C | 0 | 13609 | 2 |
| D | 0 | 13741 | 2 |
| Mode SS | |||
|---|---|---|---|
| Quadrant | BADHDUFLAG | Total packets | Discarded packets |
| A | 0 | 130 | 0 |
| B | 0 | 130 | 0 |
| C | 0 | 130 | 0 |
| D | 0 | 130 | 0 |
| Mode M9 | |||
|---|---|---|---|
| Quadrant | BADHDUFLAG | Total packets | Discarded packets |
| A | 0 | 13 | 0 |
| B | 0 | 13 | 0 |
| C | 0 | 13 | 0 |
| D | 0 | 13 | 0 |
| Quadrant | Total seconds | Saturated seconds | Saturation percentage |
|---|---|---|---|
| A | 6316 | 52 | 0.823306% |
| B | 6316 | 81 | 1.282457% |
| C | 6316 | 85 | 1.345788% |
| D | 6316 | 69 | 1.092464% |
Noise dominated data is calculated using 1-second bins in cleaned event files. If a bin has >2000 counts, and if more than 50% of those come from <1% of pixels, then it is considered to be noise-dominated and hence unusable.
| Quadrant | # 1 sec bins | Bins with >0 counts | Bins with >2000 counts | High rate bins dominated by noise | Noise dominated (total time) | Noise dominated (detector-on time) | Marked lightcurve |
|---|---|---|---|---|---|---|---|
| A | 7612 | 6318 | 2 | 2 | 0.03% | 0.03% | 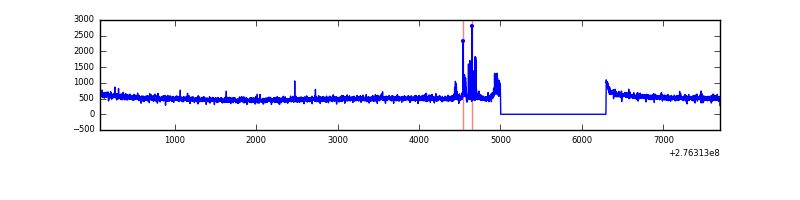 |
| B | 7612 | 6318 | 21 | 21 | 0.28% | 0.33% |  |
| C | 7612 | 6318 | 0 | 0 | 0.00% | 0.00% | 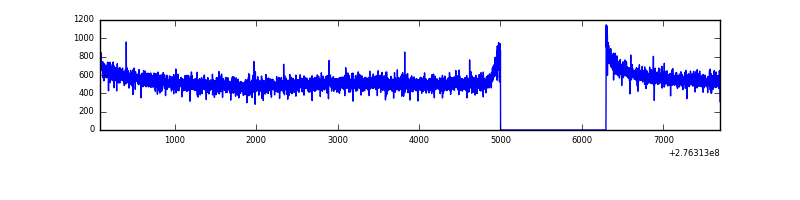 |
| D | 7612 | 6318 | 27 | 27 | 0.35% | 0.43% | 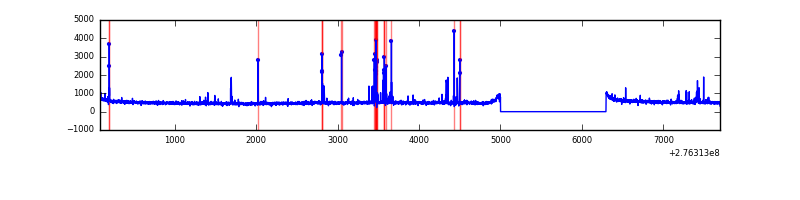 |
Top three noisy pixels from each quadrant. If the there are fewer than three noisy pixels in the level2.evt file, extra rows are filled as -1
| Pixel properties | Quadrant properties | ||||||
|---|---|---|---|---|---|---|---|
| Quadrant | DetID | PixID | Counts | Sigma | Mean | Median | Sigma |
| A | 15 | 174 | 61309 | 364.5 | 834 | 818 | 166.0 |
| A | 15 | 157 | 19839 | 114.61 | 834 | 818 | 166.0 |
| A | 0 | 226 | 7279 | 38.93 | 834 | 818 | 166.0 |
| B | 4 | 173 | 112053 | 715.88 | 843 | 827 | 155.4 |
| B | 15 | 35 | 68419 | 435.04 | 843 | 827 | 155.4 |
| B | 0 | 198 | 22334 | 138.42 | 843 | 827 | 155.4 |
| C | 14 | 238 | 129979 | 689.58 | 818 | 826 | 187.3 |
| C | 3 | 233 | 24605 | 126.96 | 818 | 826 | 187.3 |
| C | 13 | 61 | 5894 | 27.06 | 818 | 826 | 187.3 |
| D | 10 | 70 | 105583 | 533.72 | 816 | 799 | 196.3 |
| D | 2 | 122 | 74740 | 376.62 | 816 | 799 | 196.3 |
| D | 1 | 52 | 40462 | 202.02 | 816 | 799 | 196.3 |
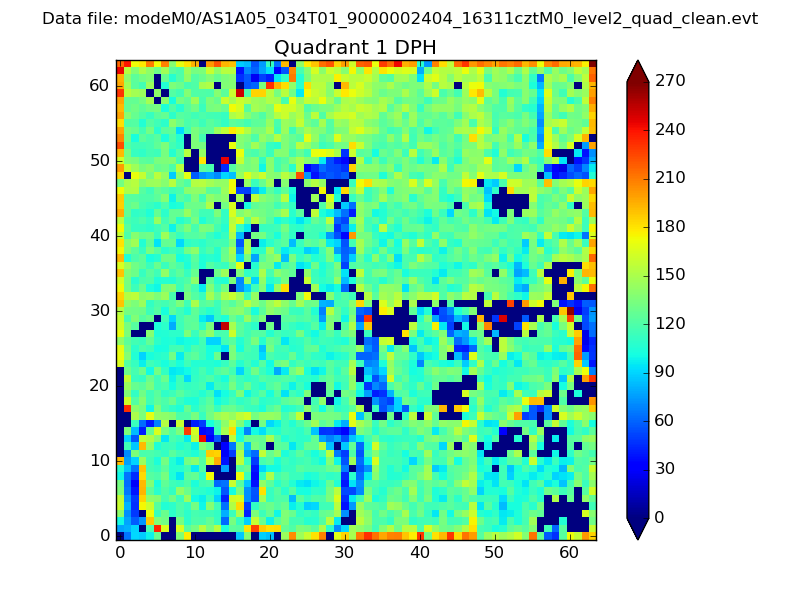
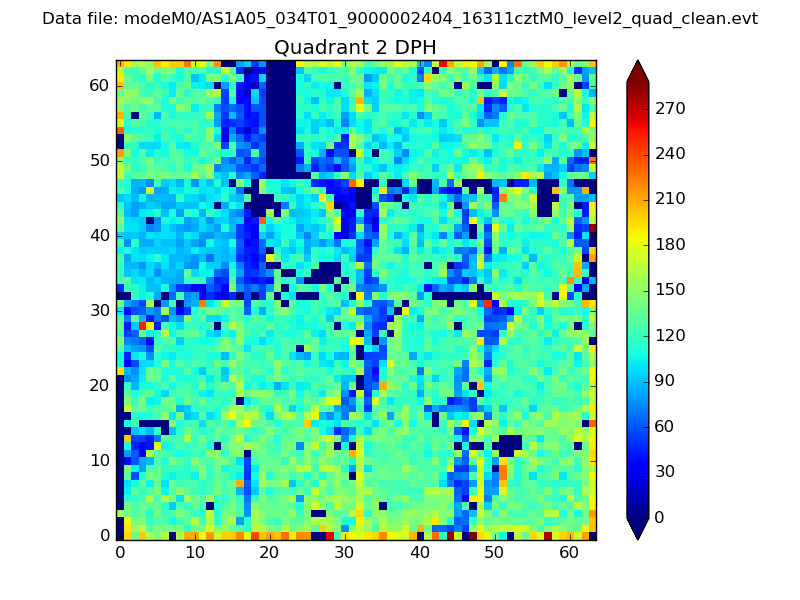
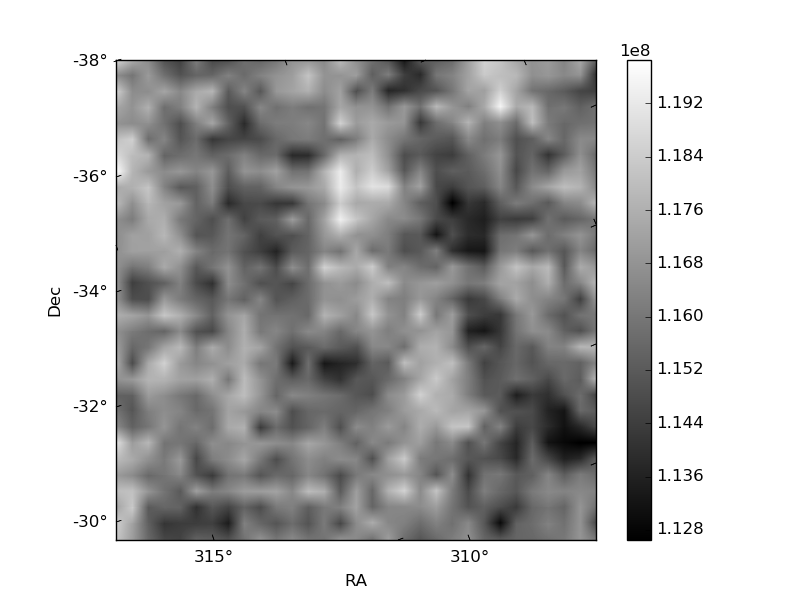
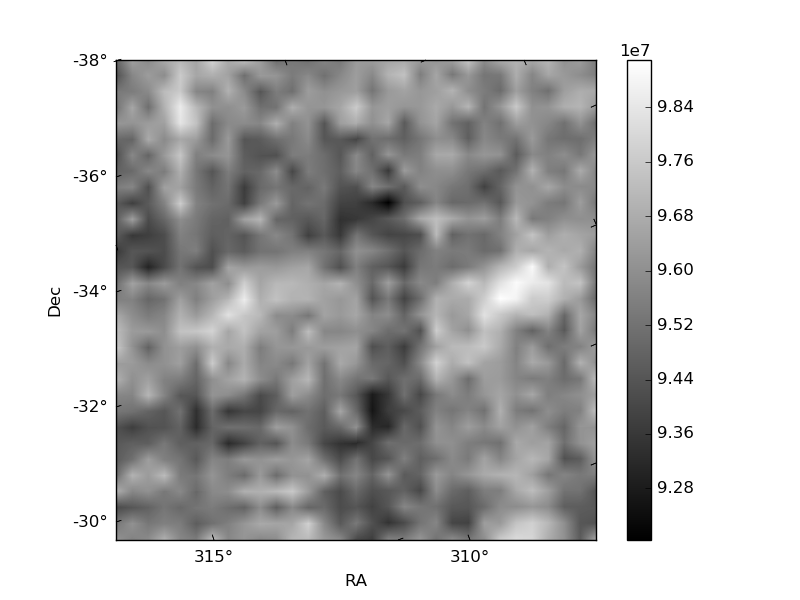
Histogram calculated using DETX and DETY for each event in the final _common_clean file
| Quadrant A |  |
 |
Quadrant B |
|---|---|---|---|
| Quadrant D | 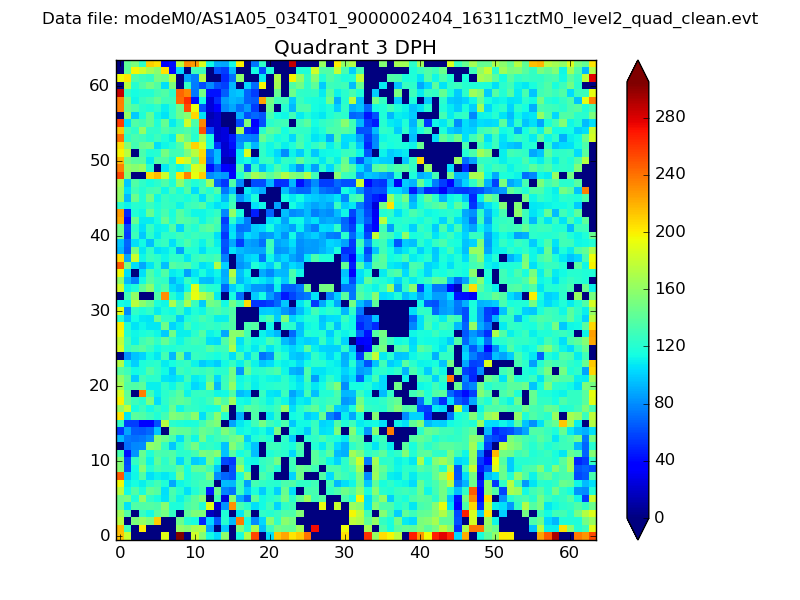 |
 |
Quadrant C |
| Plot type | Count rate plots | Images |
|---|---|---|
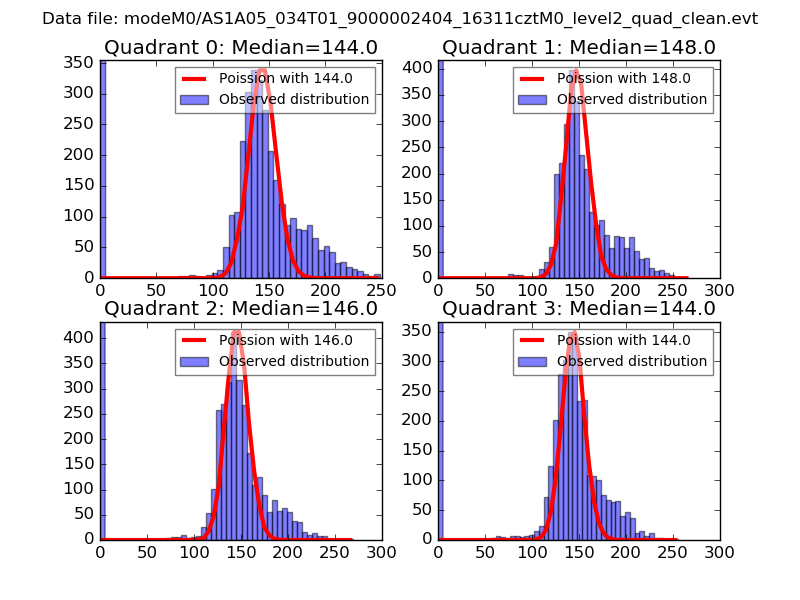
| Comparison with Poisson distribution Blue bars denote a histogram of data divided into 1 sec bins. Red curve is a Poisson curve with rate = median count rate of data. |
 |
 |
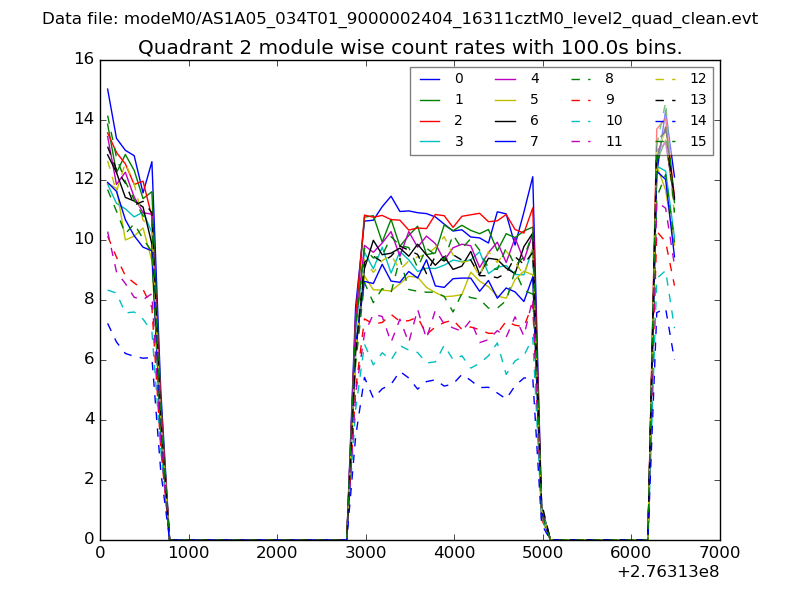
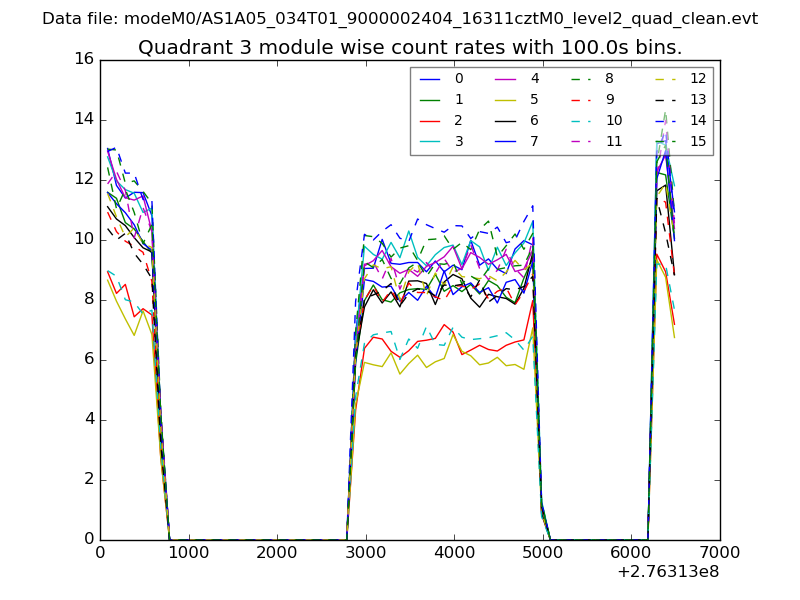
| Quadrant-wise count rates Data is divided into 100 sec bins |
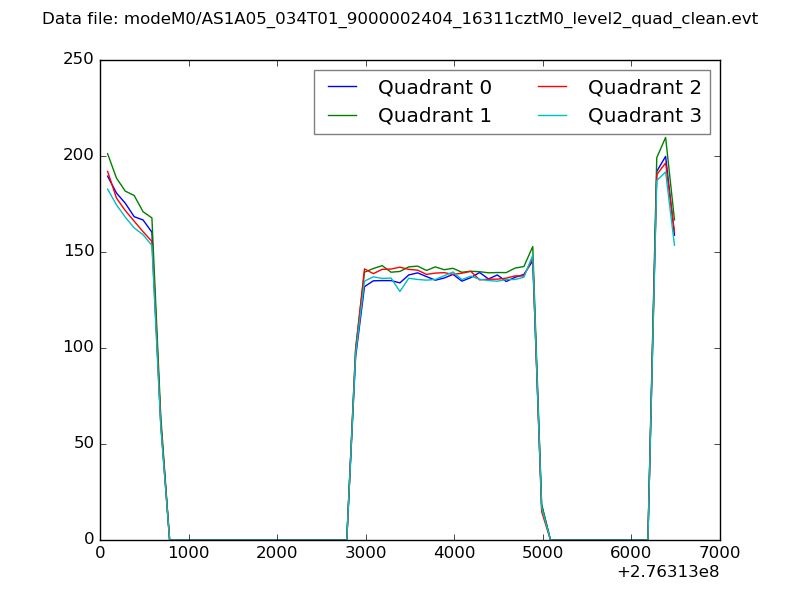 |
|
| Module-wise count rates for Quadrant A Data is divided into 100 sec bins |
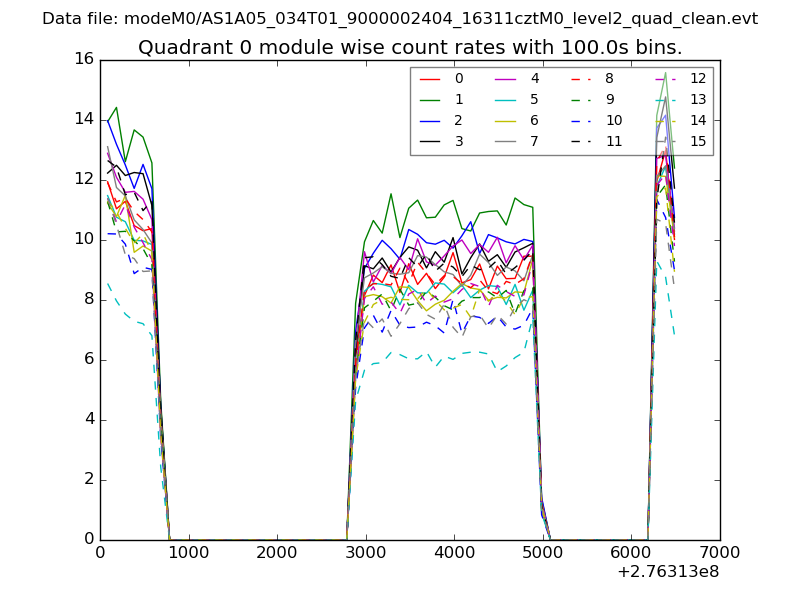 |
 |
| Module-wise count rates for Quadrant B Data is divided into 100 sec bins |
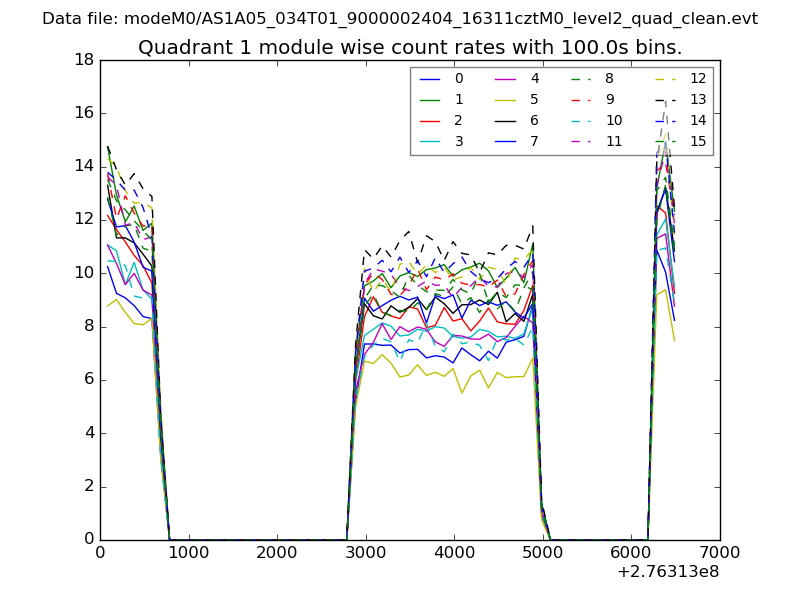 |
 |
| Module-wise count rates for Quadrant C Data is divided into 100 sec bins |
 |
 |
| Module-wise count rates for Quadrant D Data is divided into 100 sec bins |
 |
 |
| Parameter | Plot |
|---|---|
| CZT HV Monitor | 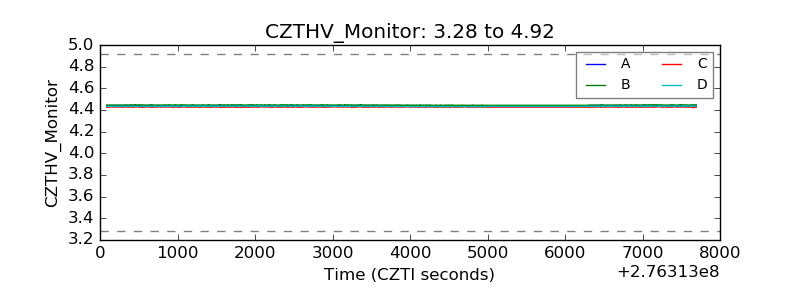 |
| D_VDD | 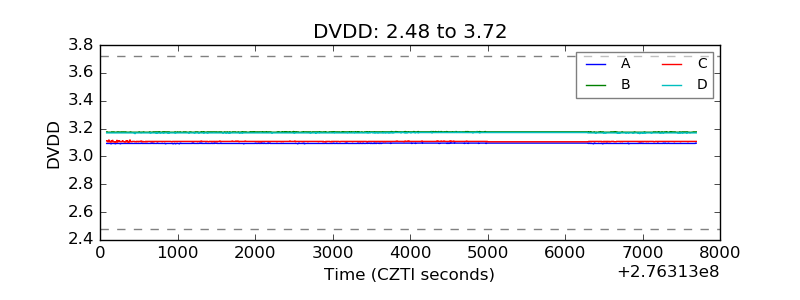 |
| Temperature 1 | 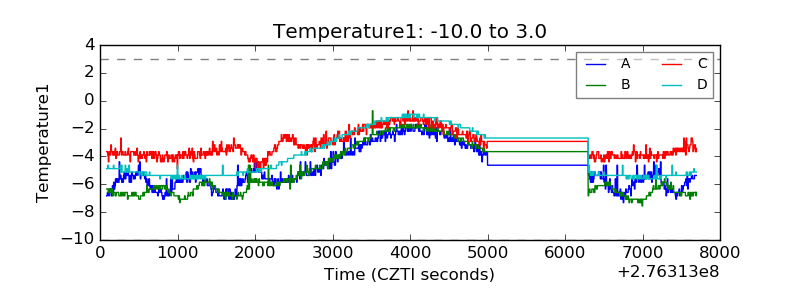 |
| Veto HV Monitor | 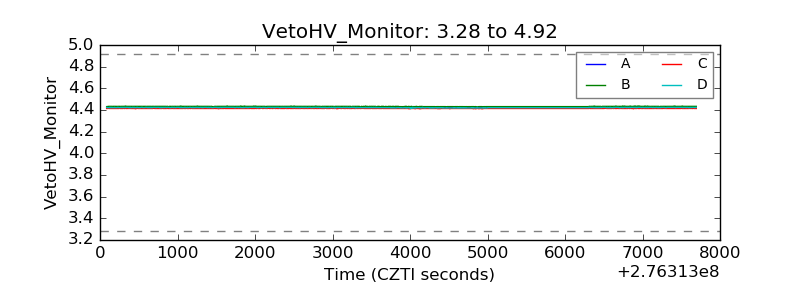 |
| Veto LLD |  |
| Alpha Counter | 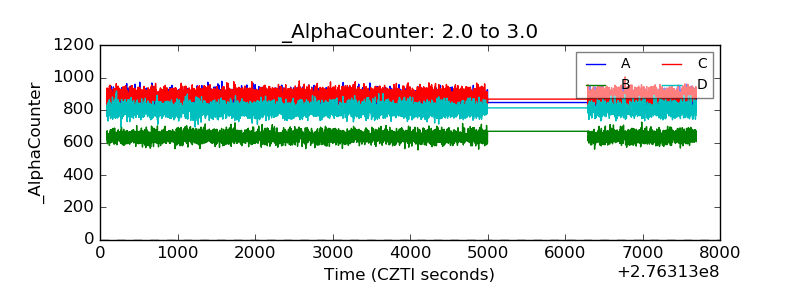 |
| _CPM_Rate | 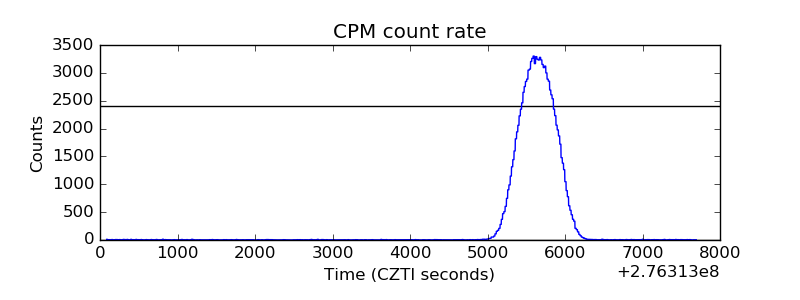 |
| CZT Counter |  |
| +2.5 Volts monitor |  |
| +5 Volts monitor |  |
| _ROLL_ROT | 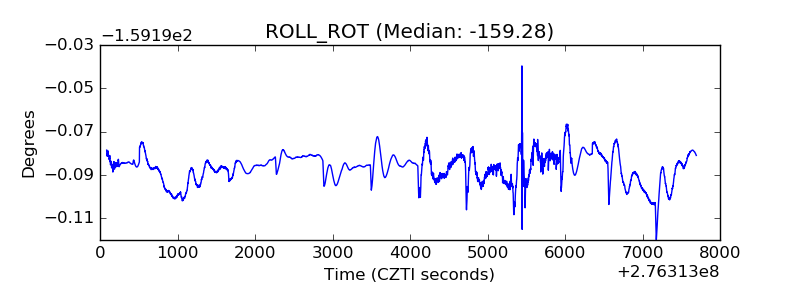 |
| _Roll_DEC | 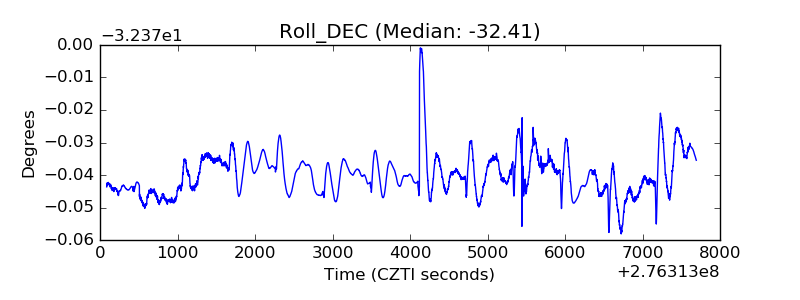 |
| _Roll_RA | 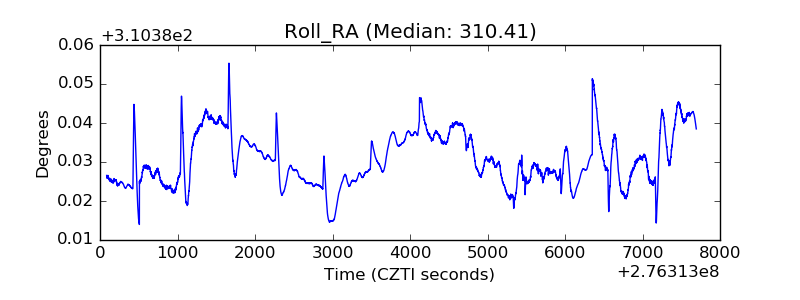 |
| Veto Counter | 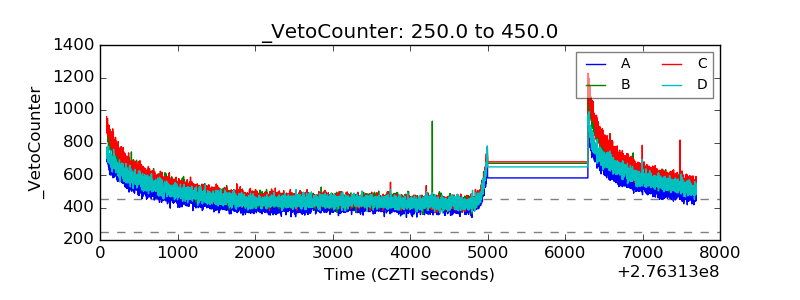 |