| Param | Original file | Final file |
|---|---|---|
| Filename | modeM0/AS1A05_034T01_9000002404_16312cztM0_level2.evt | modeM0/AS1A05_034T01_9000002404_16312cztM0_level2_quad_clean.evt |
| Size (bytes) | 468,239,040 | 61,398,720 |
| Size | 446.5 MB | 58.6 MB |
| Events in quadrant A | 3,860,726 | 333,813 |
| Events in quadrant B | 3,368,652 | 376,082 |
| Events in quadrant C | 3,245,093 | 370,571 |
| Events in quadrant D | 3,302,186 | 362,511 |
| Mode M0 | |||
|---|---|---|---|
| Quadrant | BADHDUFLAG | Total packets | Discarded packets |
| A | 0 | 14852 | 2 |
| B | 0 | 13526 | 1 |
| C | 0 | 13080 | 1 |
| D | 0 | 13269 | 1 |
| Mode SS | |||
|---|---|---|---|
| Quadrant | BADHDUFLAG | Total packets | Discarded packets |
| A | 0 | 120 | 0 |
| B | 0 | 120 | 0 |
| C | 0 | 120 | 0 |
| D | 0 | 120 | 0 |
| Mode M9 | |||
|---|---|---|---|
| Quadrant | BADHDUFLAG | Total packets | Discarded packets |
| A | 0 | 14 | 0 |
| B | 0 | 14 | 0 |
| C | 0 | 14 | 0 |
| D | 0 | 14 | 0 |
| Quadrant | Total seconds | Saturated seconds | Saturation percentage |
|---|---|---|---|
| A | 5954 | 369 | 6.197514% |
| B | 5954 | 88 | 1.477998% |
| C | 5954 | 101 | 1.696339% |
| D | 5954 | 96 | 1.612361% |
Noise dominated data is calculated using 1-second bins in cleaned event files. If a bin has >2000 counts, and if more than 50% of those come from <1% of pixels, then it is considered to be noise-dominated and hence unusable.
| Quadrant | # 1 sec bins | Bins with >0 counts | Bins with >2000 counts | High rate bins dominated by noise | Noise dominated (total time) | Noise dominated (detector-on time) | Marked lightcurve |
|---|---|---|---|---|---|---|---|
| A | 7310 | 5956 | 256 | 256 | 3.50% | 4.30% | 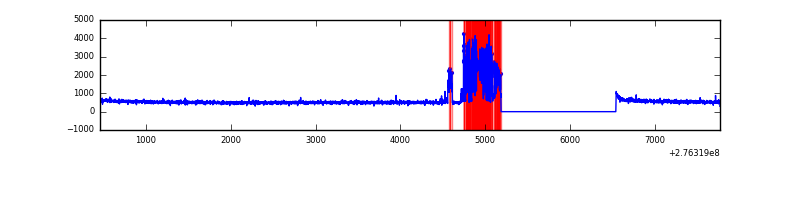 |
| B | 7310 | 5956 | 8 | 8 | 0.11% | 0.13% | 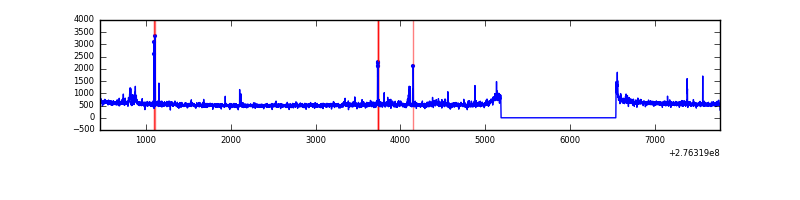 |
| C | 7310 | 5956 | 0 | 0 | 0.00% | 0.00% | 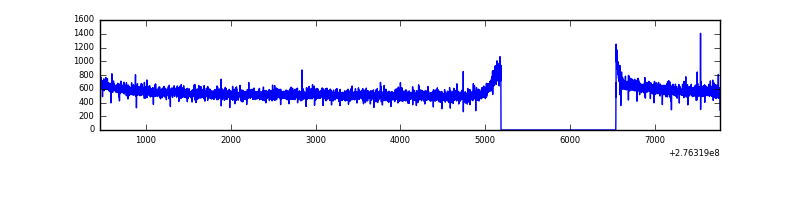 |
| D | 7310 | 5956 | 27 | 27 | 0.37% | 0.45% | 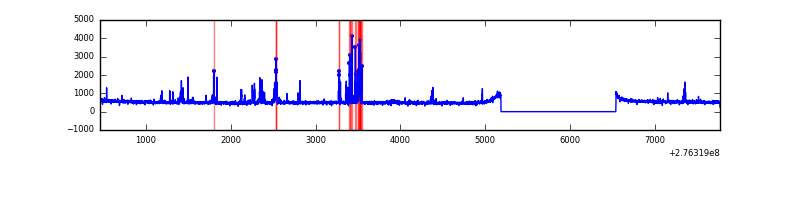 |
Top three noisy pixels from each quadrant. If the there are fewer than three noisy pixels in the level2.evt file, extra rows are filled as -1
| Pixel properties | Quadrant properties | ||||||
|---|---|---|---|---|---|---|---|
| Quadrant | DetID | PixID | Counts | Sigma | Mean | Median | Sigma |
| A | 15 | 174 | 851427 | 5447.11 | 783 | 767 | 156.2 |
| A | 0 | 226 | 6856 | 38.99 | 783 | 767 | 156.2 |
| A | 12 | 194 | 5784 | 32.13 | 783 | 767 | 156.2 |
| B | 0 | 198 | 41478 | 269.77 | 818 | 803 | 150.8 |
| B | 15 | 35 | 40477 | 263.13 | 818 | 803 | 150.8 |
| B | 4 | 173 | 25736 | 165.36 | 818 | 803 | 150.8 |
| C | 14 | 238 | 125382 | 683.84 | 796 | 804 | 182.2 |
| C | 3 | 233 | 15890 | 82.81 | 796 | 804 | 182.2 |
| C | 13 | 61 | 5797 | 27.41 | 796 | 804 | 182.2 |
| D | 2 | 122 | 148111 | 756.8 | 797 | 780 | 194.7 |
| D | 10 | 70 | 102277 | 521.36 | 797 | 780 | 194.7 |
| D | 2 | 234 | 21611 | 107.0 | 797 | 780 | 194.7 |
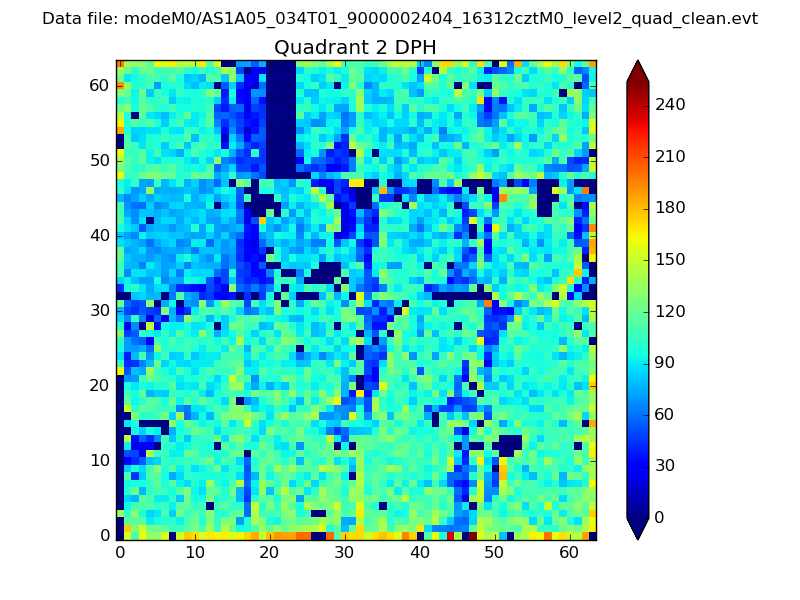
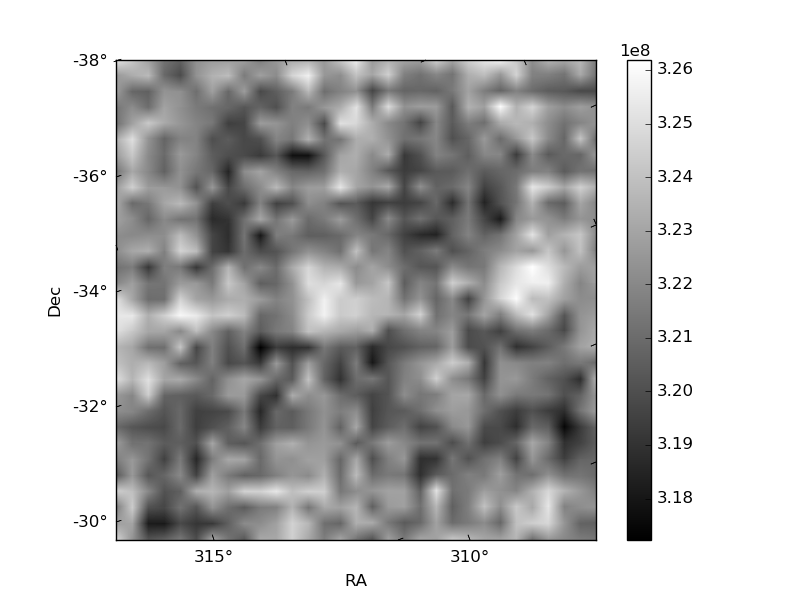
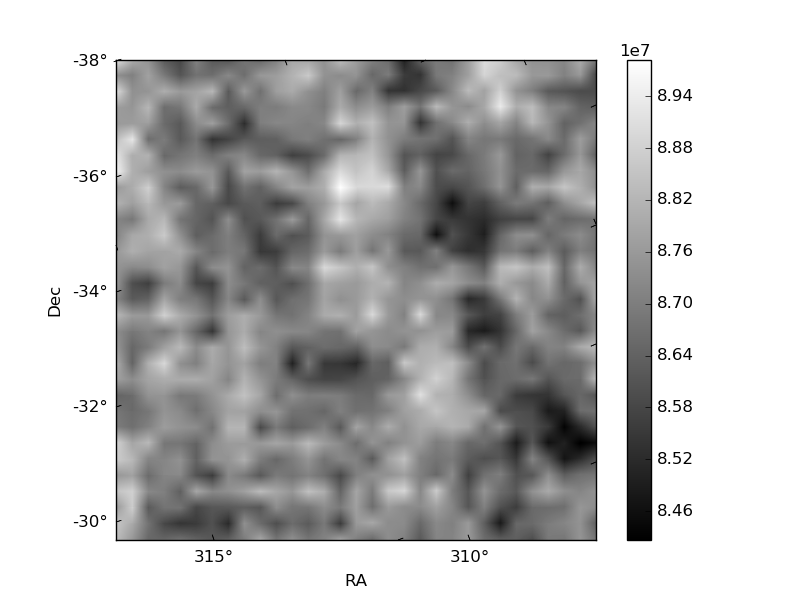
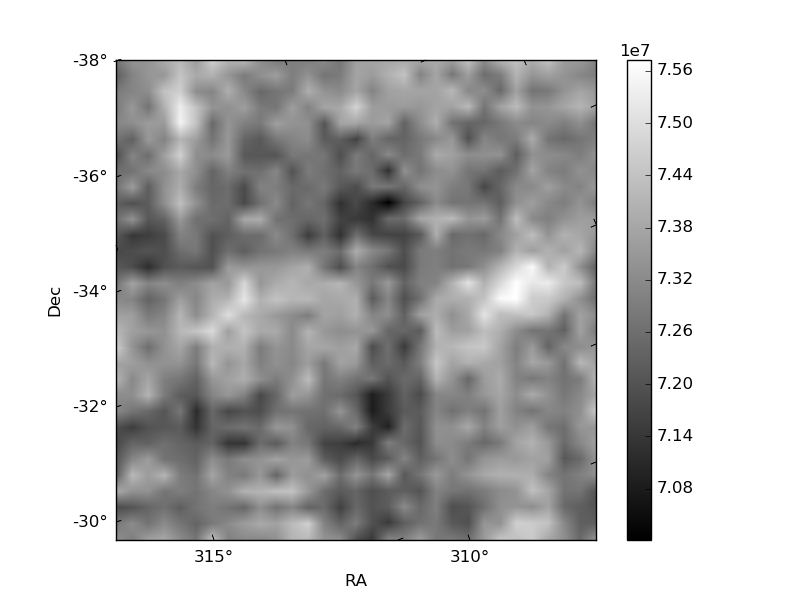
Histogram calculated using DETX and DETY for each event in the final _common_clean file
| Quadrant A | 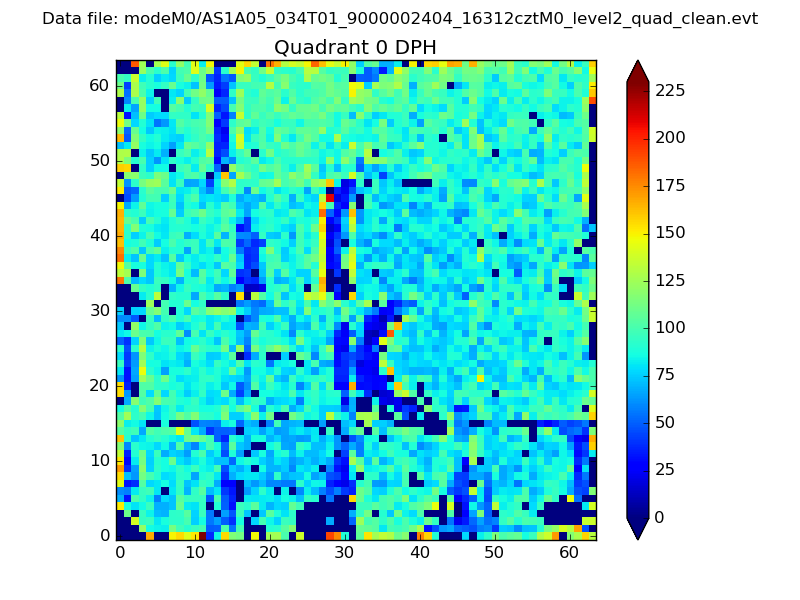 |
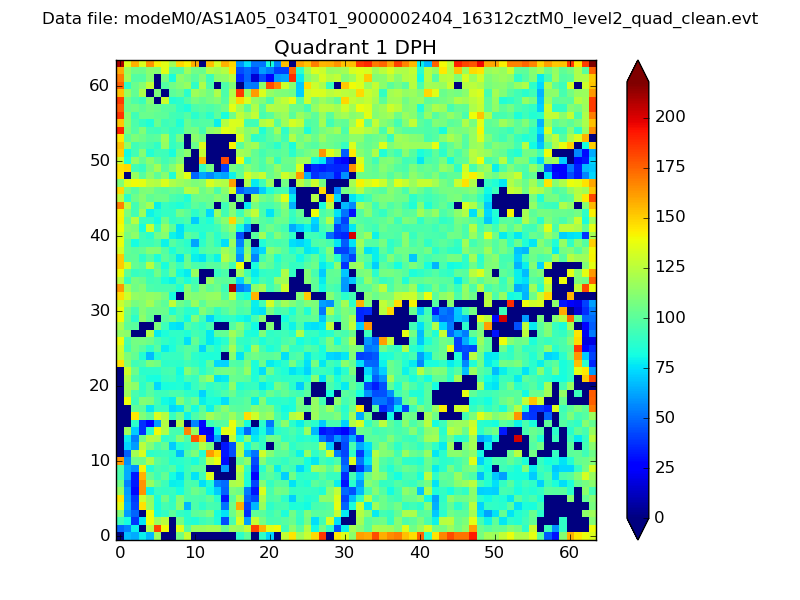 |
Quadrant B |
|---|---|---|---|
| Quadrant D | 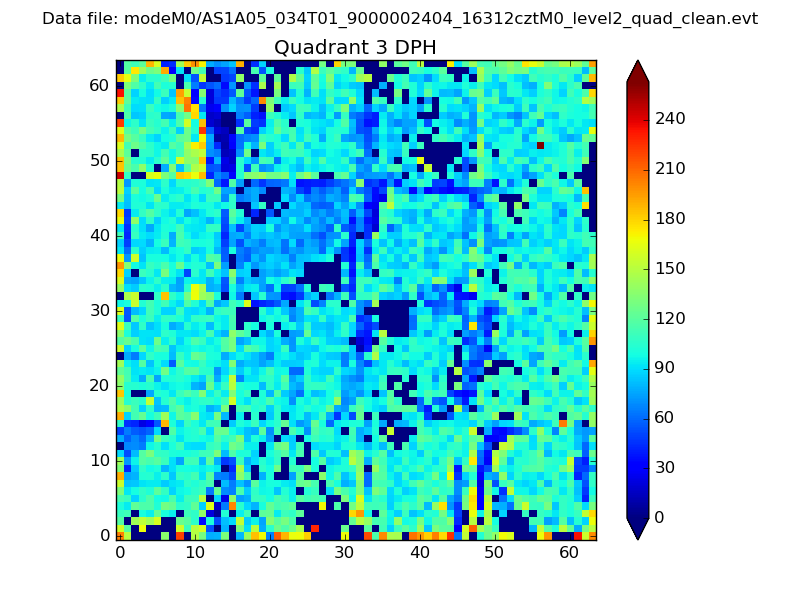 |
 |
Quadrant C |
| Plot type | Count rate plots | Images |
|---|---|---|
| Comparison with Poisson distribution Blue bars denote a histogram of data divided into 1 sec bins. Red curve is a Poisson curve with rate = median count rate of data. |
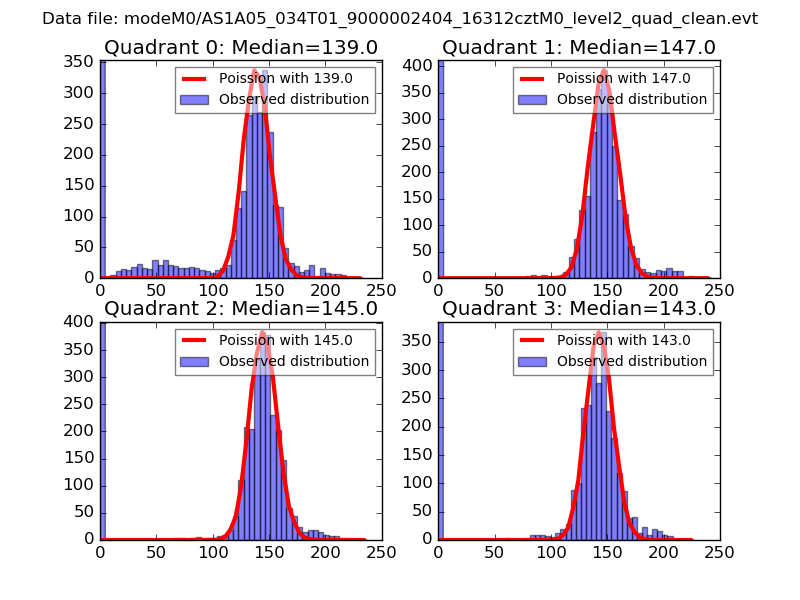 |
 |
| Quadrant-wise count rates Data is divided into 100 sec bins |
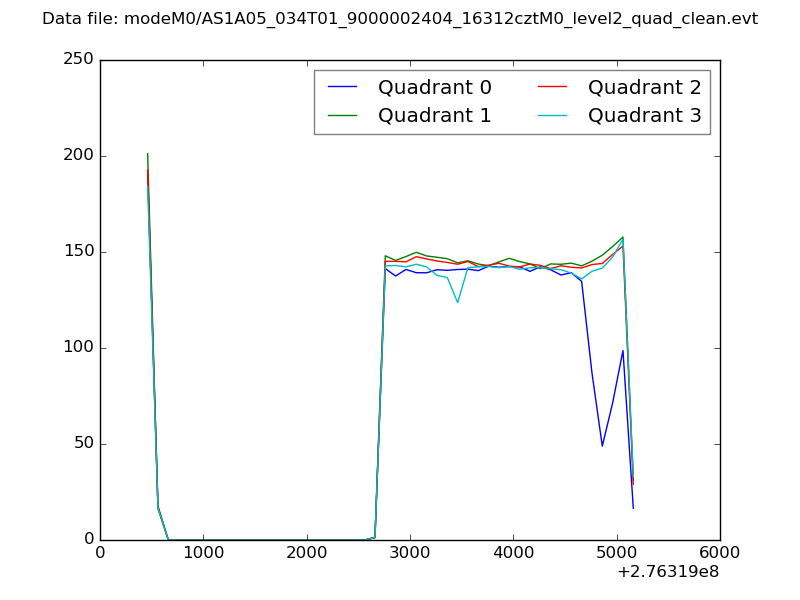 |
|
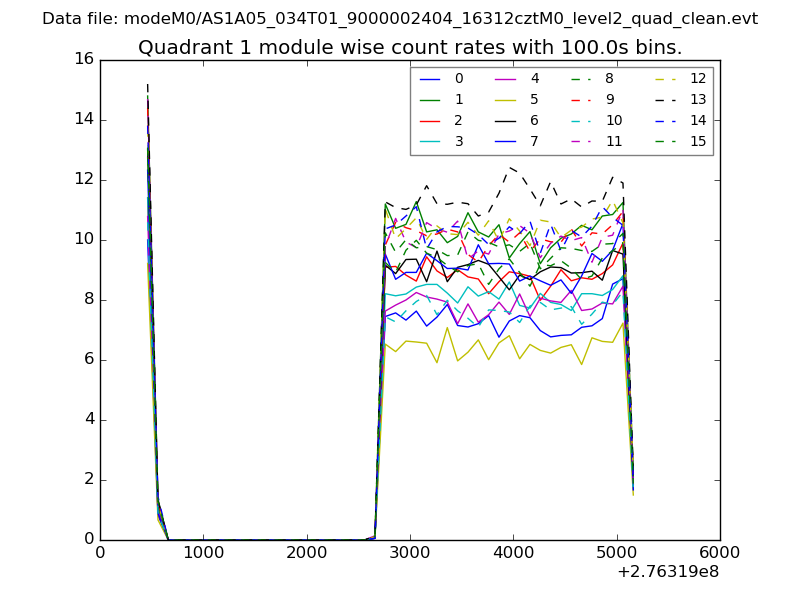
| Module-wise count rates for Quadrant A Data is divided into 100 sec bins |
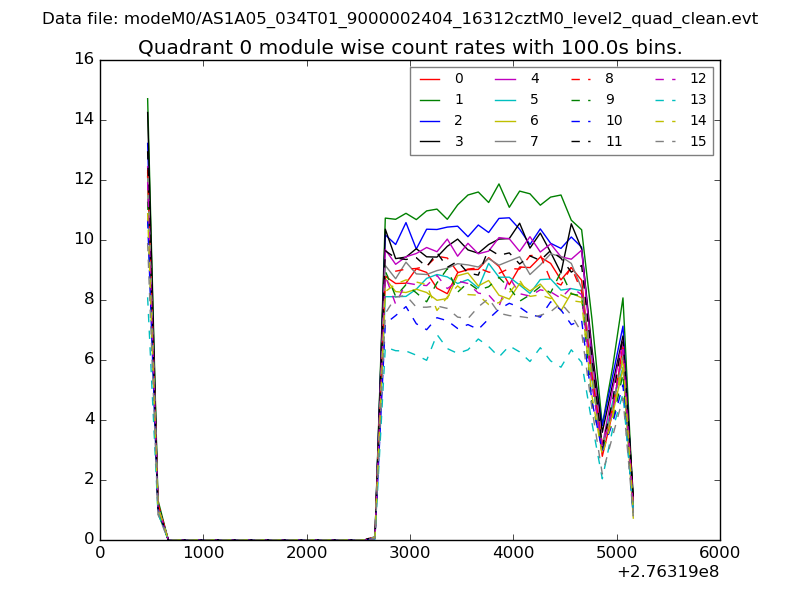 |
 |
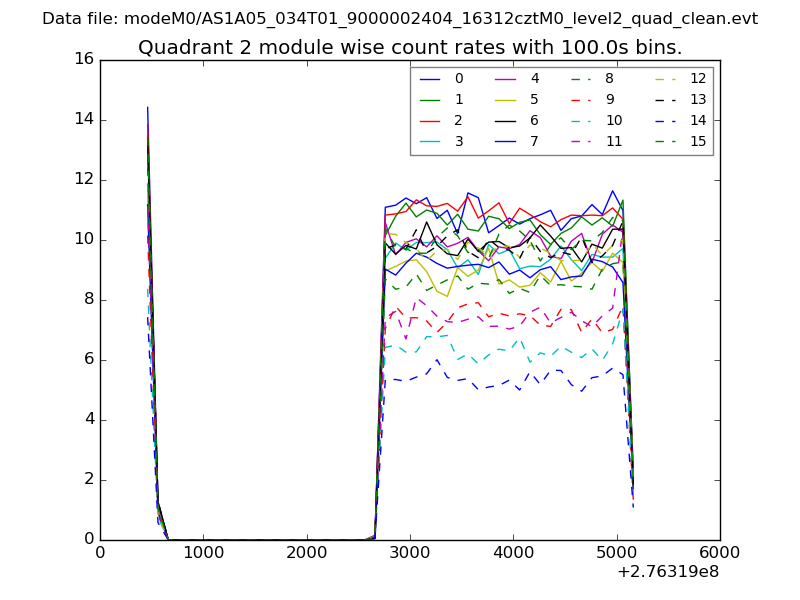
| Module-wise count rates for Quadrant B Data is divided into 100 sec bins |
 |
 |
| Module-wise count rates for Quadrant C Data is divided into 100 sec bins |
 |
 |
| Module-wise count rates for Quadrant D Data is divided into 100 sec bins |
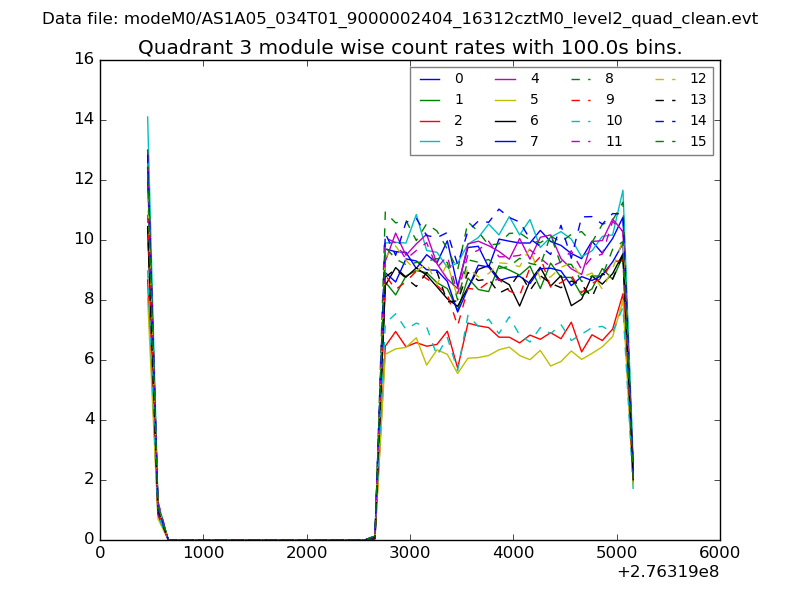 |
 |
| Parameter | Plot |
|---|---|
| CZT HV Monitor | 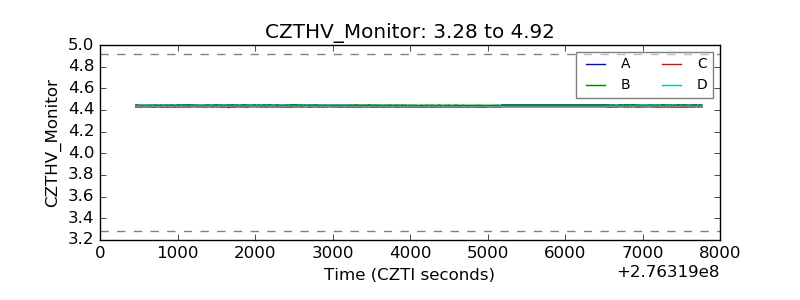 |
| D_VDD | 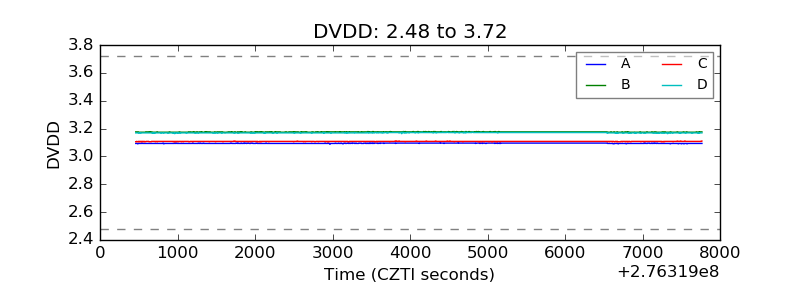 |
| Temperature 1 | 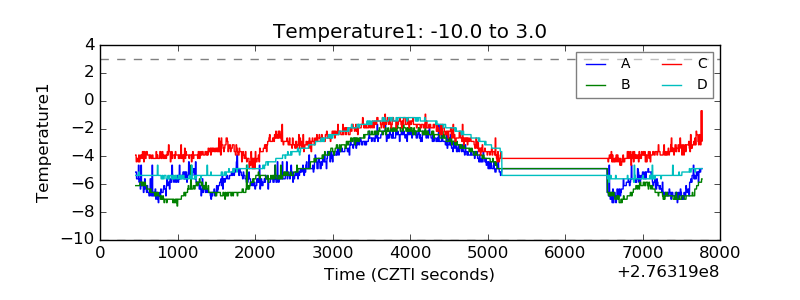 |
| Veto HV Monitor | 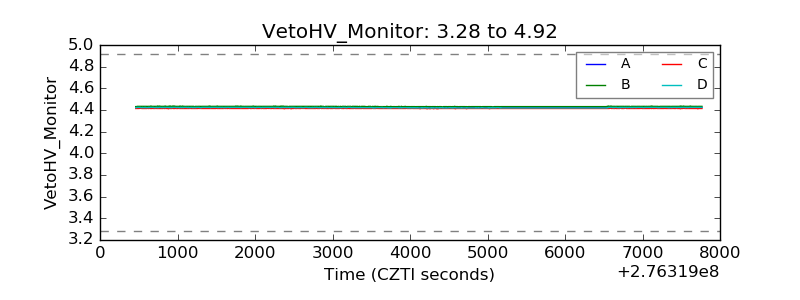 |
| Veto LLD | 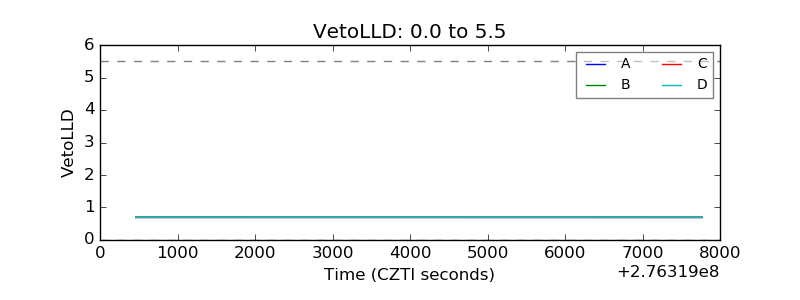 |
| Alpha Counter | 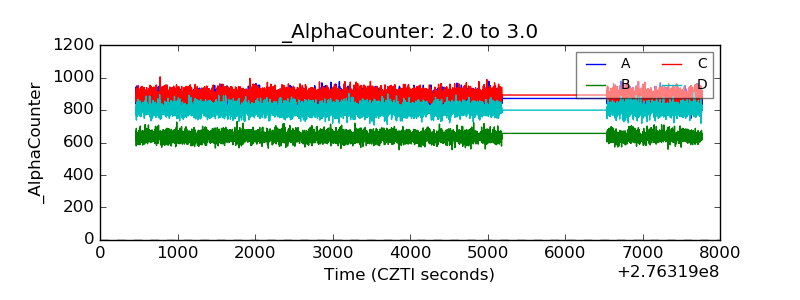 |
| _CPM_Rate | 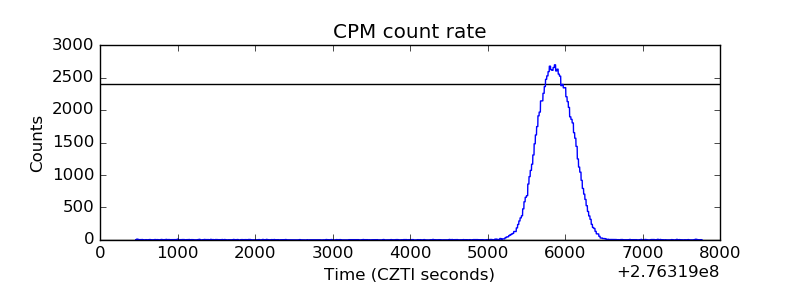 |
| CZT Counter | 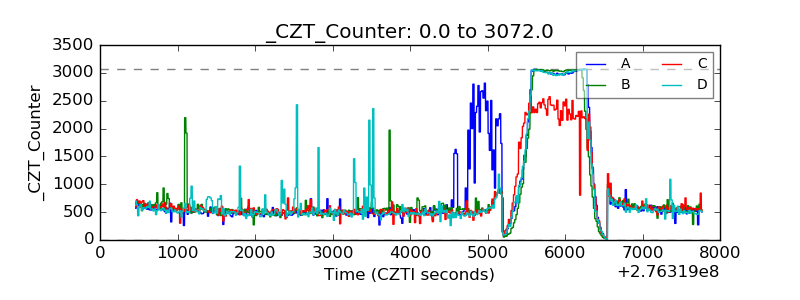 |
| +2.5 Volts monitor |  |
| +5 Volts monitor |  |
| _ROLL_ROT | 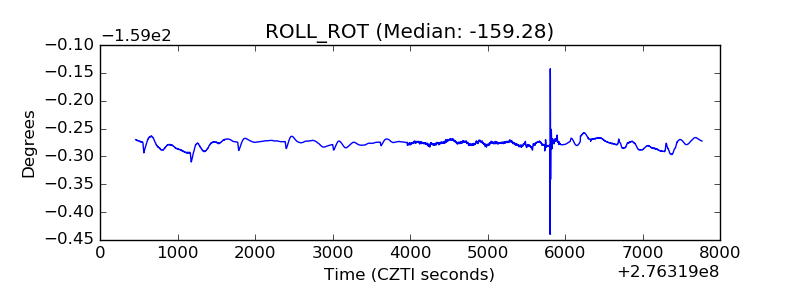 |
| _Roll_DEC | 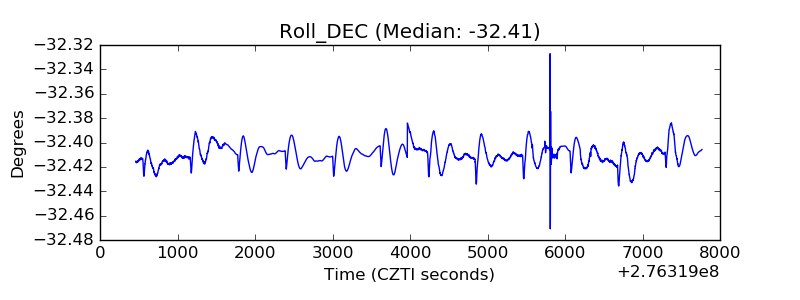 |
| _Roll_RA | 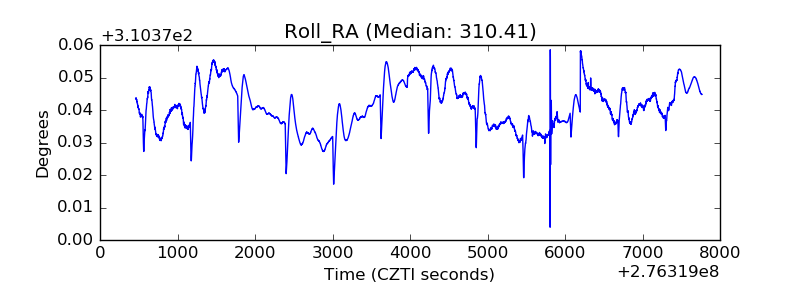 |
| Veto Counter | 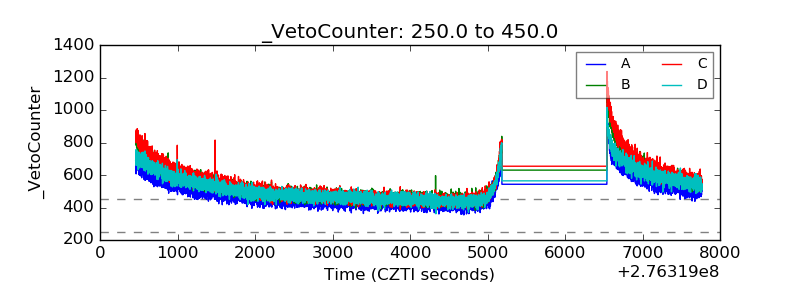 |