| Param | Original file | Final file |
|---|---|---|
| Filename | modeM0/AS1A05_034T01_9000002404_16313cztM0_level2.evt | modeM0/AS1A05_034T01_9000002404_16313cztM0_level2_quad_clean.evt |
| Size (bytes) | 505,661,760 | 67,890,240 |
| Size | 482.2 MB | 64.7 MB |
| Events in quadrant A | 4,579,512 | 388,121 |
| Events in quadrant B | 3,511,933 | 417,232 |
| Events in quadrant C | 3,399,780 | 411,602 |
| Events in quadrant D | 3,402,621 | 406,140 |
| Mode M0 | |||
|---|---|---|---|
| Quadrant | BADHDUFLAG | Total packets | Discarded packets |
| A | 0 | 17208 | 3 |
| B | 0 | 14031 | 2 |
| C | 0 | 13746 | 2 |
| D | 0 | 13711 | 2 |
| Mode SS | |||
|---|---|---|---|
| Quadrant | BADHDUFLAG | Total packets | Discarded packets |
| A | 0 | 128 | 0 |
| B | 0 | 128 | 0 |
| C | 0 | 128 | 0 |
| D | 0 | 128 | 0 |
| Mode M9 | |||
|---|---|---|---|
| Quadrant | BADHDUFLAG | Total packets | Discarded packets |
| A | 0 | 27 | 0 |
| B | 0 | 27 | 0 |
| C | 0 | 27 | 0 |
| D | 0 | 27 | 0 |
| Quadrant | Total seconds | Saturated seconds | Saturation percentage |
|---|---|---|---|
| A | 6192 | 517 | 8.349483% |
| B | 6192 | 142 | 2.293282% |
| C | 6192 | 160 | 2.583979% |
| D | 6192 | 114 | 1.841085% |
Noise dominated data is calculated using 1-second bins in cleaned event files. If a bin has >2000 counts, and if more than 50% of those come from <1% of pixels, then it is considered to be noise-dominated and hence unusable.
| Quadrant | # 1 sec bins | Bins with >0 counts | Bins with >2000 counts | High rate bins dominated by noise | Noise dominated (total time) | Noise dominated (detector-on time) | Marked lightcurve |
|---|---|---|---|---|---|---|---|
| A | 8873 | 6195 | 334 | 334 | 3.76% | 5.39% | 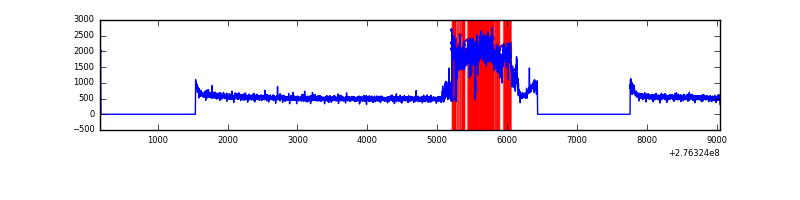 |
| B | 8873 | 6195 | 3 | 3 | 0.03% | 0.05% | 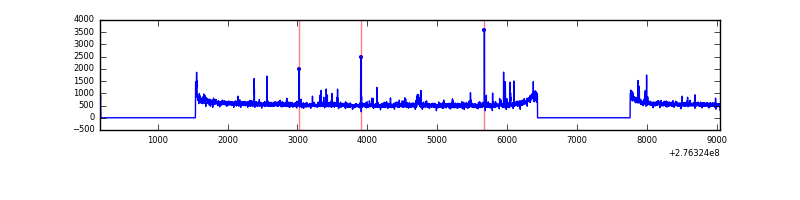 |
| C | 8873 | 6195 | 0 | 0 | 0.00% | 0.00% | 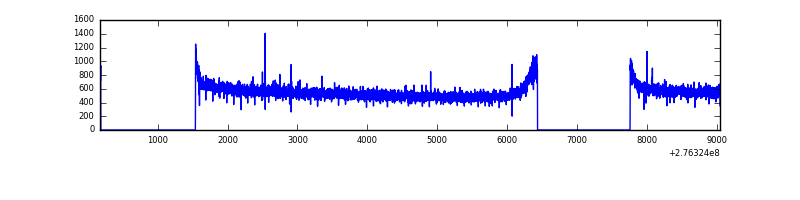 |
| D | 8873 | 6195 | 10 | 10 | 0.11% | 0.16% | 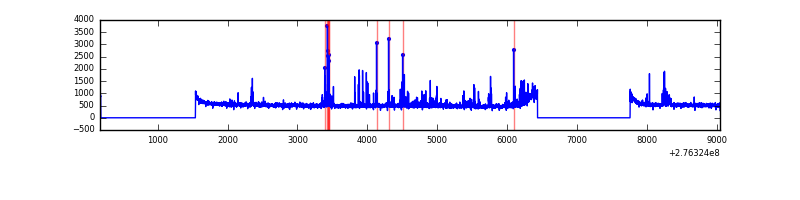 |
Top three noisy pixels from each quadrant. If the there are fewer than three noisy pixels in the level2.evt file, extra rows are filled as -1
| Pixel properties | Quadrant properties | ||||||
|---|---|---|---|---|---|---|---|
| Quadrant | DetID | PixID | Counts | Sigma | Mean | Median | Sigma |
| A | 15 | 174 | 1334997 | 7962.1 | 844 | 829 | 167.6 |
| A | 0 | 226 | 7430 | 39.39 | 844 | 829 | 167.6 |
| A | 12 | 194 | 6240 | 32.29 | 844 | 829 | 167.6 |
| B | 4 | 173 | 59679 | 366.58 | 859 | 840 | 160.5 |
| B | 0 | 189 | 37288 | 227.08 | 859 | 840 | 160.5 |
| B | 15 | 35 | 20886 | 124.89 | 859 | 840 | 160.5 |
| C | 14 | 238 | 130216 | 678.73 | 832 | 839 | 190.6 |
| C | 3 | 233 | 21253 | 107.09 | 832 | 839 | 190.6 |
| C | 13 | 61 | 5927 | 26.69 | 832 | 839 | 190.6 |
| D | 2 | 122 | 75442 | 369.99 | 841 | 824 | 201.7 |
| D | 12 | 110 | 72557 | 355.69 | 841 | 824 | 201.7 |
| D | 1 | 52 | 39674 | 192.64 | 841 | 824 | 201.7 |
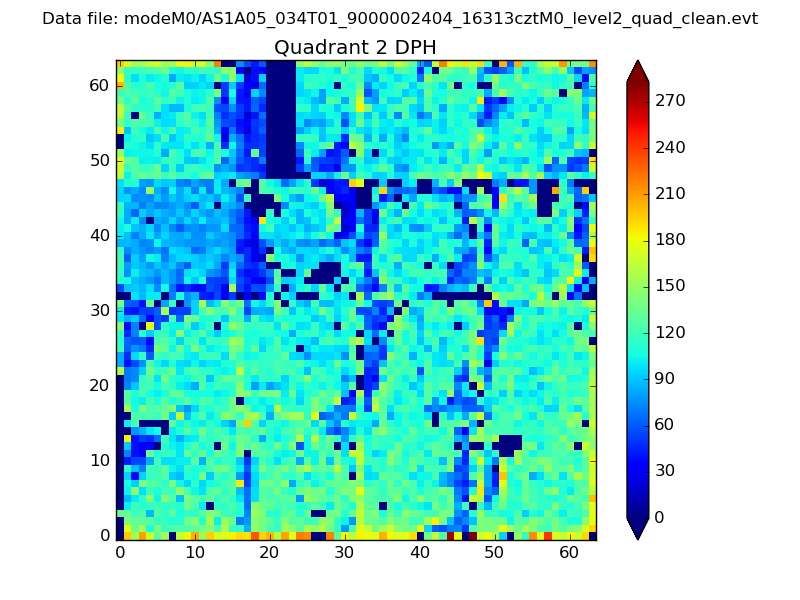
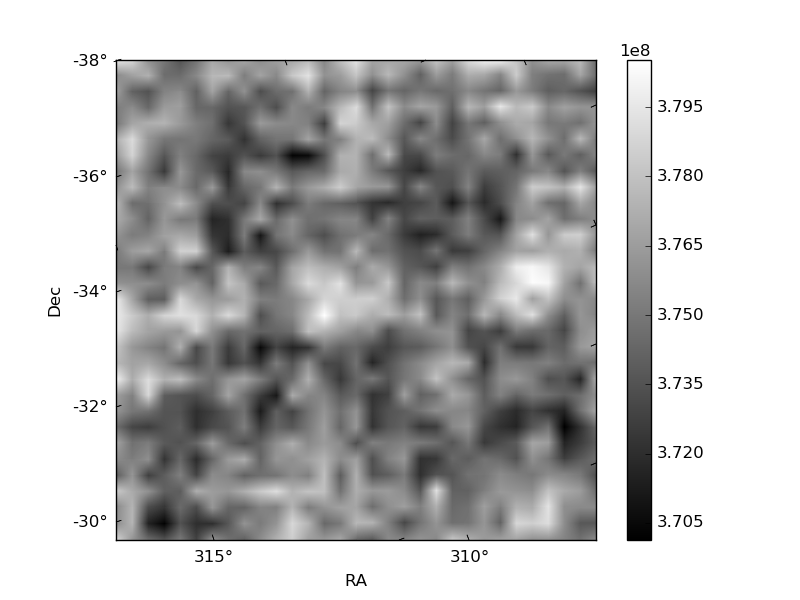
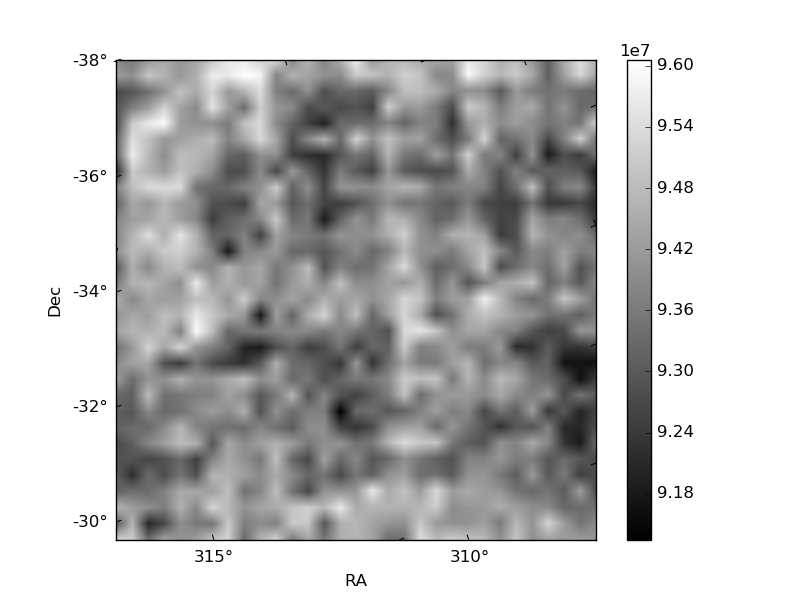
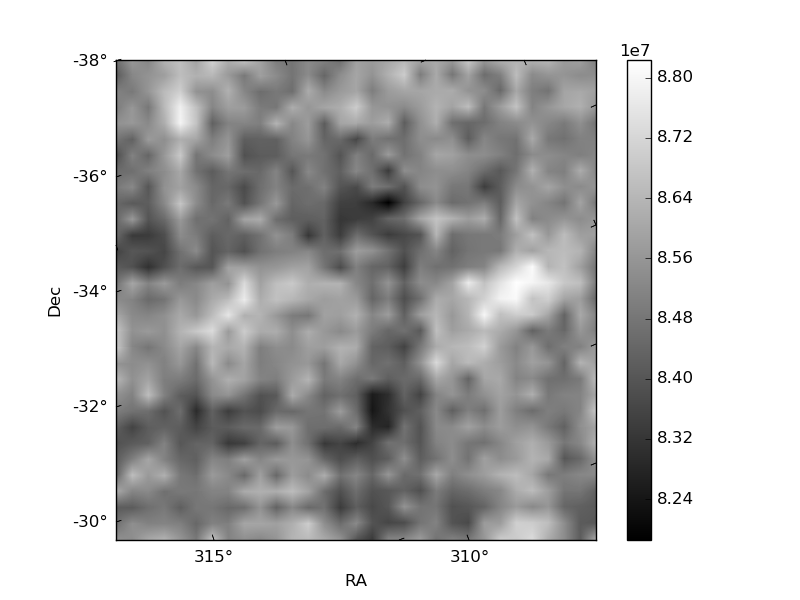
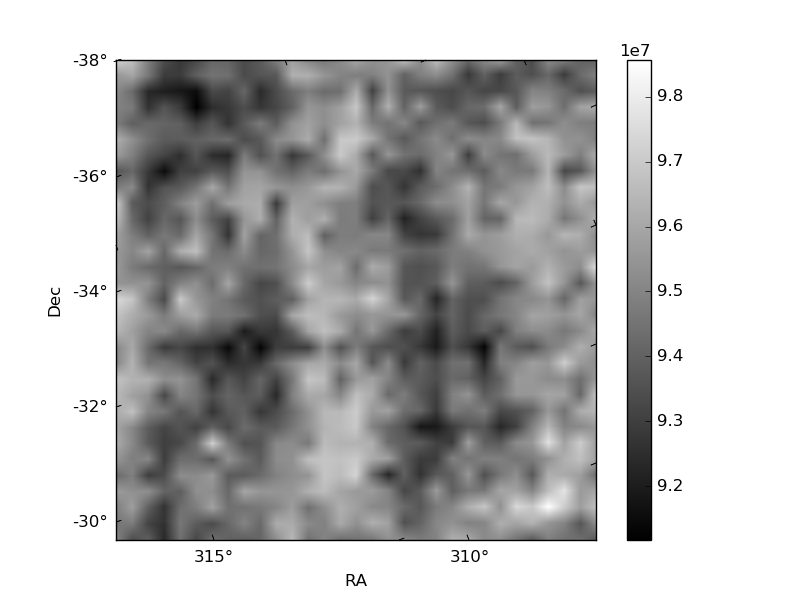
Histogram calculated using DETX and DETY for each event in the final _common_clean file
| Quadrant A | 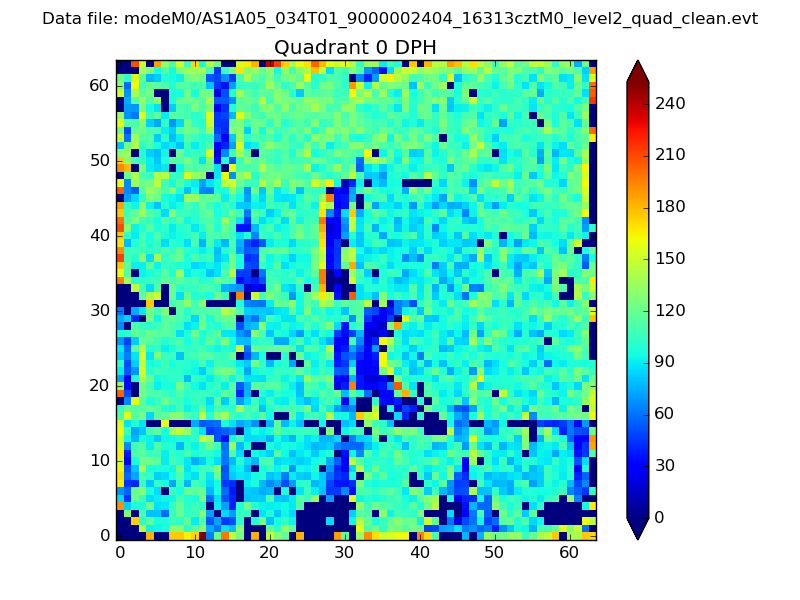 |
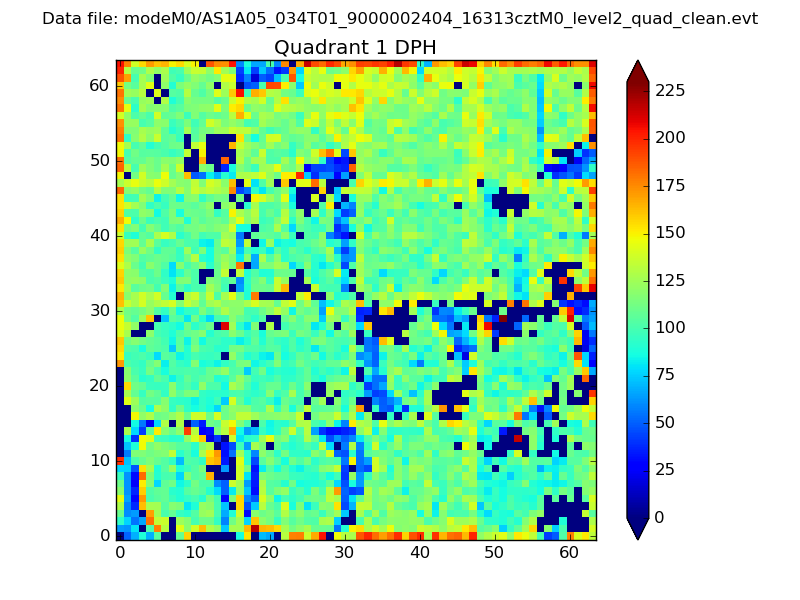 |
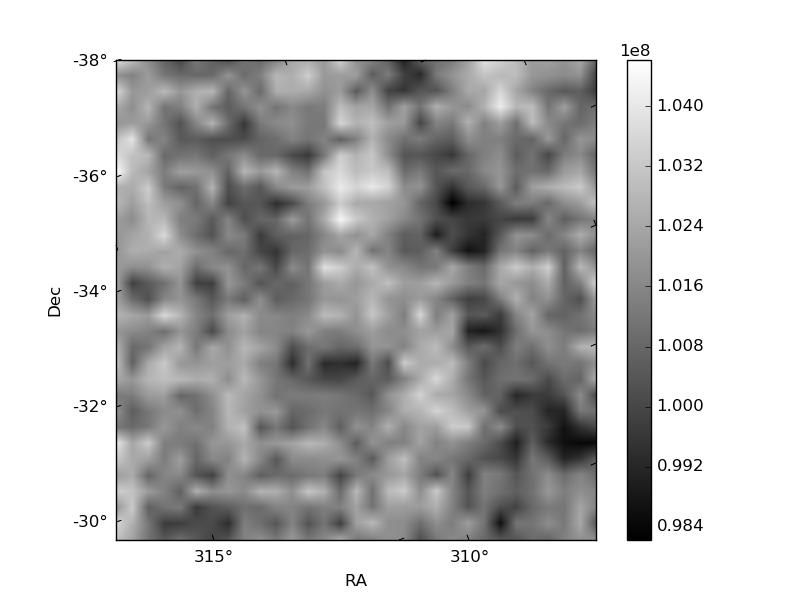
Quadrant B |
|---|---|---|---|
| Quadrant D | 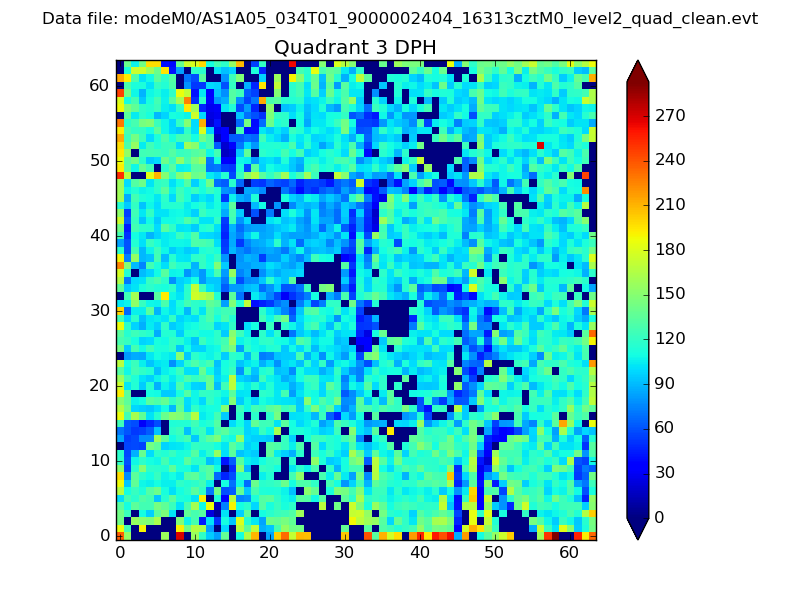 |
 |
Quadrant C |
| Plot type | Count rate plots | Images |
|---|---|---|
| Comparison with Poisson distribution Blue bars denote a histogram of data divided into 1 sec bins. Red curve is a Poisson curve with rate = median count rate of data. |
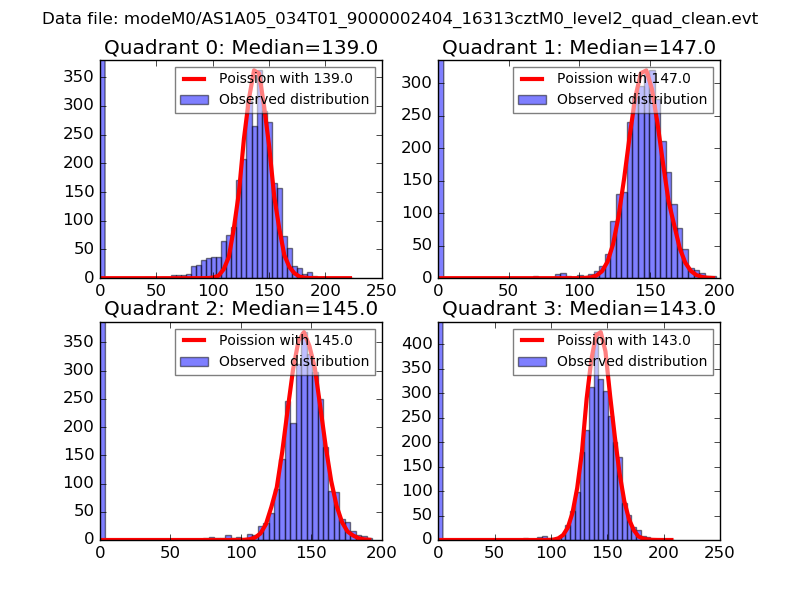 |
 |
| Quadrant-wise count rates Data is divided into 100 sec bins |
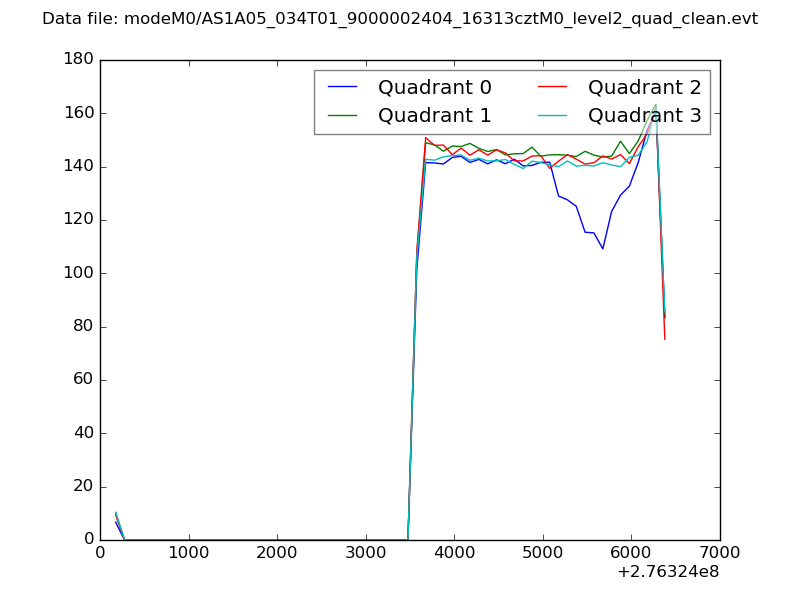 |
|
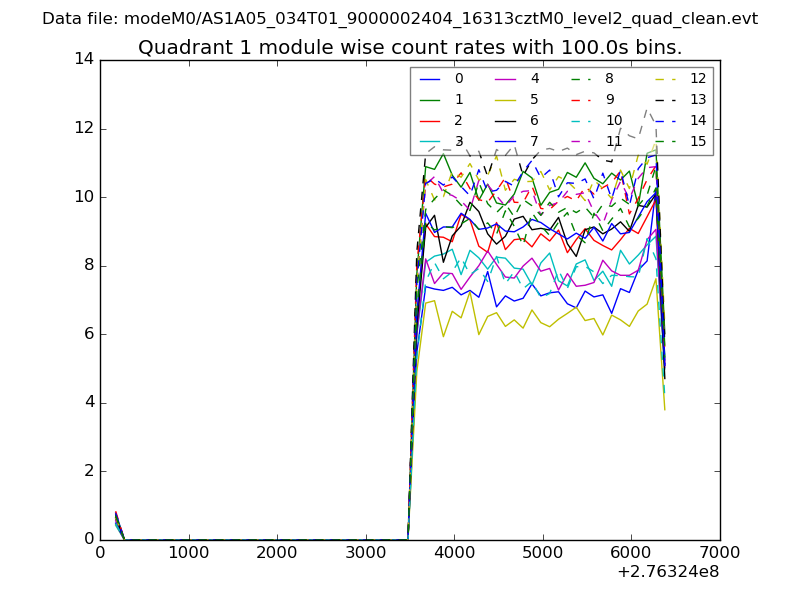
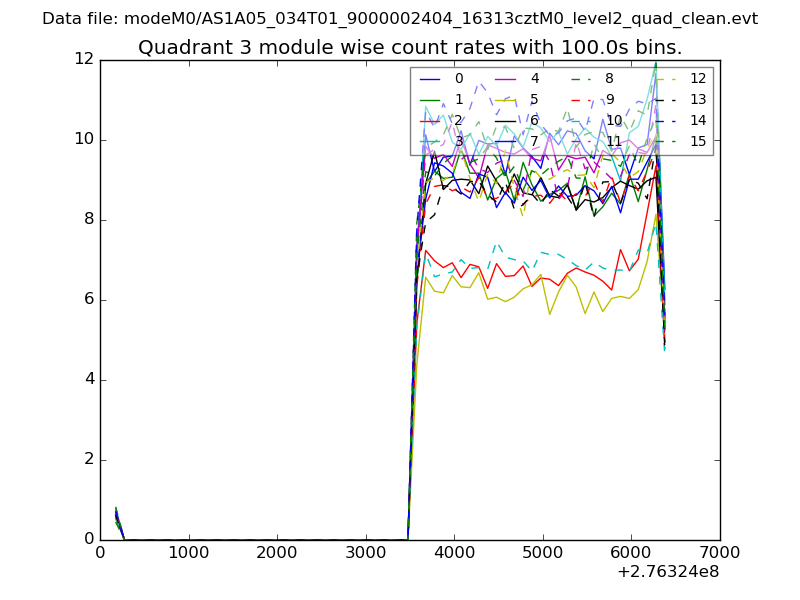
| Module-wise count rates for Quadrant A Data is divided into 100 sec bins |
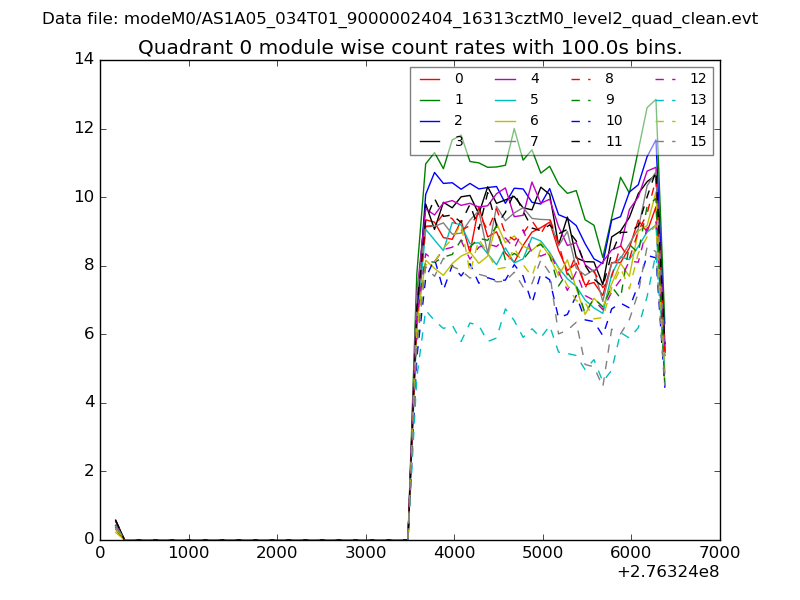 |
 |
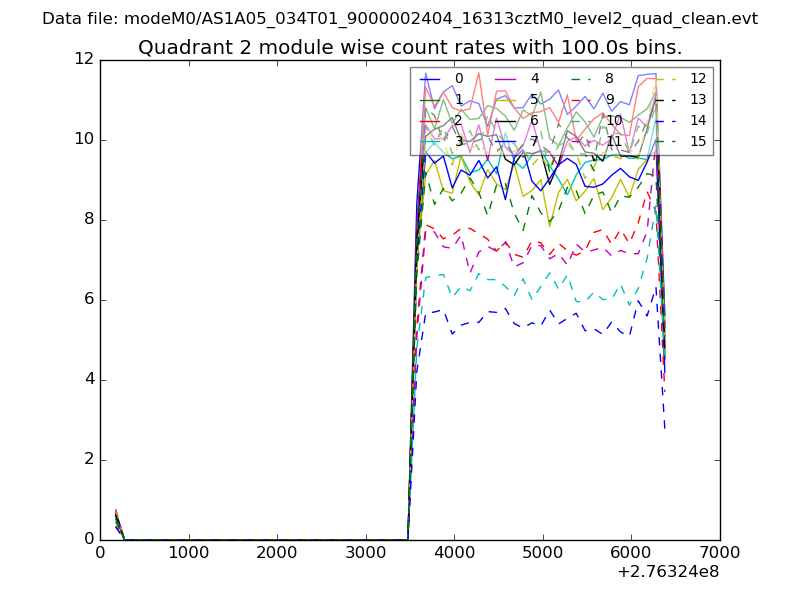
| Module-wise count rates for Quadrant B Data is divided into 100 sec bins |
 |
 |
| Module-wise count rates for Quadrant C Data is divided into 100 sec bins |
 |
 |
| Module-wise count rates for Quadrant D Data is divided into 100 sec bins |
 |
 |
| Parameter | Plot |
|---|---|
| CZT HV Monitor | 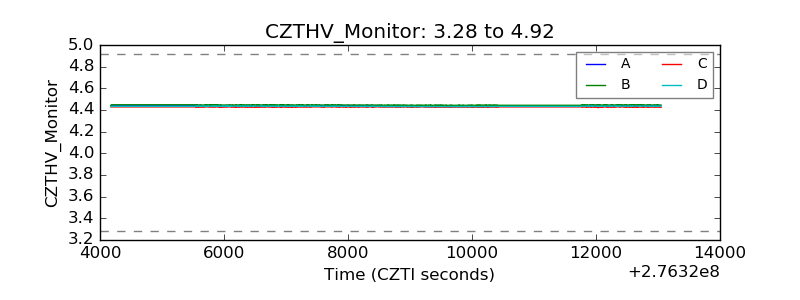 |
| D_VDD | 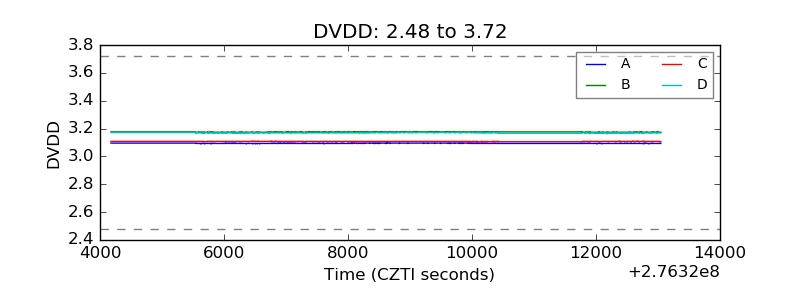 |
| Temperature 1 | 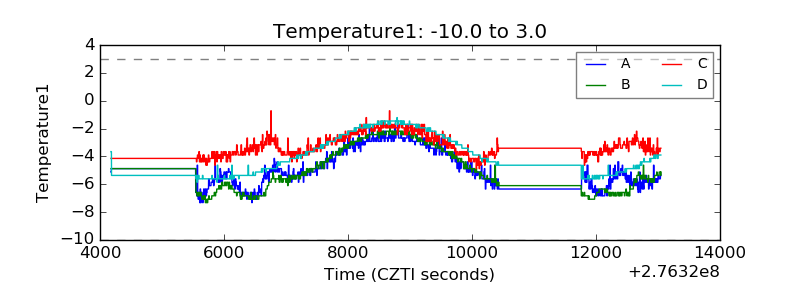 |
| Veto HV Monitor | 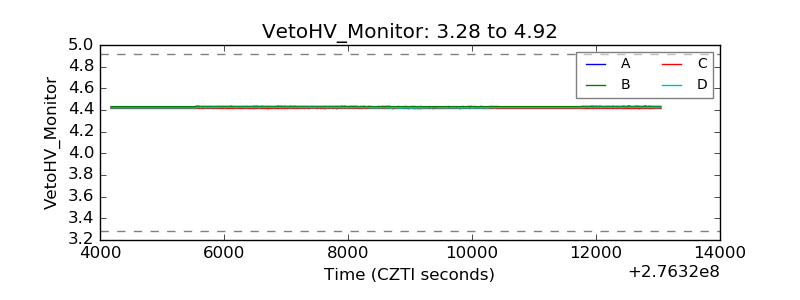 |
| Veto LLD | 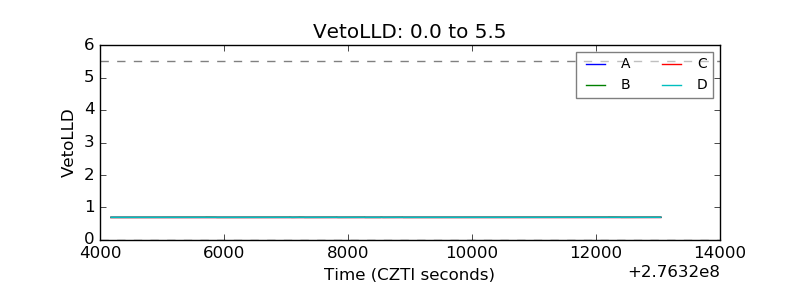 |
| Alpha Counter | 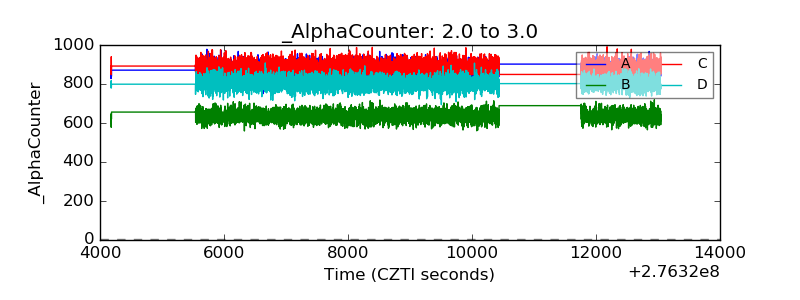 |
| _CPM_Rate | 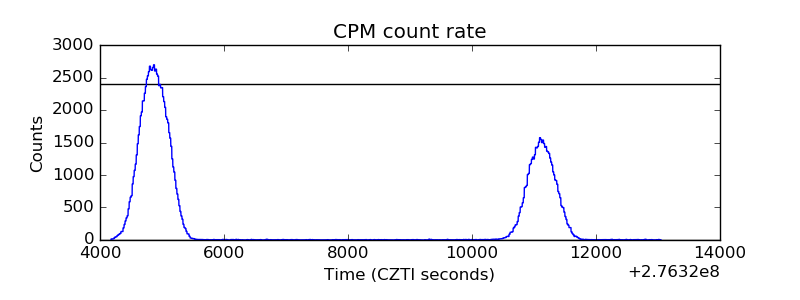 |
| CZT Counter | 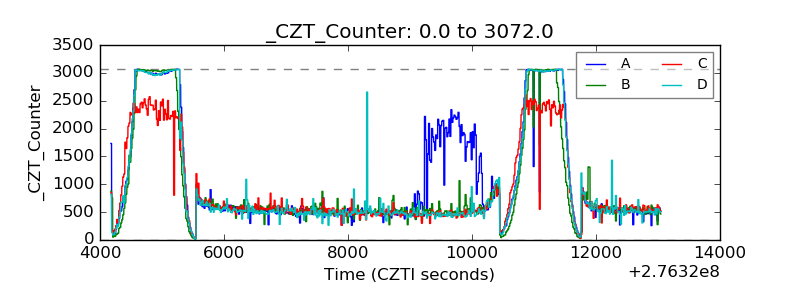 |
| +2.5 Volts monitor | 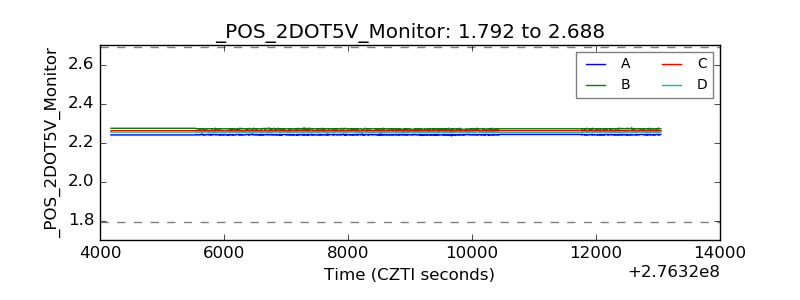 |
| +5 Volts monitor |  |
| _ROLL_ROT | 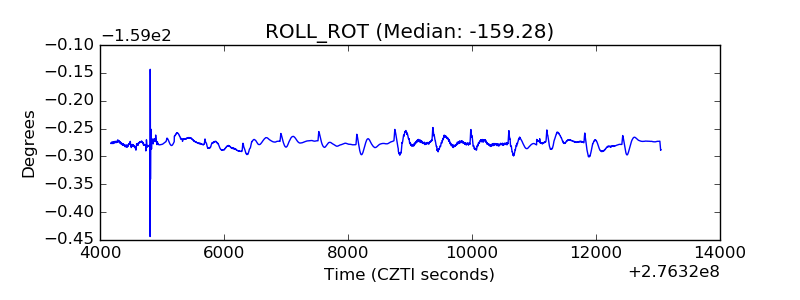 |
| _Roll_DEC | 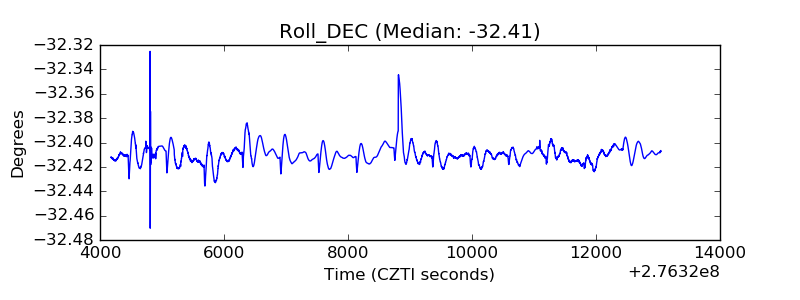 |
| _Roll_RA | 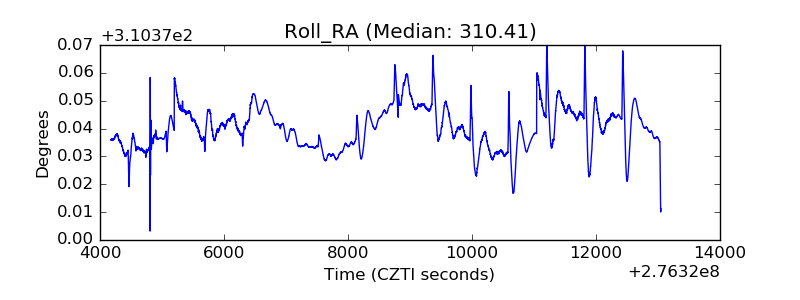 |
| Veto Counter | 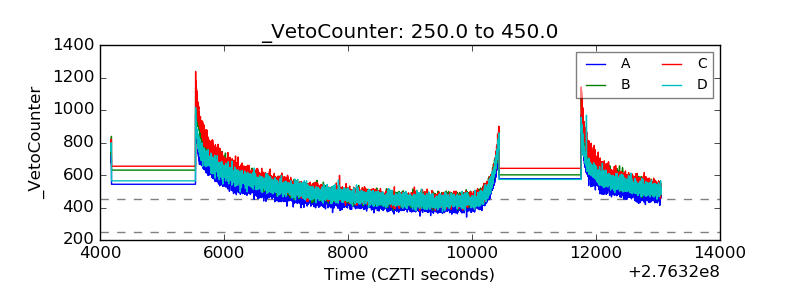 |