| Param | Original file | Final file |
|---|---|---|
| Filename | modeM0/AS1A05_034T01_9000002404_16315cztM0_level2.evt | modeM0/AS1A05_034T01_9000002404_16315cztM0_level2_quad_clean.evt |
| Size (bytes) | 258,995,520 | 49,092,480 |
| Size | 247.0 MB | 46.8 MB |
| Events in quadrant A | 1,808,203 | 305,293 |
| Events in quadrant B | 1,862,353 | 313,200 |
| Events in quadrant C | 1,832,067 | 308,563 |
| Events in quadrant D | 2,092,798 | 302,159 |
| Mode M0 | |||
|---|---|---|---|
| Quadrant | BADHDUFLAG | Total packets | Discarded packets |
| A | 0 | 7517 | 1 |
| B | 0 | 7622 | 1 |
| C | 0 | 7510 | 1 |
| D | 0 | 8510 | 1 |
| Mode SS | |||
|---|---|---|---|
| Quadrant | BADHDUFLAG | Total packets | Discarded packets |
| A | 0 | 74 | 0 |
| B | 0 | 74 | 0 |
| C | 0 | 74 | 0 |
| D | 0 | 74 | 0 |
| Mode M9 | |||
|---|---|---|---|
| Quadrant | BADHDUFLAG | Total packets | Discarded packets |
| A | 0 | 12 | 0 |
| B | 0 | 12 | 0 |
| C | 0 | 12 | 0 |
| D | 0 | 12 | 0 |
| Quadrant | Total seconds | Saturated seconds | Saturation percentage |
|---|---|---|---|
| A | 3634 | 30 | 0.825537% |
| B | 3634 | 41 | 1.128233% |
| C | 3634 | 45 | 1.238305% |
| D | 3634 | 50 | 1.375894% |
Noise dominated data is calculated using 1-second bins in cleaned event files. If a bin has >2000 counts, and if more than 50% of those come from <1% of pixels, then it is considered to be noise-dominated and hence unusable.
| Quadrant | # 1 sec bins | Bins with >0 counts | Bins with >2000 counts | High rate bins dominated by noise | Noise dominated (total time) | Noise dominated (detector-on time) | Marked lightcurve |
|---|---|---|---|---|---|---|---|
| A | 4820 | 3636 | 0 | 0 | 0.00% | 0.00% | 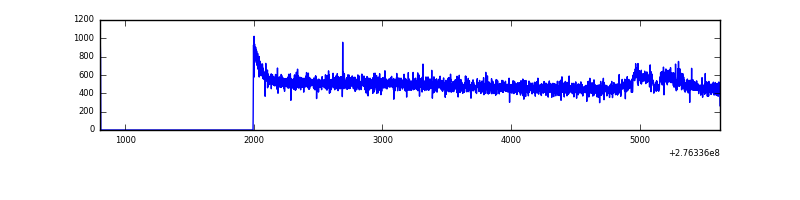 |
| B | 4820 | 3636 | 0 | 0 | 0.00% | 0.00% | 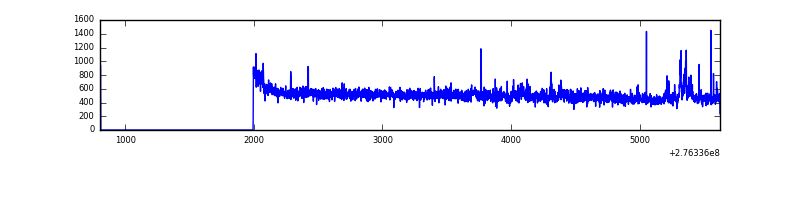 |
| C | 4820 | 3636 | 0 | 0 | 0.00% | 0.00% |  |
| D | 4820 | 3636 | 21 | 21 | 0.44% | 0.58% | 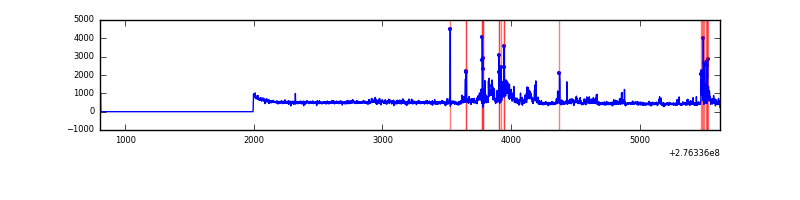 |
Top three noisy pixels from each quadrant. If the there are fewer than three noisy pixels in the level2.evt file, extra rows are filled as -1
| Pixel properties | Quadrant properties | ||||||
|---|---|---|---|---|---|---|---|
| Quadrant | DetID | PixID | Counts | Sigma | Mean | Median | Sigma |
| A | 15 | 174 | 61954 | 666.3 | 454 | 446 | 92.3 |
| A | 0 | 226 | 4059 | 39.14 | 454 | 446 | 92.3 |
| A | 12 | 194 | 3287 | 30.78 | 454 | 446 | 92.3 |
| B | 4 | 216 | 28866 | 327.5 | 452 | 442 | 86.8 |
| B | 0 | 189 | 22514 | 254.31 | 452 | 442 | 86.8 |
| B | 0 | 198 | 13880 | 154.83 | 452 | 442 | 86.8 |
| C | 14 | 238 | 69004 | 677.7 | 436 | 441 | 101.2 |
| C | 3 | 233 | 58486 | 573.73 | 436 | 441 | 101.2 |
| C | 13 | 61 | 3152 | 26.8 | 436 | 441 | 101.2 |
| D | 1 | 52 | 320532 | 2956.3 | 444 | 432 | 108.3 |
| D | 10 | 70 | 33962 | 309.67 | 444 | 432 | 108.3 |
| D | 12 | 110 | 24848 | 225.49 | 444 | 432 | 108.3 |
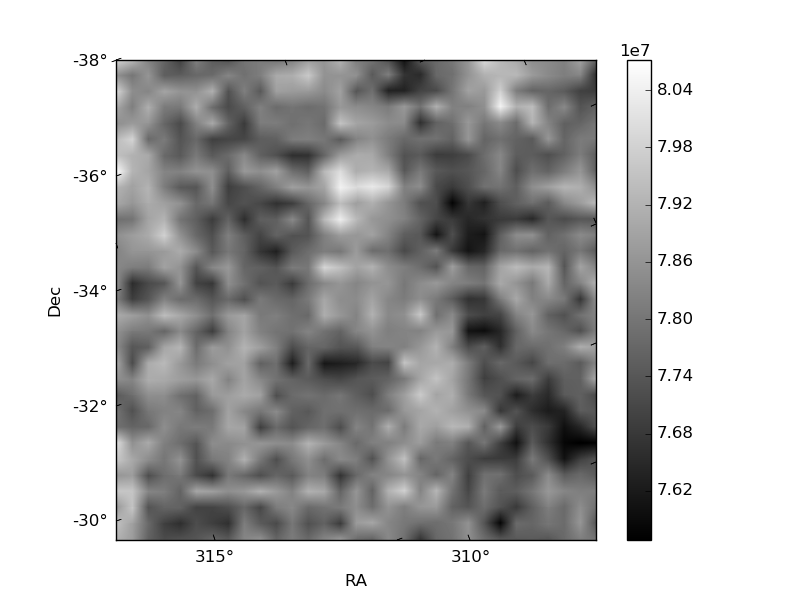
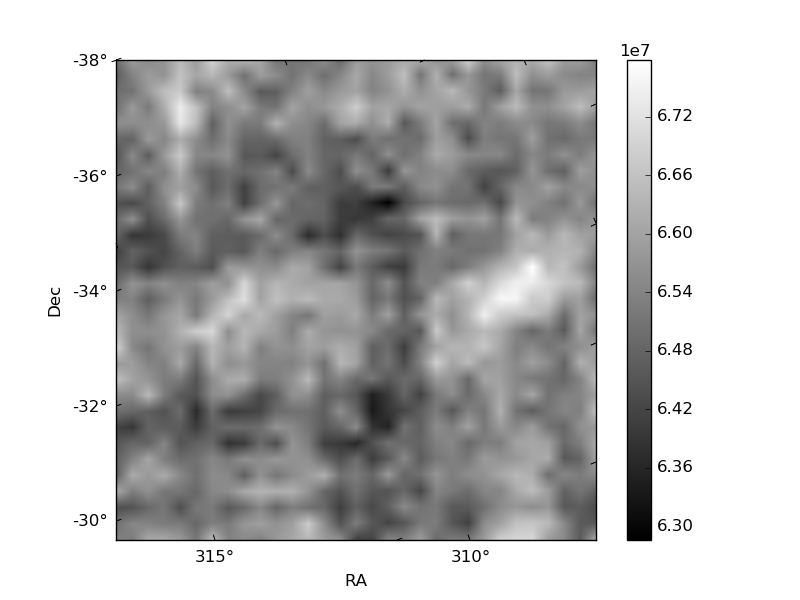
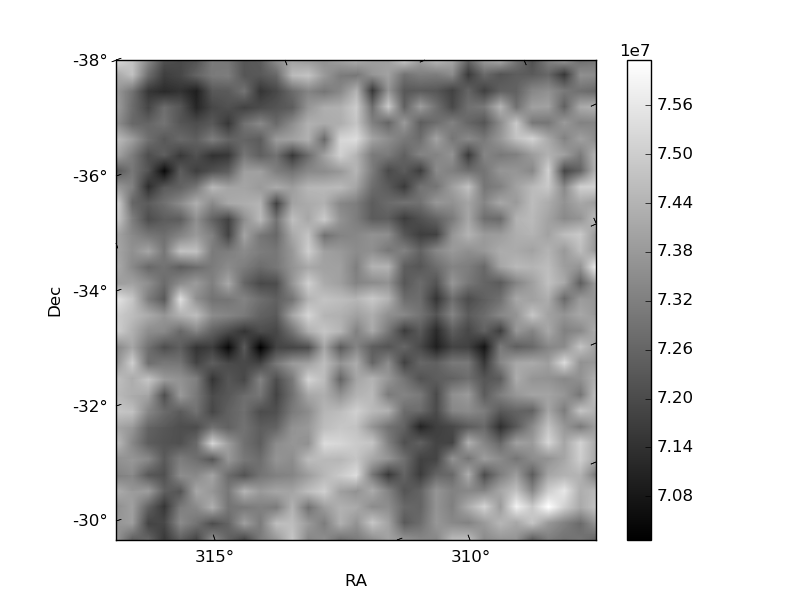
Histogram calculated using DETX and DETY for each event in the final _common_clean file
| Quadrant A | 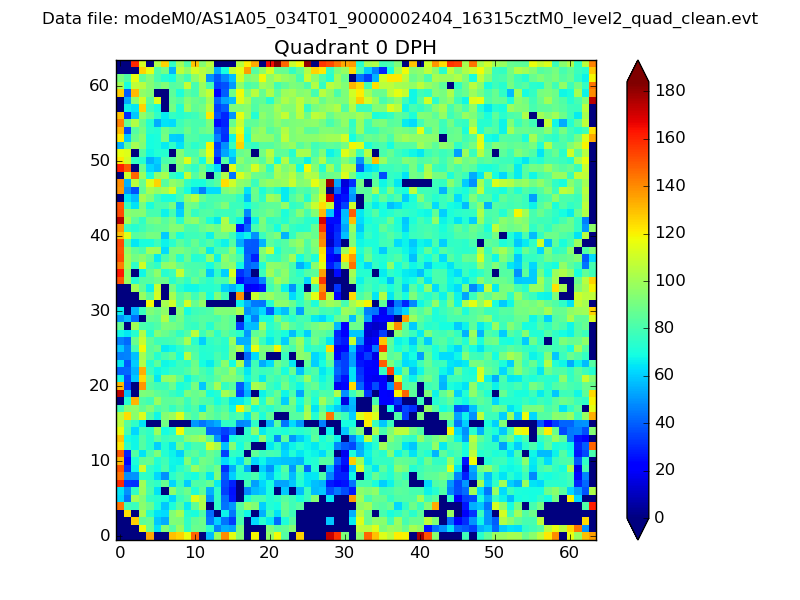 |
 |
Quadrant B |
|---|---|---|---|
| Quadrant D |  |
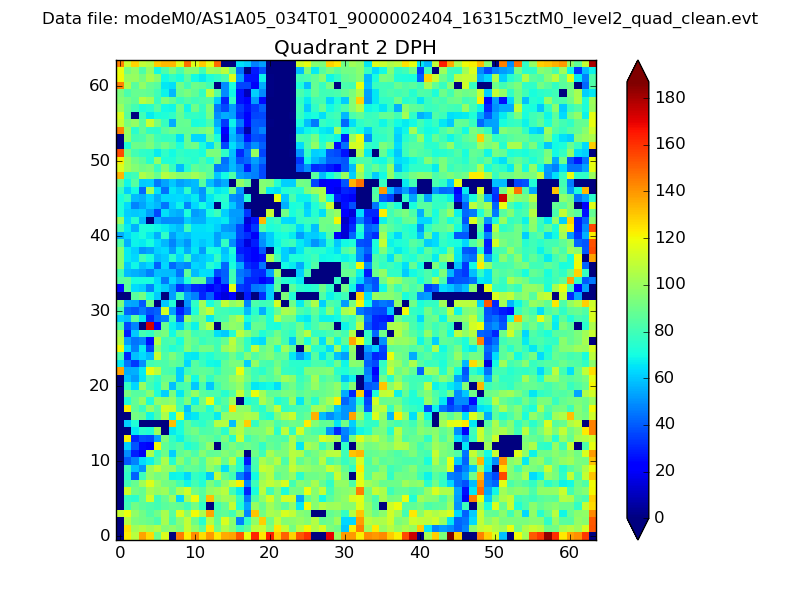 |
Quadrant C |
| Plot type | Count rate plots | Images |
|---|---|---|
| Comparison with Poisson distribution Blue bars denote a histogram of data divided into 1 sec bins. Red curve is a Poisson curve with rate = median count rate of data. |
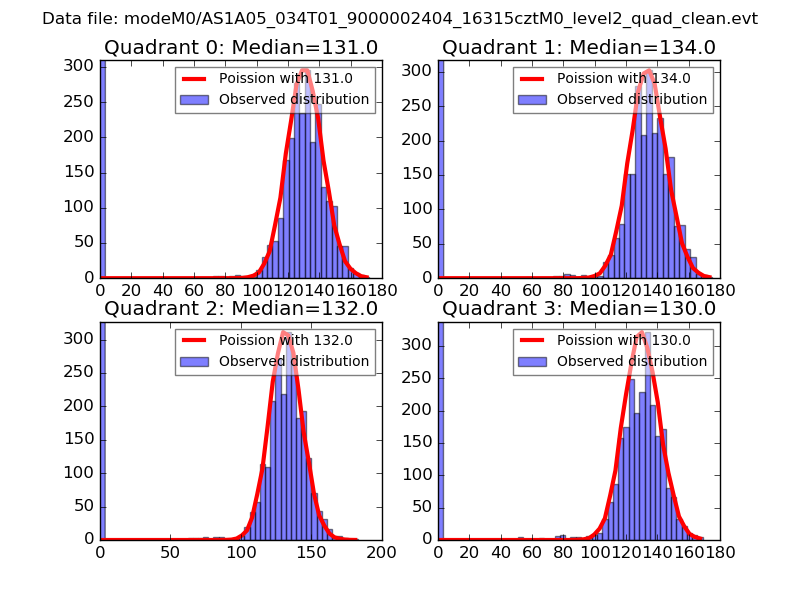 |
 |
| Quadrant-wise count rates Data is divided into 100 sec bins |
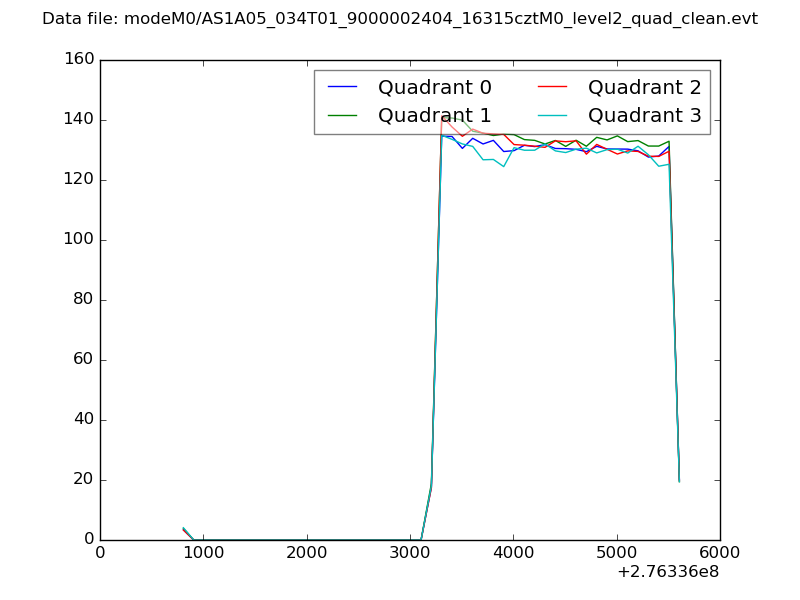 |
|
| Module-wise count rates for Quadrant A Data is divided into 100 sec bins |
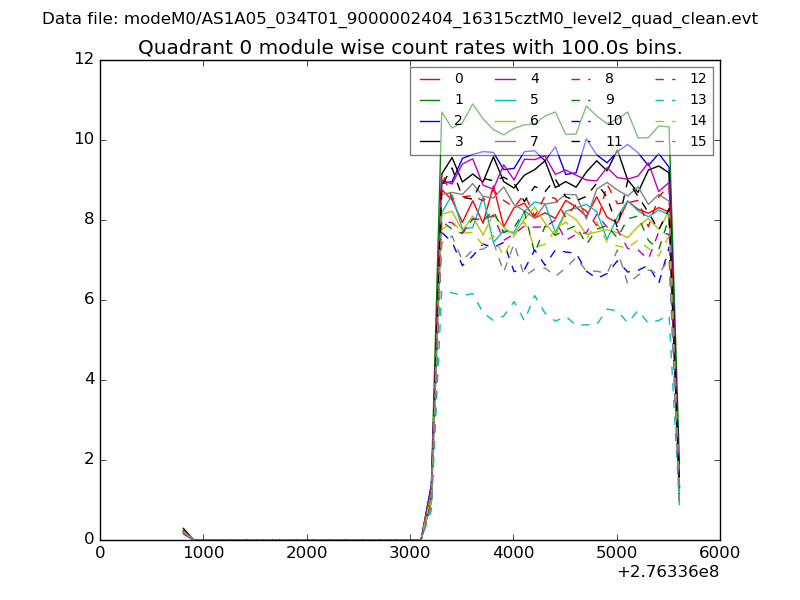 |
 |
| Module-wise count rates for Quadrant B Data is divided into 100 sec bins |
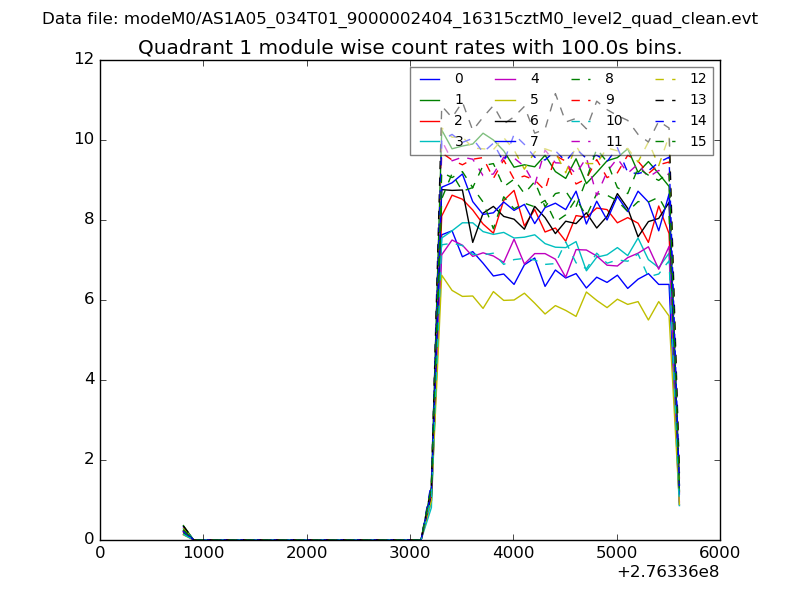 |
 |
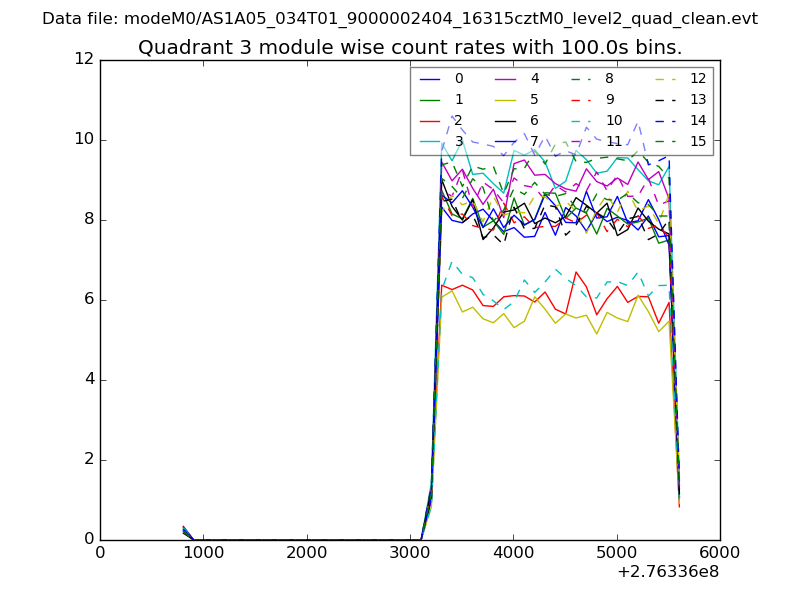
| Module-wise count rates for Quadrant C Data is divided into 100 sec bins |
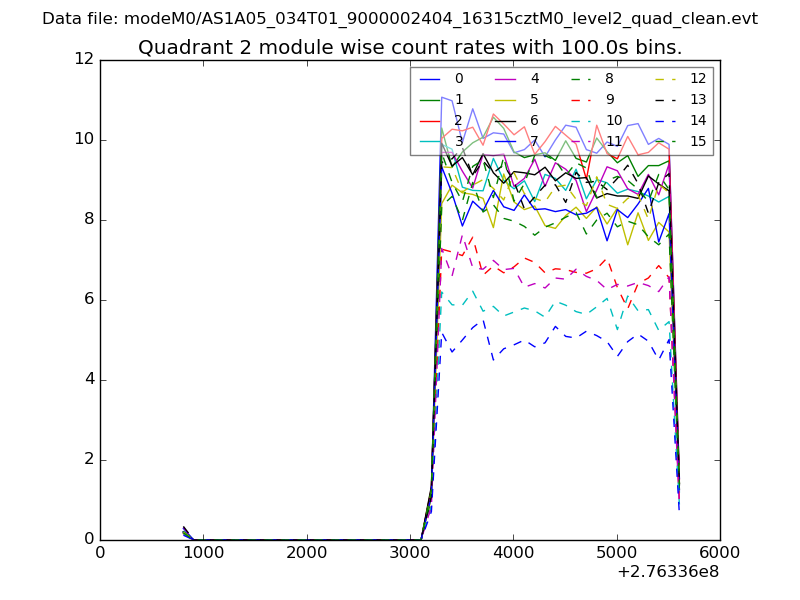 |
 |
| Module-wise count rates for Quadrant D Data is divided into 100 sec bins |
 |
 |
| Parameter | Plot |
|---|---|
| CZT HV Monitor | 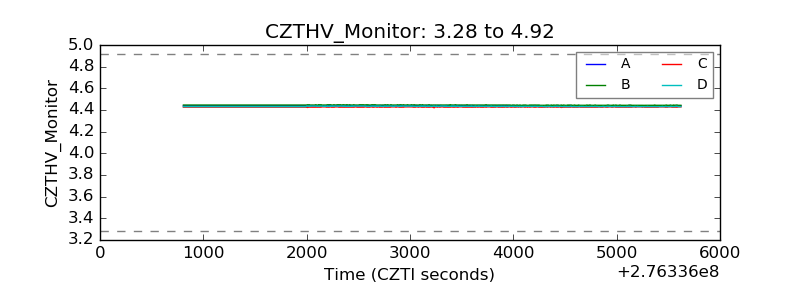 |
| D_VDD | 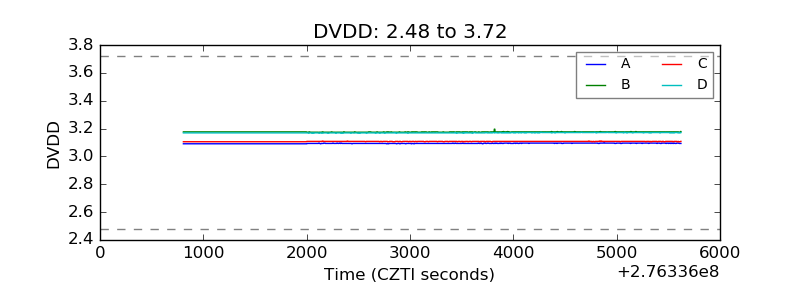 |
| Temperature 1 | 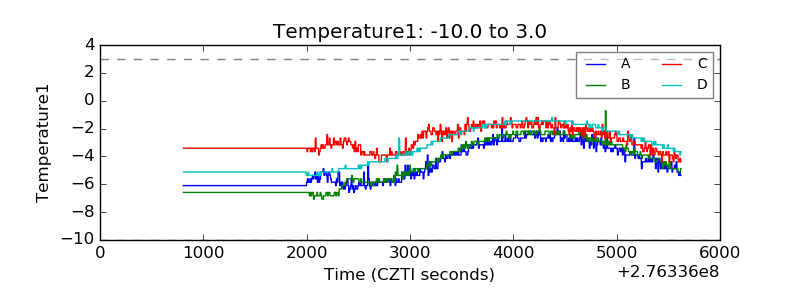 |
| Veto HV Monitor | 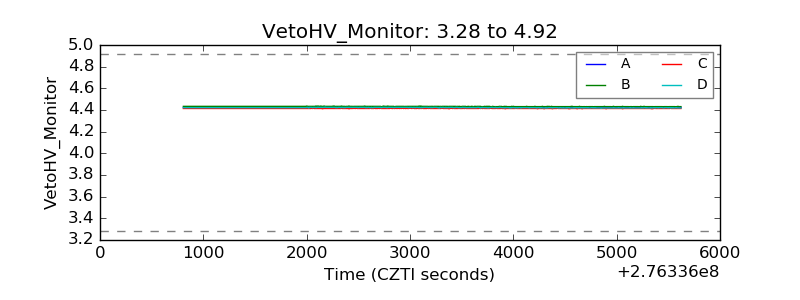 |
| Veto LLD | 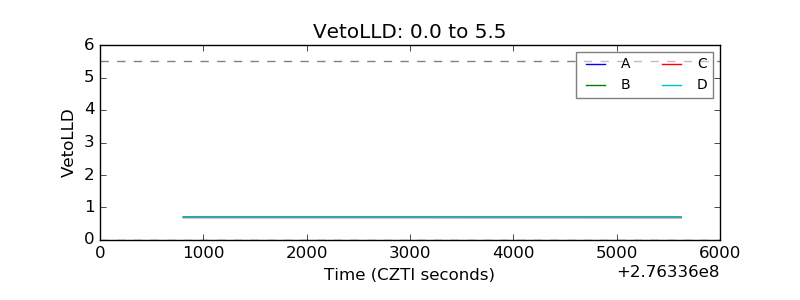 |
| Alpha Counter | 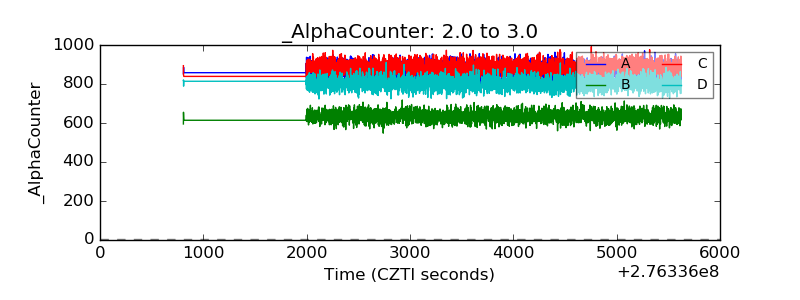 |
| _CPM_Rate | 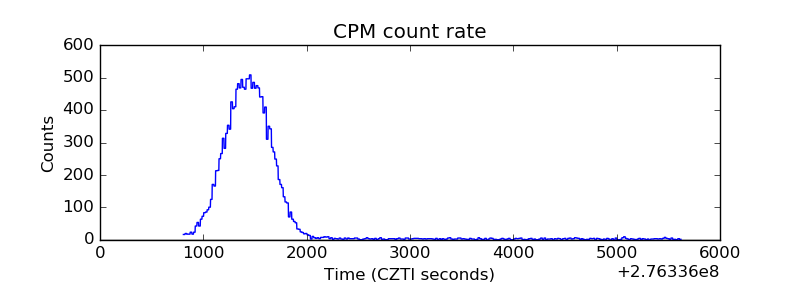 |
| CZT Counter | 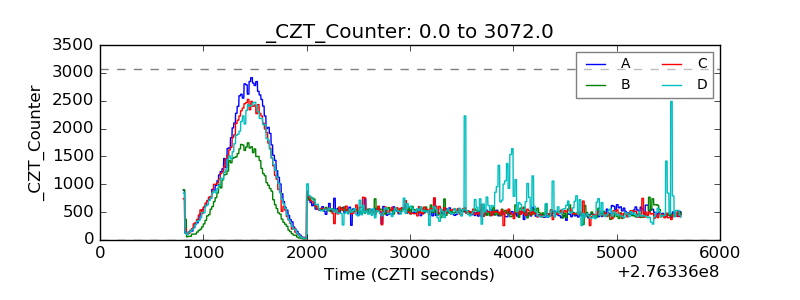 |
| +2.5 Volts monitor |  |
| +5 Volts monitor |  |
| _ROLL_ROT | 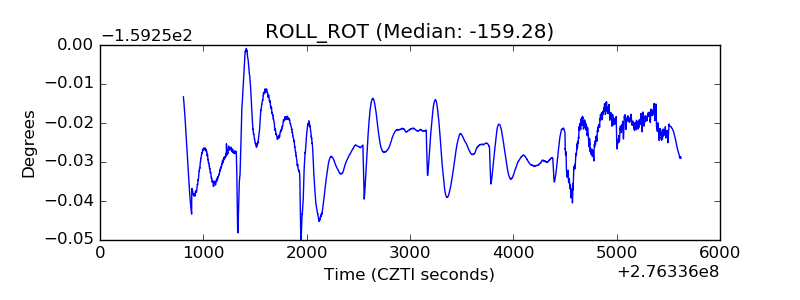 |
| _Roll_DEC | 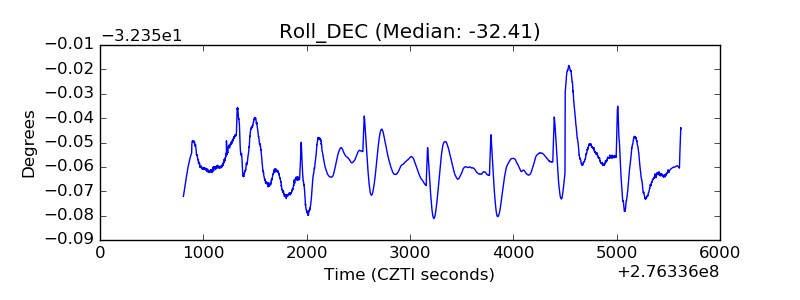 |
| _Roll_RA | 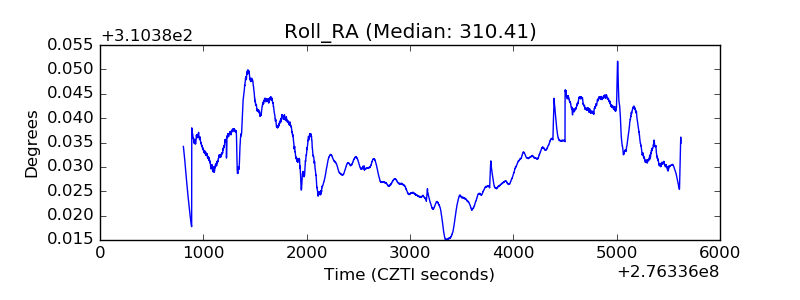 |
| Veto Counter | 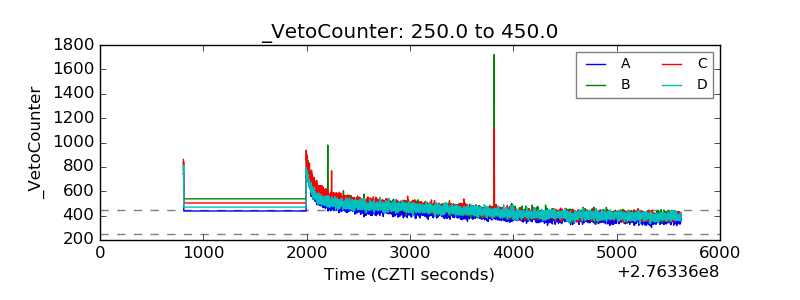 |