| Param | Original file | Final file |
|---|---|---|
| Filename | modeM0/AS1A05_096T04_9000002406cztM0_level2.fits | modeM0/AS1A05_096T04_9000002406cztM0_level2_quad_clean.evt |
| Size (bytes) | 725,025,600 | 730,094,400 |
| Size | 691.4 MB | 696.3 MB |
| Events in quadrant A | 4,417,780 | 4,396,295 |
| Events in quadrant B | 4,113,244 | 4,274,814 |
| Events in quadrant C | 4,427,524 | 4,324,570 |
| Events in quadrant D | 3,857,290 | 3,976,619 |
| Mode M0 | |||
|---|---|---|---|
| Quadrant | BADHDUFLAG | Total packets | Discarded packets |
| A | 0 | 161872 | 0 |
| B | 0 | 195692 | 0 |
| C | 0 | 156245 | 0 |
| D | 0 | 166628 | 0 |
| Mode SS | |||
|---|---|---|---|
| Quadrant | BADHDUFLAG | Total packets | Discarded packets |
| A | 0 | 1524 | 0 |
| B | 0 | 1524 | 0 |
| C | 0 | 1524 | 0 |
| D | 0 | 1524 | 0 |
| Mode M9 | |||
|---|---|---|---|
| Quadrant | BADHDUFLAG | Total packets | Discarded packets |
| A | 0 | 121 | 0 |
| B | 0 | 121 | 0 |
| C | 0 | 121 | 0 |
| D | 0 | 121 | 0 |
| Quadrant | Total seconds | Saturated seconds | Saturation percentage |
|---|---|---|---|
| A | 74952 | 1658 | 2.212082% |
| B | 74952 | 5106 | 6.812360% |
| C | 74952 | 1271 | 1.695752% |
| D | 74952 | 1473 | 1.965258% |
Noise dominated data is calculated using 1-second bins in cleaned event files. If a bin has >2000 counts, and if more than 50% of those come from <1% of pixels, then it is considered to be noise-dominated and hence unusable.
| Quadrant | # 1 sec bins | Bins with >0 counts | Bins with >2000 counts | High rate bins dominated by noise | Noise dominated (total time) | Noise dominated (detector-on time) | Marked lightcurve |
|---|---|---|---|---|---|---|---|
| A | 87002 | 74947 | 0 | 0 | 0.00% | 0.00% |  |
| B | 87002 | 74624 | 0 | 0 | 0.00% | 0.00% | 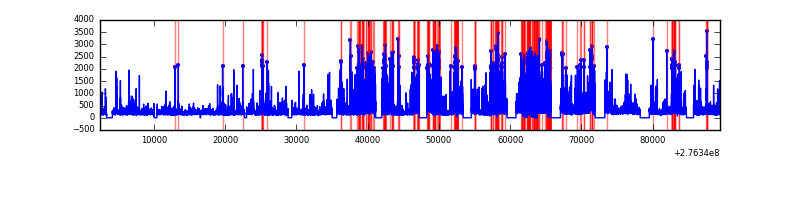 |
| C | 87002 | 74950 | 0 | 0 | 0.00% | 0.00% |  |
| D | 87002 | 74952 | 0 | 0 | 0.00% | 0.00% |  |
Top three noisy pixels from each quadrant. If the there are fewer than three noisy pixels in the level2.evt file, extra rows are filled as -1
| Pixel properties | Quadrant properties | ||||||
|---|---|---|---|---|---|---|---|
| Quadrant | DetID | PixID | Counts | Sigma | Mean | Median | Sigma |
| A | 0 | 29 | 4285 | 11.44 | 1148 | 1079 | 280.3 |
| A | 7 | 110 | 3448 | 8.45 | 1148 | 1079 | 280.3 |
| A | 0 | 30 | 3300 | 7.92 | 1148 | 1079 | 280.3 |
| B | 2 | 9 | 3366 | 11.07 | 1088 | 1041 | 209.9 |
| B | 2 | 8 | 2975 | 9.21 | 1088 | 1041 | 209.9 |
| B | 3 | 17 | 2801 | 8.38 | 1088 | 1041 | 209.9 |
| C | 3 | 126 | 3105 | 6.73 | 1169 | 1095 | 298.8 |
| C | 2 | 191 | 3060 | 6.58 | 1169 | 1095 | 298.8 |
| C | 12 | 250 | 3029 | 6.47 | 1169 | 1095 | 298.8 |
| D | 6 | 231 | 2894 | 6.45 | 1102 | 1003 | 293.3 |
| D | 10 | 189 | 2801 | 6.13 | 1102 | 1003 | 293.3 |
| D | 3 | 14 | 2772 | 6.03 | 1102 | 1003 | 293.3 |
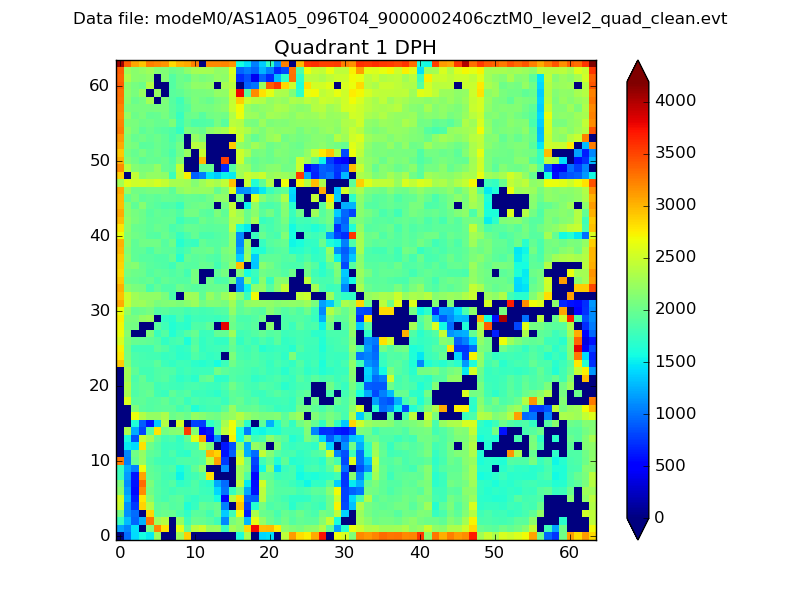
Histogram calculated using DETX and DETY for each event in the final _common_clean file
| Quadrant A |  |
 |
Quadrant B |
|---|---|---|---|
| Quadrant D |  |
 |
Quadrant C |
| Plot type | Count rate plots | Images |
|---|---|---|
| Comparison with Poisson distribution Blue bars denote a histogram of data divided into 1 sec bins. Red curve is a Poisson curve with rate = median count rate of data. |
 |
 |
| Quadrant-wise count rates Data is divided into 100 sec bins |
 |
|
| Module-wise count rates for Quadrant A Data is divided into 100 sec bins |
 |
 |
| Module-wise count rates for Quadrant B Data is divided into 100 sec bins |
 |
 |
| Module-wise count rates for Quadrant C Data is divided into 100 sec bins |
 |
 |
| Module-wise count rates for Quadrant D Data is divided into 100 sec bins |
 |
 |
| Parameter | Plot |
|---|---|
| CZT HV Monitor |  |
| D_VDD |  |
| Temperature 1 |  |
| Veto HV Monitor |  |
| Veto LLD |  |
| Alpha Counter |  |
| _CPM_Rate |  |
| CZT Counter |  |
| +2.5 Volts monitor |  |
| +5 Volts monitor |  |
| _ROLL_ROT |  |
| _Roll_DEC |  |
| _Roll_RA |  |
| Veto Counter |  |