| Param | Original file | Final file |
|---|---|---|
| Filename | modeM0/AS1A05_096T04_9000002406_16316cztM0_level2.evt | modeM0/AS1A05_096T04_9000002406_16316cztM0_level2_quad_clean.evt |
| Size (bytes) | 532,293,120 | 99,717,120 |
| Size | 507.6 MB | 95.1 MB |
| Events in quadrant A | 4,480,252 | 616,053 |
| Events in quadrant B | 3,903,317 | 641,059 |
| Events in quadrant C | 3,650,745 | 626,096 |
| Events in quadrant D | 3,583,689 | 621,300 |
| Mode M0 | |||
|---|---|---|---|
| Quadrant | BADHDUFLAG | Total packets | Discarded packets |
| A | 0 | 18213 | 2 |
| B | 0 | 16204 | 1 |
| C | 0 | 15375 | 1 |
| D | 0 | 15685 | 1 |
| Mode SS | |||
|---|---|---|---|
| Quadrant | BADHDUFLAG | Total packets | Discarded packets |
| A | 0 | 148 | 0 |
| B | 0 | 148 | 0 |
| C | 0 | 148 | 0 |
| D | 0 | 148 | 0 |
| Mode M9 | |||
|---|---|---|---|
| Quadrant | BADHDUFLAG | Total packets | Discarded packets |
| A | 0 | 4 | 0 |
| B | 0 | 4 | 0 |
| C | 0 | 4 | 0 |
| D | 0 | 4 | 0 |
| Quadrant | Total seconds | Saturated seconds | Saturation percentage |
|---|---|---|---|
| A | 7405 | 434 | 5.860905% |
| B | 7405 | 191 | 2.579338% |
| C | 7405 | 173 | 2.336259% |
| D | 7405 | 146 | 1.971641% |
Noise dominated data is calculated using 1-second bins in cleaned event files. If a bin has >2000 counts, and if more than 50% of those come from <1% of pixels, then it is considered to be noise-dominated and hence unusable.
| Quadrant | # 1 sec bins | Bins with >0 counts | Bins with >2000 counts | High rate bins dominated by noise | Noise dominated (total time) | Noise dominated (detector-on time) | Marked lightcurve |
|---|---|---|---|---|---|---|---|
| A | 7786 | 7406 | 202 | 202 | 2.59% | 2.73% |  |
| B | 7786 | 7407 | 13 | 13 | 0.17% | 0.18% |  |
| C | 7786 | 7406 | 0 | 0 | 0.00% | 0.00% | 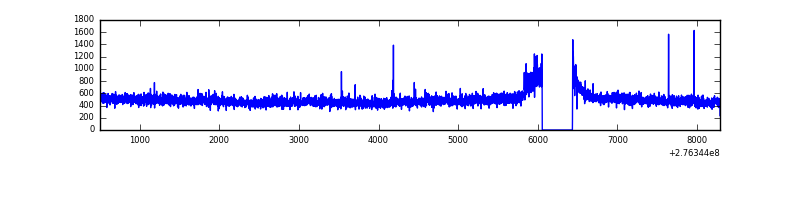 |
| D | 7786 | 7407 | 20 | 20 | 0.26% | 0.27% | 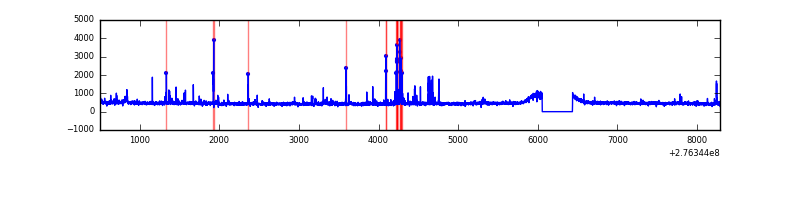 |
Top three noisy pixels from each quadrant. If the there are fewer than three noisy pixels in the level2.evt file, extra rows are filled as -1
| Pixel properties | Quadrant properties | ||||||
|---|---|---|---|---|---|---|---|
| Quadrant | DetID | PixID | Counts | Sigma | Mean | Median | Sigma |
| A | 15 | 174 | 1112034 | 6307.54 | 872 | 852 | 176.2 |
| A | 3 | 1 | 11285 | 59.22 | 872 | 852 | 176.2 |
| A | 0 | 226 | 7706 | 38.91 | 872 | 852 | 176.2 |
| B | 10 | 16 | 111462 | 650.16 | 886 | 861 | 170.1 |
| B | 0 | 198 | 61589 | 356.98 | 886 | 861 | 170.1 |
| B | 0 | 228 | 51967 | 300.42 | 886 | 861 | 170.1 |
| C | 14 | 238 | 132781 | 662.46 | 861 | 864 | 199.1 |
| C | 3 | 233 | 122307 | 609.87 | 861 | 864 | 199.1 |
| C | 0 | 207 | 26804 | 130.27 | 861 | 864 | 199.1 |
| D | 10 | 70 | 100426 | 460.98 | 873 | 850 | 216.0 |
| D | 12 | 110 | 67603 | 309.03 | 873 | 850 | 216.0 |
| D | 1 | 52 | 44379 | 201.51 | 873 | 850 | 216.0 |
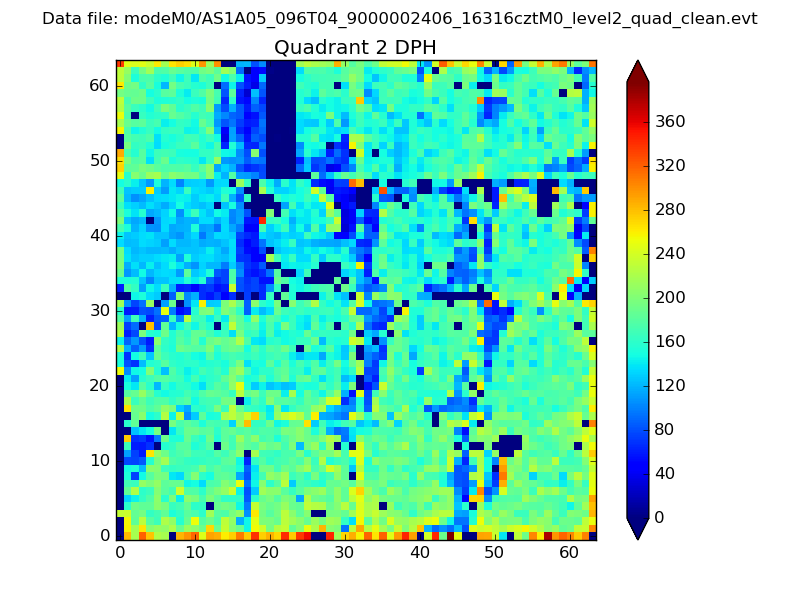
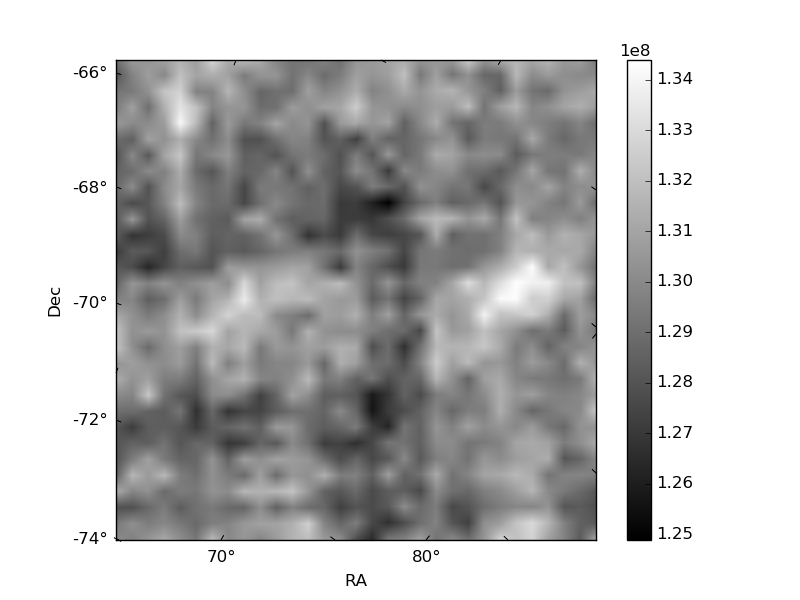
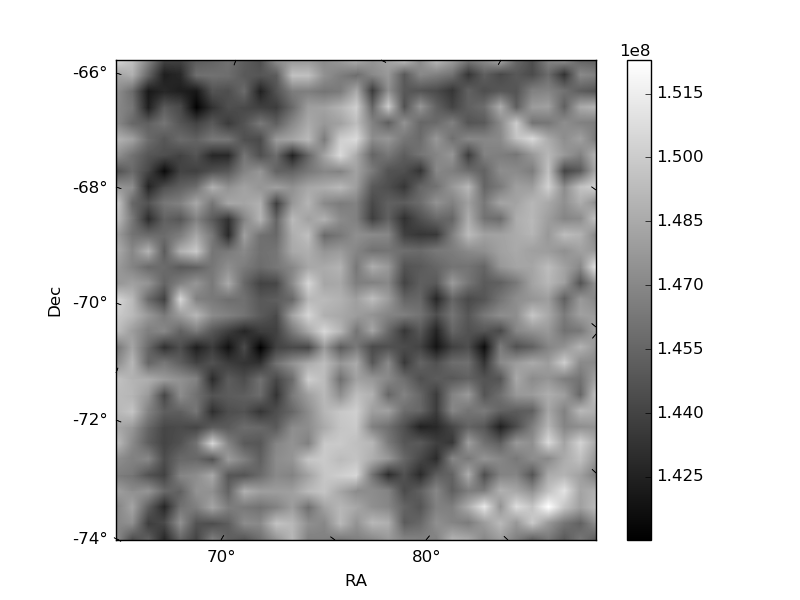
Histogram calculated using DETX and DETY for each event in the final _common_clean file
| Quadrant A | 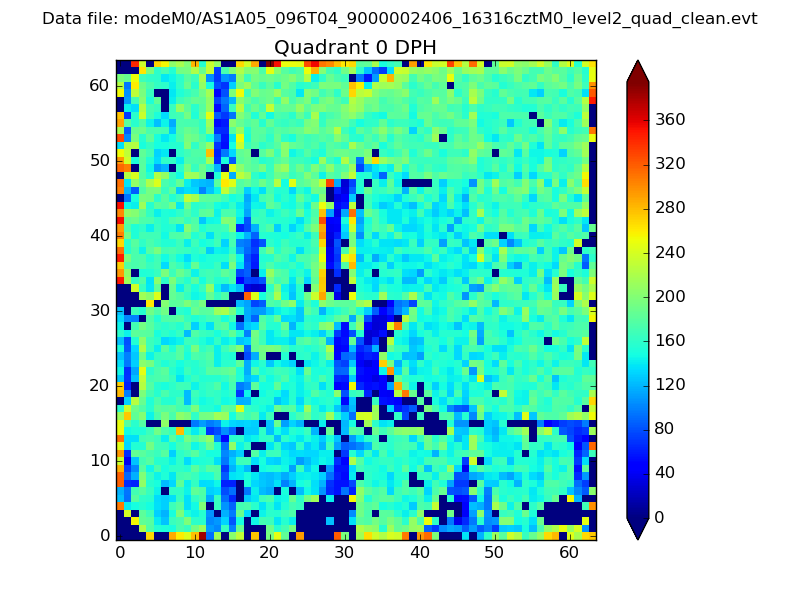 |
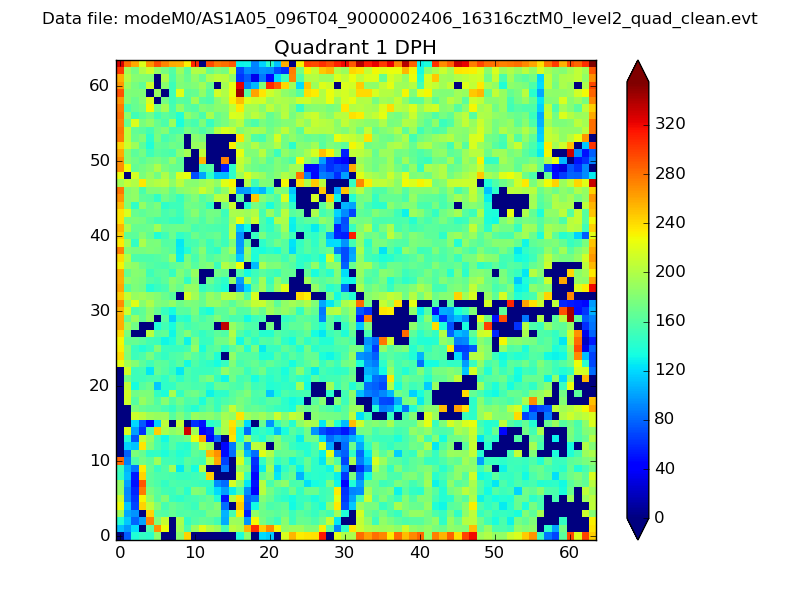 |
Quadrant B |
|---|---|---|---|
| Quadrant D | 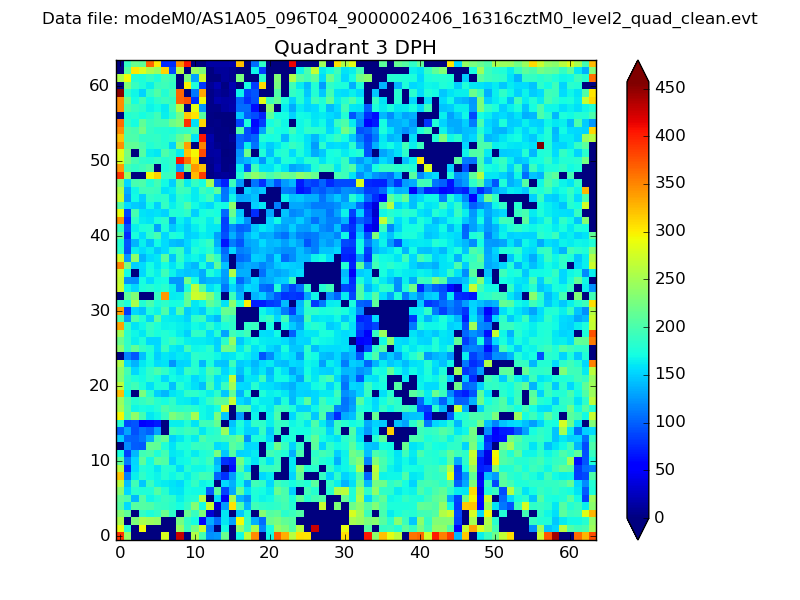 |
 |
Quadrant C |
| Plot type | Count rate plots | Images |
|---|---|---|
| Comparison with Poisson distribution Blue bars denote a histogram of data divided into 1 sec bins. Red curve is a Poisson curve with rate = median count rate of data. |
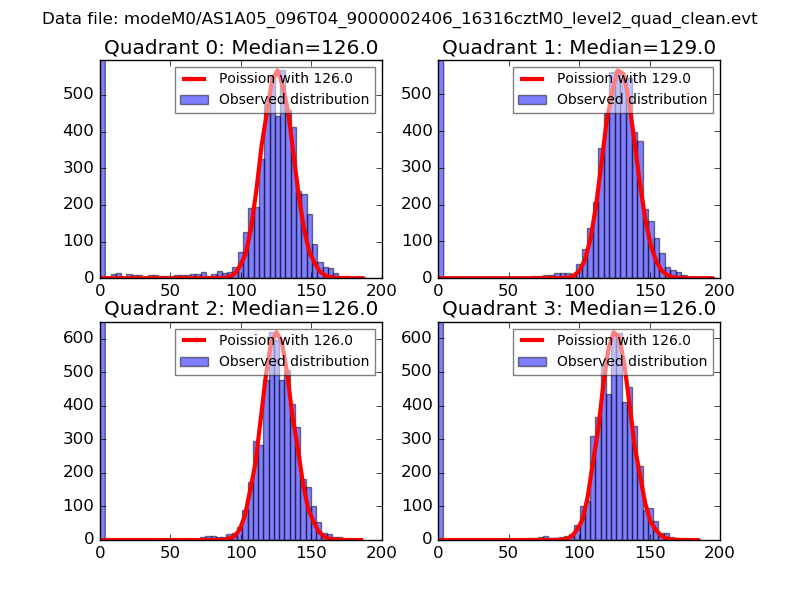 |
 |
| Quadrant-wise count rates Data is divided into 100 sec bins |
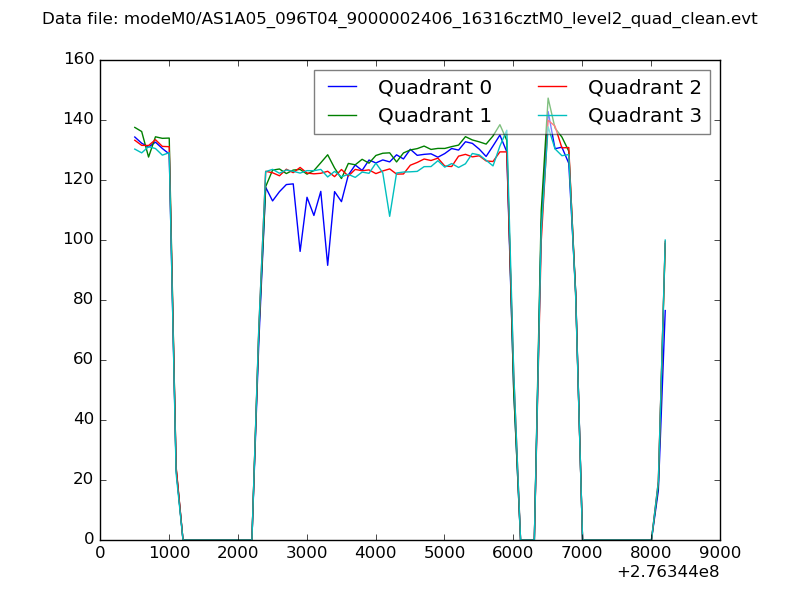 |
|
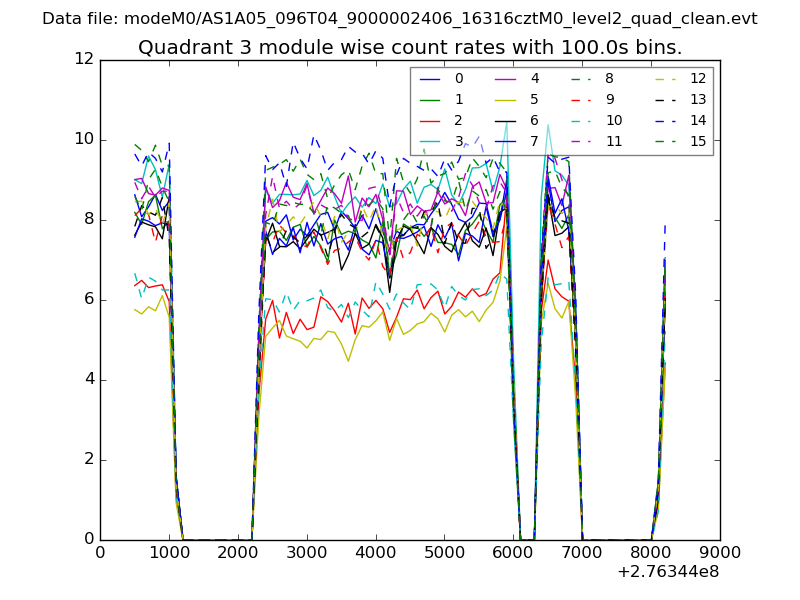
| Module-wise count rates for Quadrant A Data is divided into 100 sec bins |
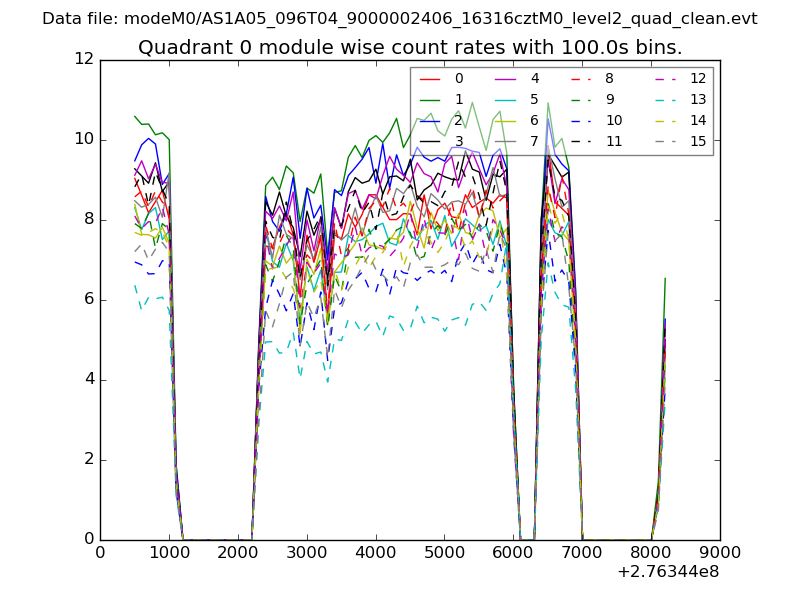 |
 |
| Module-wise count rates for Quadrant B Data is divided into 100 sec bins |
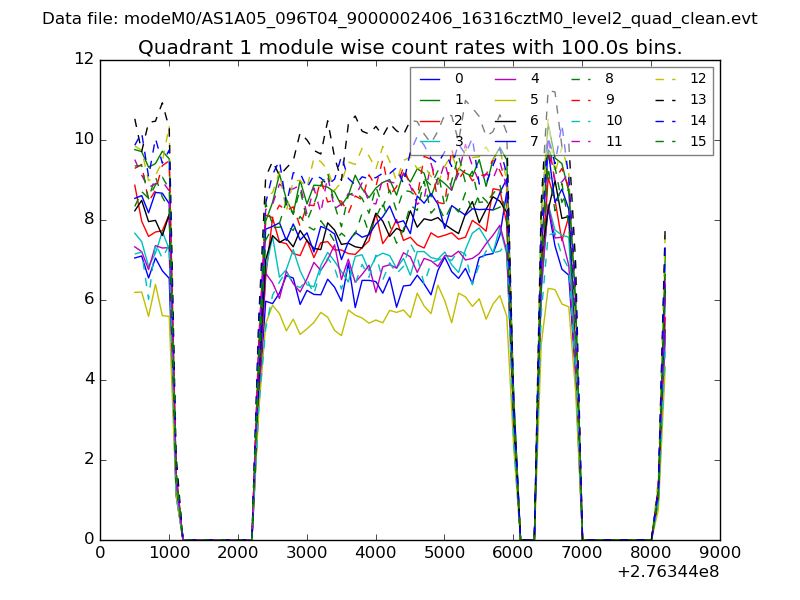 |
 |
| Module-wise count rates for Quadrant C Data is divided into 100 sec bins |
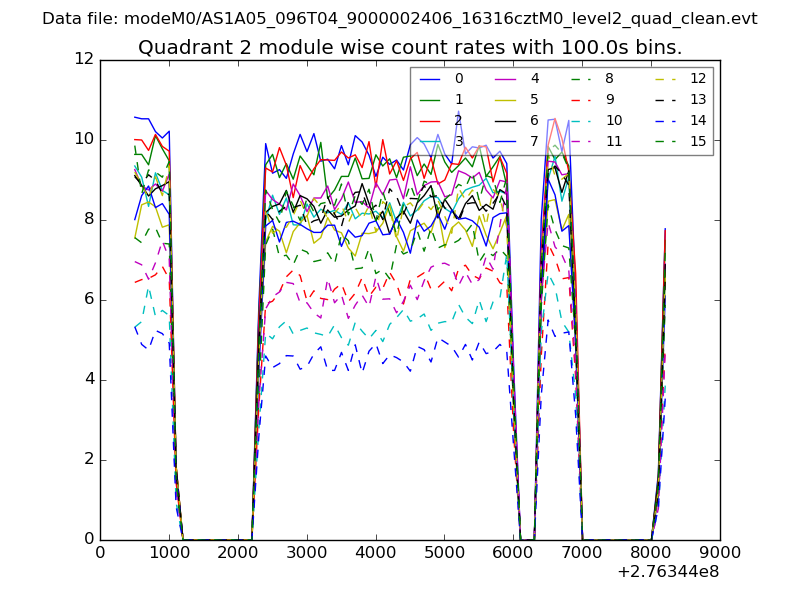 |
 |
| Module-wise count rates for Quadrant D Data is divided into 100 sec bins |
 |
 |
| Parameter | Plot |
|---|---|
| CZT HV Monitor | 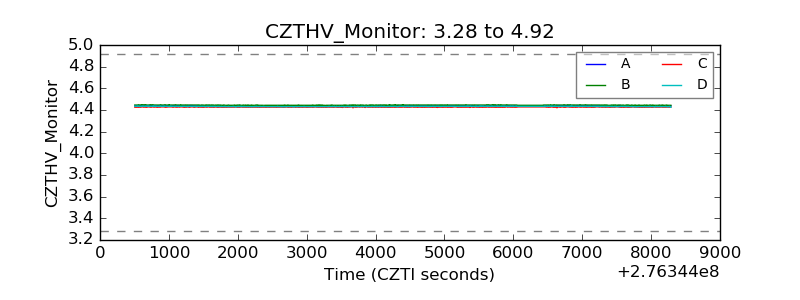 |
| D_VDD | 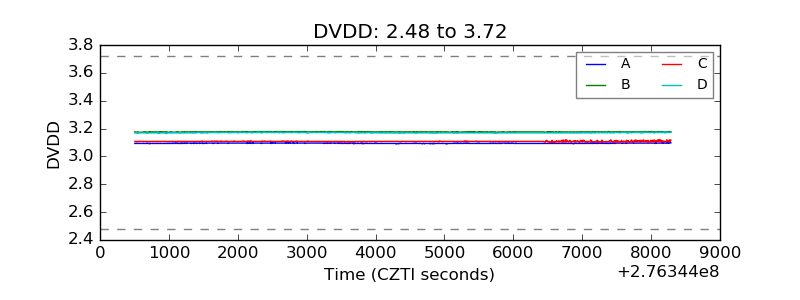 |
| Temperature 1 | 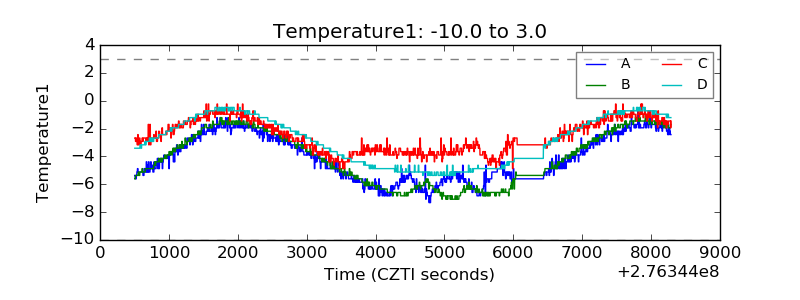 |
| Veto HV Monitor | 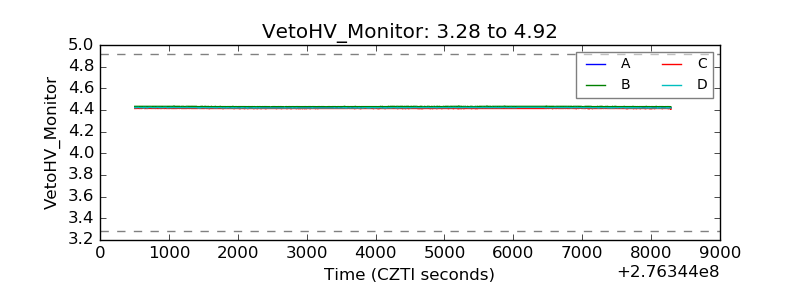 |
| Veto LLD |  |
| Alpha Counter | 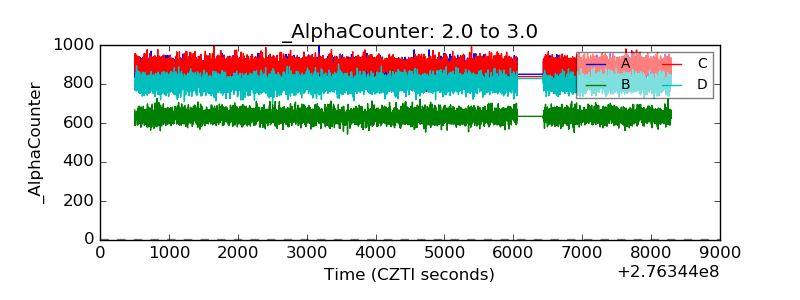 |
| _CPM_Rate | 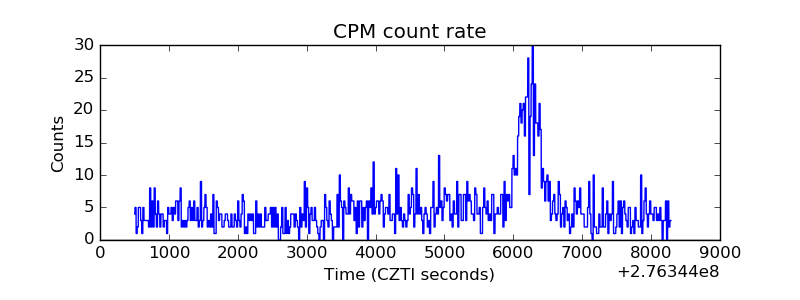 |
| CZT Counter | 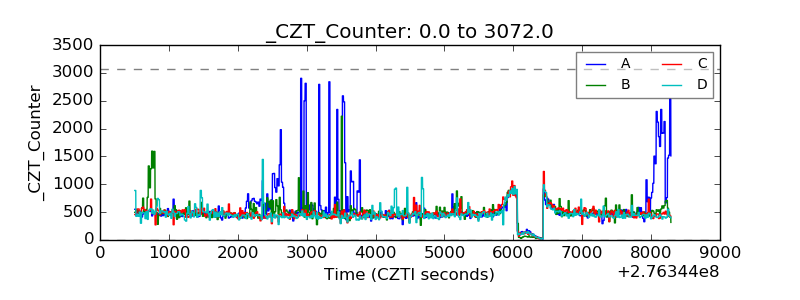 |
| +2.5 Volts monitor |  |
| +5 Volts monitor |  |
| _ROLL_ROT | 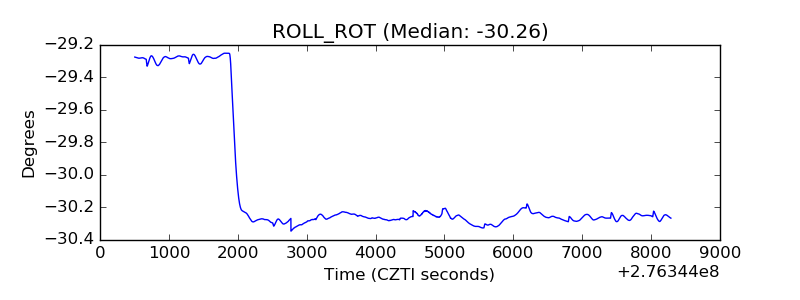 |
| _Roll_DEC | 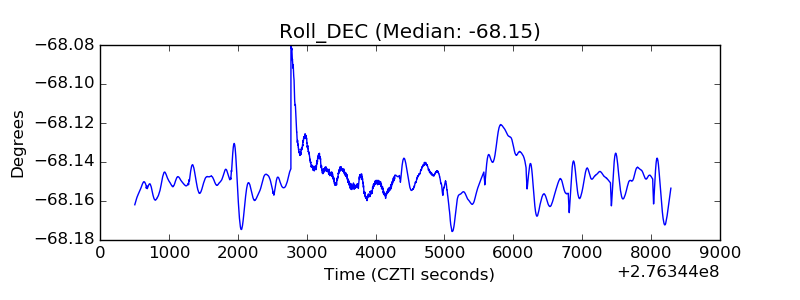 |
| _Roll_RA | 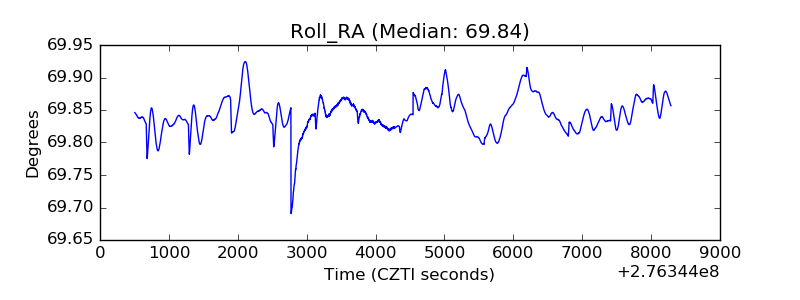 |
| Veto Counter | 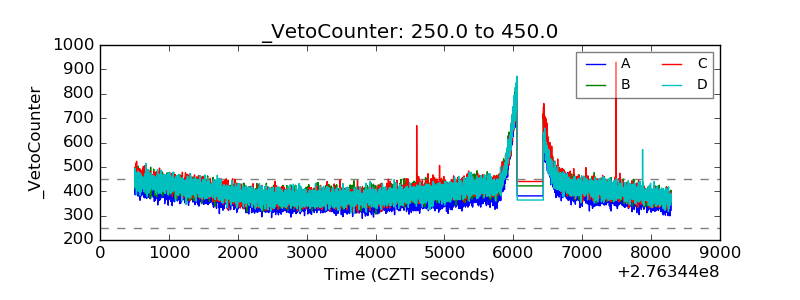 |