| Param | Original file | Final file |
|---|---|---|
| Filename | modeM0/AS1A05_096T04_9000002406_16317cztM0_level2.evt | modeM0/AS1A05_096T04_9000002406_16317cztM0_level2_quad_clean.evt |
| Size (bytes) | 520,041,600 | 97,107,840 |
| Size | 496.0 MB | 92.6 MB |
| Events in quadrant A | 4,565,966 | 596,882 |
| Events in quadrant B | 3,654,688 | 621,040 |
| Events in quadrant C | 3,551,182 | 606,469 |
| Events in quadrant D | 3,480,237 | 606,308 |
| Mode M0 | |||
|---|---|---|---|
| Quadrant | BADHDUFLAG | Total packets | Discarded packets |
| A | 0 | 18518 | 2 |
| B | 0 | 15503 | 1 |
| C | 0 | 15228 | 1 |
| D | 0 | 15425 | 1 |
| Mode SS | |||
|---|---|---|---|
| Quadrant | BADHDUFLAG | Total packets | Discarded packets |
| A | 0 | 148 | 0 |
| B | 0 | 148 | 0 |
| C | 0 | 148 | 0 |
| D | 0 | 148 | 0 |
| Quadrant | Total seconds | Saturated seconds | Saturation percentage |
|---|---|---|---|
| A | 7314 | 627 | 8.572600% |
| B | 7314 | 217 | 2.966913% |
| C | 7314 | 211 | 2.884878% |
| D | 7314 | 137 | 1.873120% |
Noise dominated data is calculated using 1-second bins in cleaned event files. If a bin has >2000 counts, and if more than 50% of those come from <1% of pixels, then it is considered to be noise-dominated and hence unusable.
| Quadrant | # 1 sec bins | Bins with >0 counts | Bins with >2000 counts | High rate bins dominated by noise | Noise dominated (total time) | Noise dominated (detector-on time) | Marked lightcurve |
|---|---|---|---|---|---|---|---|
| A | 7405 | 7316 | 300 | 300 | 4.05% | 4.10% | 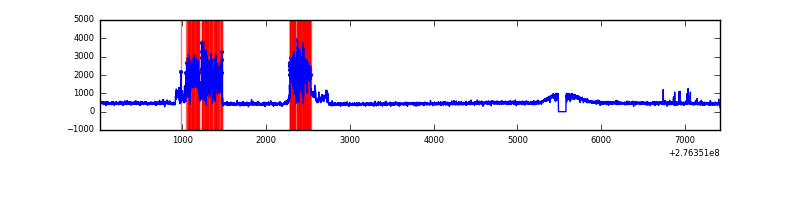 |
| B | 7405 | 7316 | 3 | 3 | 0.04% | 0.04% | 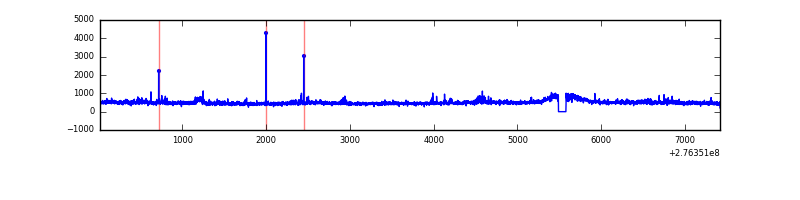 |
| C | 7405 | 7316 | 0 | 0 | 0.00% | 0.00% | 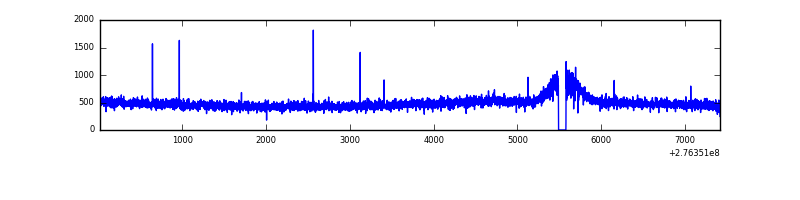 |
| D | 7405 | 7316 | 11 | 11 | 0.15% | 0.15% | 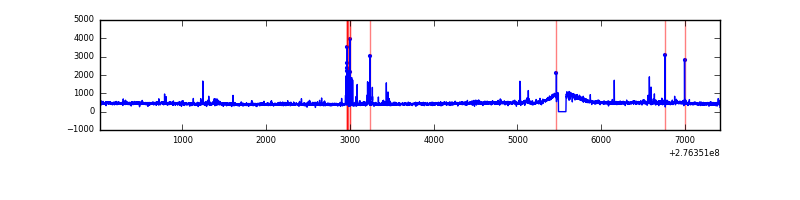 |
Top three noisy pixels from each quadrant. If the there are fewer than three noisy pixels in the level2.evt file, extra rows are filled as -1
| Pixel properties | Quadrant properties | ||||||
|---|---|---|---|---|---|---|---|
| Quadrant | DetID | PixID | Counts | Sigma | Mean | Median | Sigma |
| A | 15 | 174 | 1248090 | 7160.93 | 861 | 841 | 174.2 |
| A | 0 | 226 | 7724 | 39.52 | 861 | 841 | 174.2 |
| A | 12 | 194 | 6570 | 32.89 | 861 | 841 | 174.2 |
| B | 0 | 198 | 64353 | 379.38 | 876 | 853 | 167.4 |
| B | 15 | 35 | 31308 | 181.96 | 876 | 853 | 167.4 |
| B | 0 | 189 | 29500 | 171.15 | 876 | 853 | 167.4 |
| C | 14 | 238 | 130295 | 658.82 | 849 | 854 | 196.5 |
| C | 3 | 233 | 72811 | 366.24 | 849 | 854 | 196.5 |
| C | 0 | 207 | 20246 | 98.7 | 849 | 854 | 196.5 |
| D | 10 | 70 | 100879 | 479.28 | 867 | 840 | 208.7 |
| D | 1 | 52 | 34978 | 163.55 | 867 | 840 | 208.7 |
| D | 2 | 234 | 32318 | 150.81 | 867 | 840 | 208.7 |
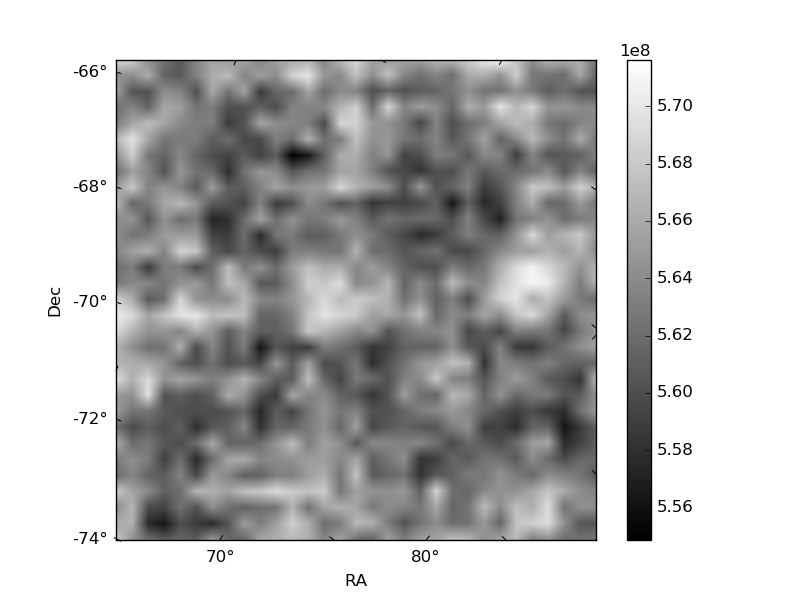
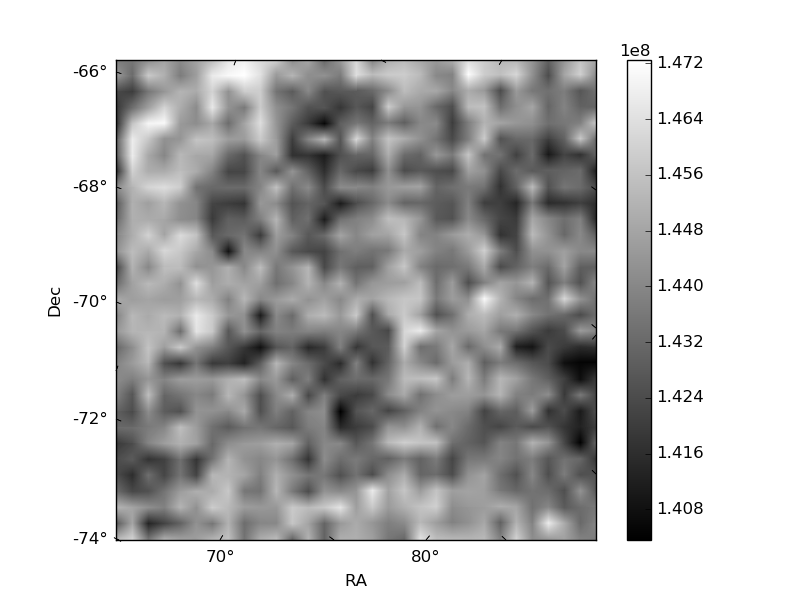
Histogram calculated using DETX and DETY for each event in the final _common_clean file
| Quadrant A | 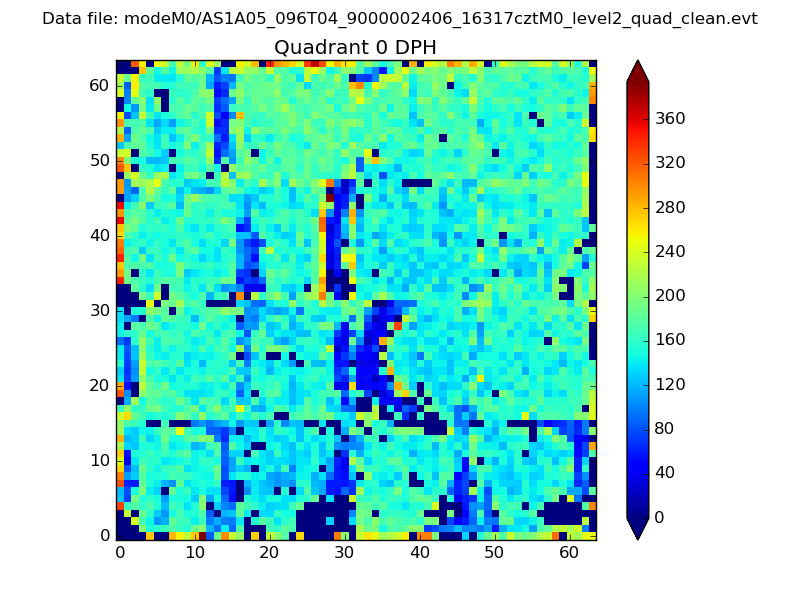 |
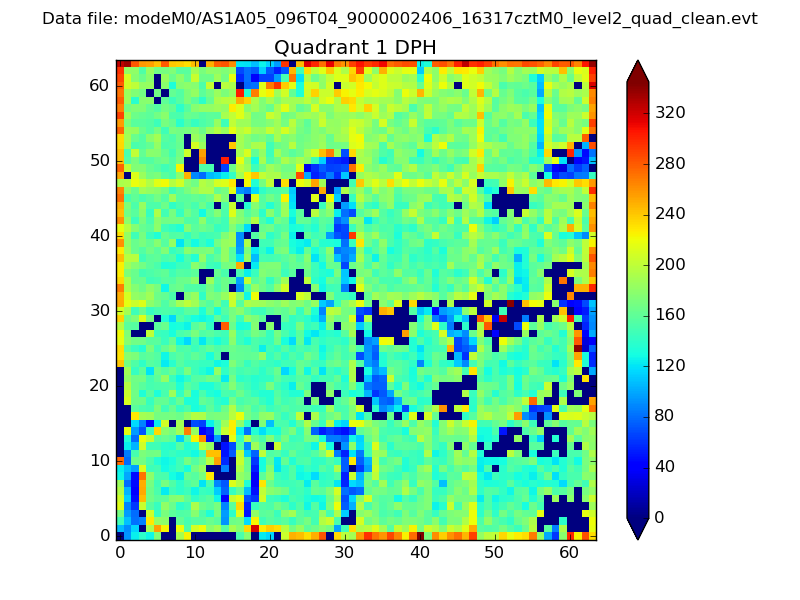 |
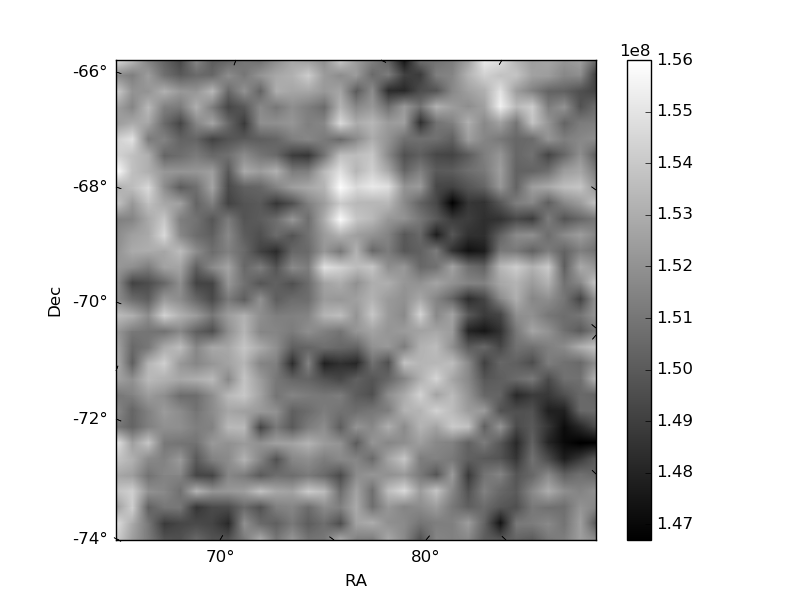
Quadrant B |
|---|---|---|---|
| Quadrant D | 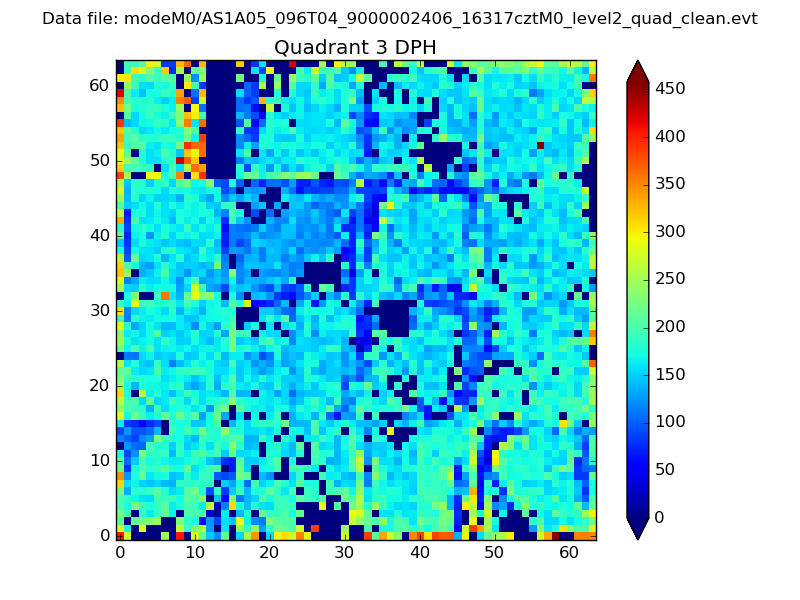 |
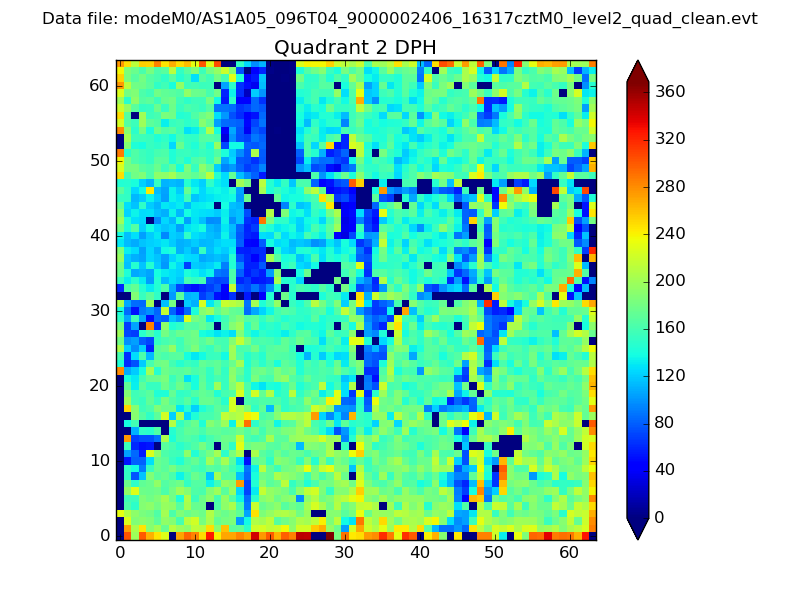 |
Quadrant C |
| Plot type | Count rate plots | Images |
|---|---|---|
| Comparison with Poisson distribution Blue bars denote a histogram of data divided into 1 sec bins. Red curve is a Poisson curve with rate = median count rate of data. |
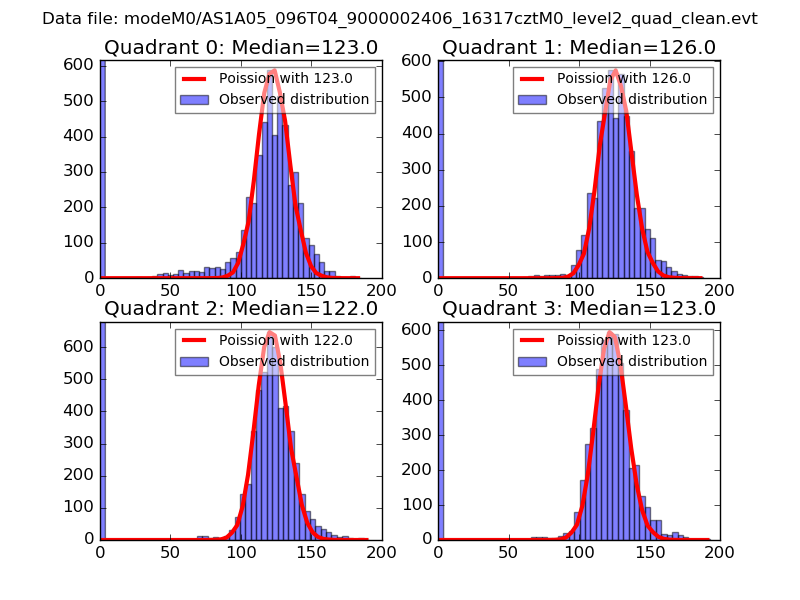 |
 |
| Quadrant-wise count rates Data is divided into 100 sec bins |
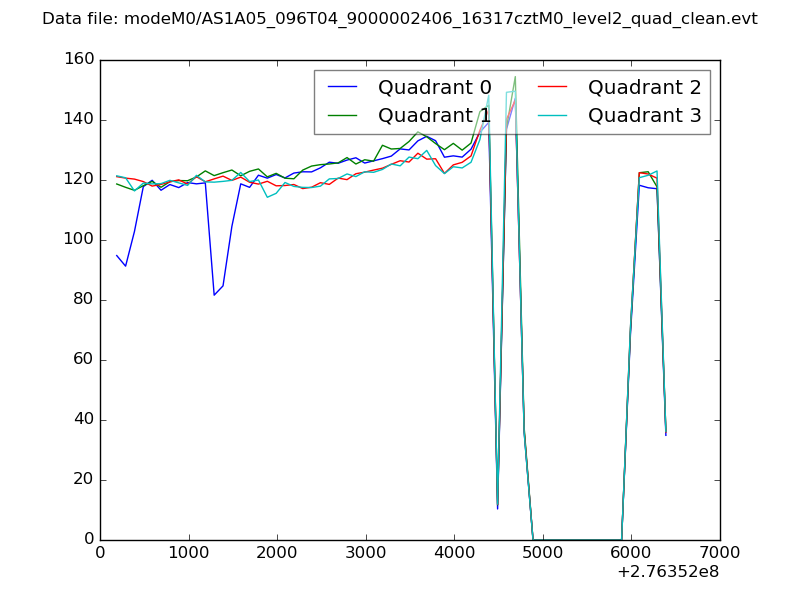 |
|
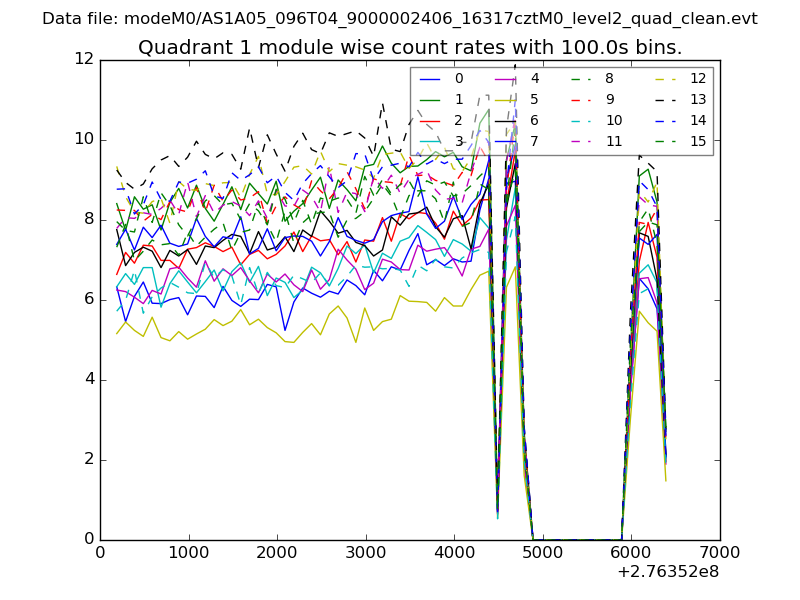
| Module-wise count rates for Quadrant A Data is divided into 100 sec bins |
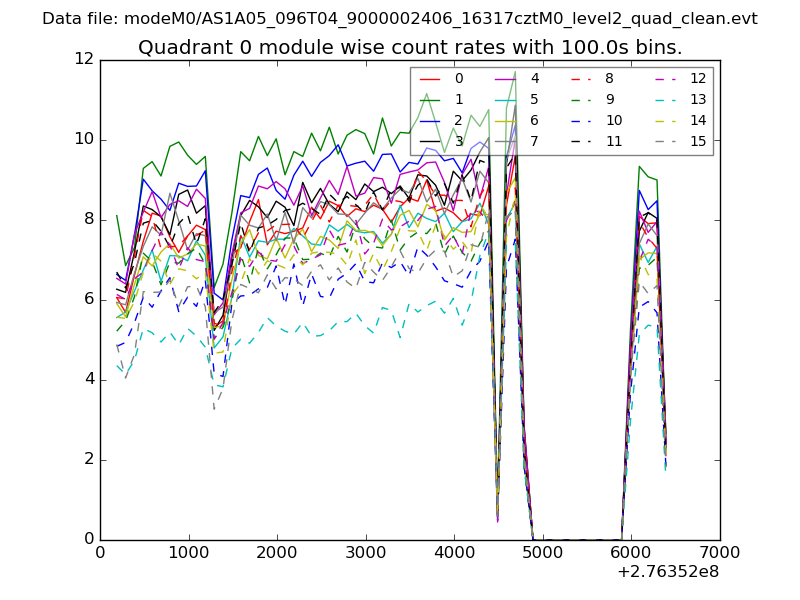 |
 |
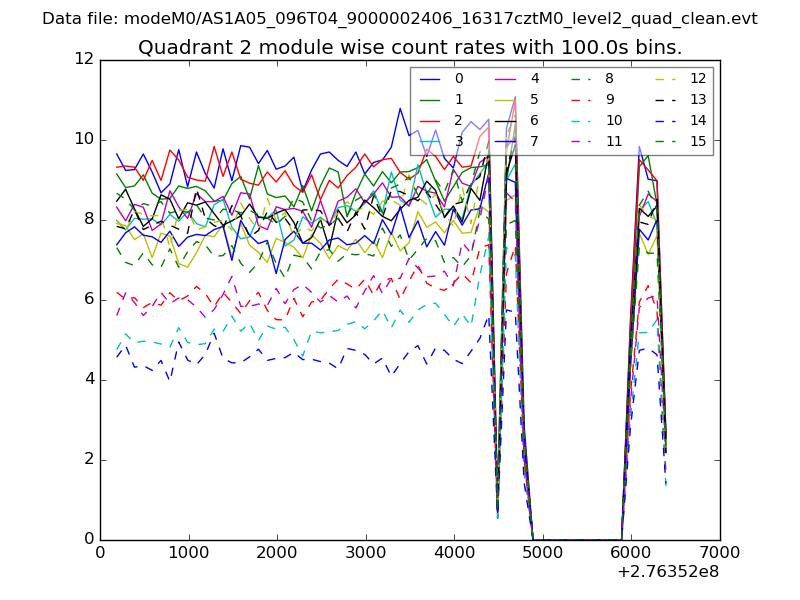
| Module-wise count rates for Quadrant B Data is divided into 100 sec bins |
 |
 |
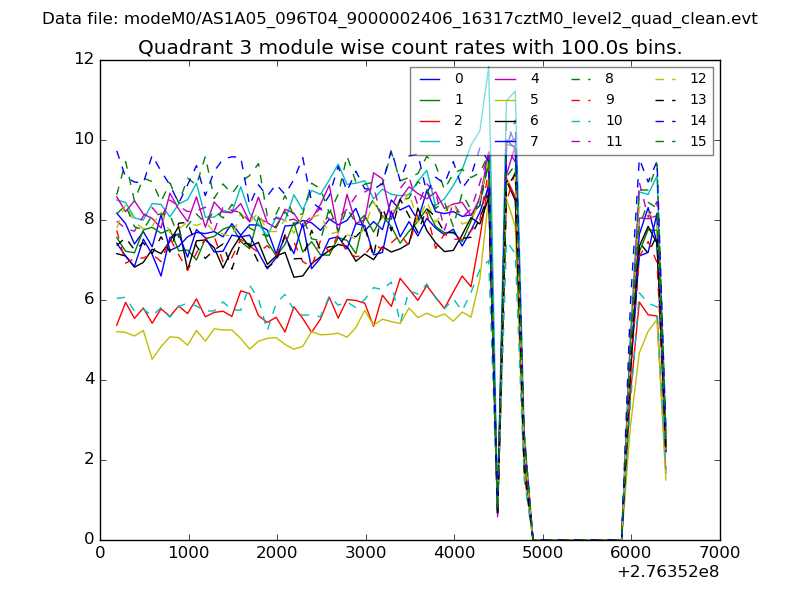
| Module-wise count rates for Quadrant C Data is divided into 100 sec bins |
 |
 |
| Module-wise count rates for Quadrant D Data is divided into 100 sec bins |
 |
 |
| Parameter | Plot |
|---|---|
| CZT HV Monitor | 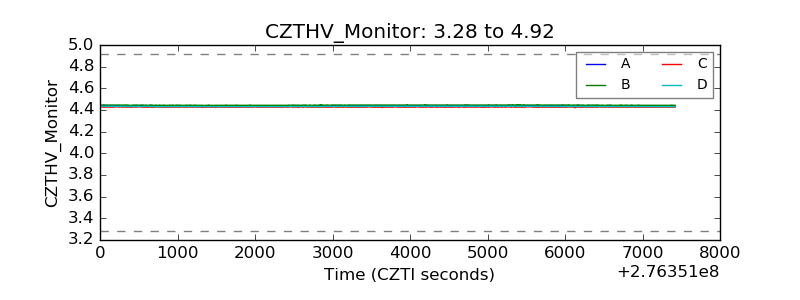 |
| D_VDD | 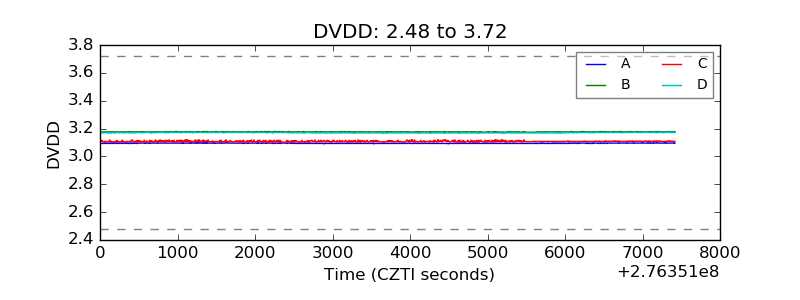 |
| Temperature 1 | 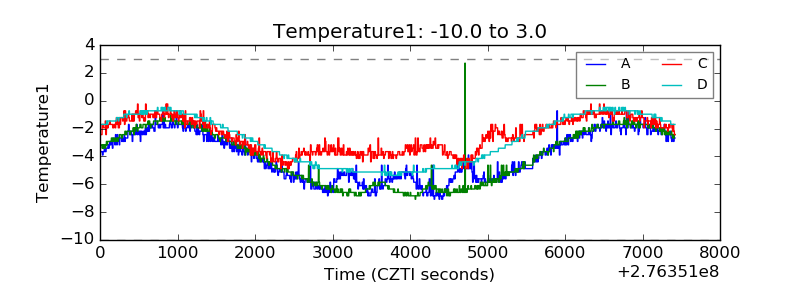 |
| Veto HV Monitor | 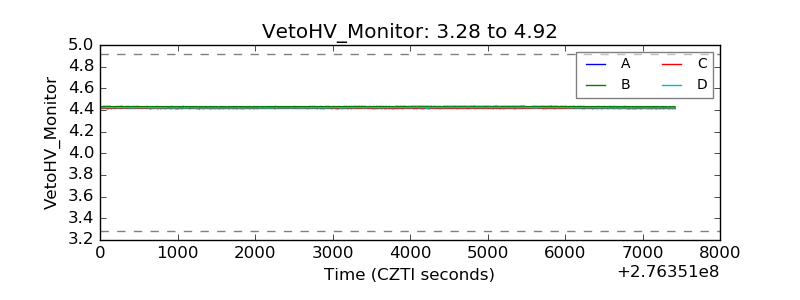 |
| Veto LLD | 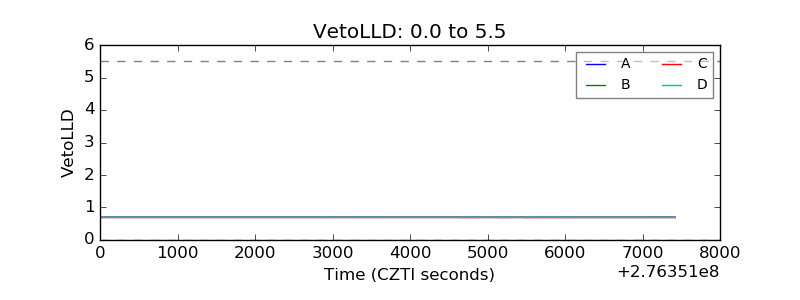 |
| Alpha Counter | 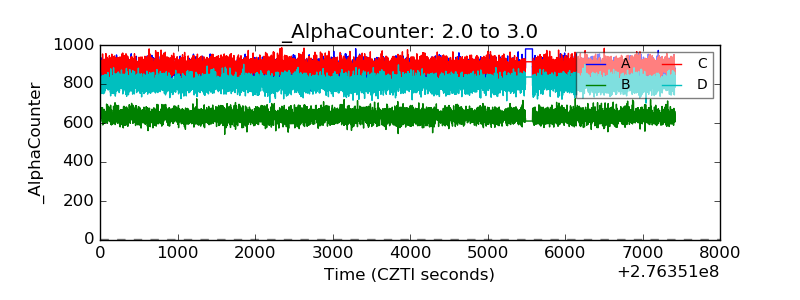 |
| _CPM_Rate | 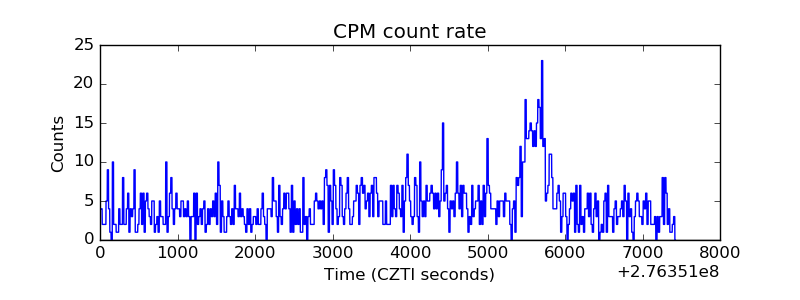 |
| CZT Counter | 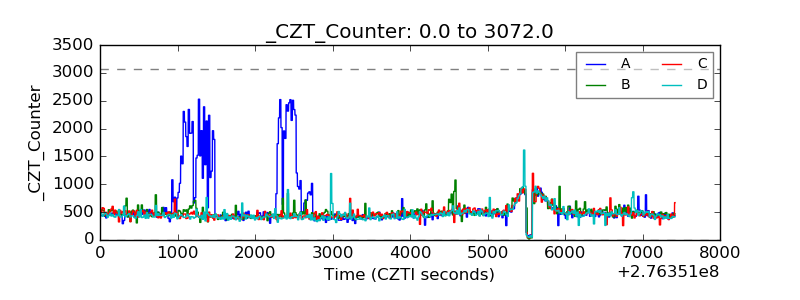 |
| +2.5 Volts monitor |  |
| +5 Volts monitor |  |
| _ROLL_ROT | 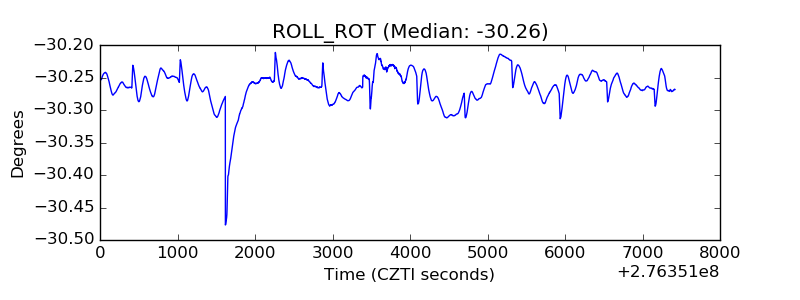 |
| _Roll_DEC | 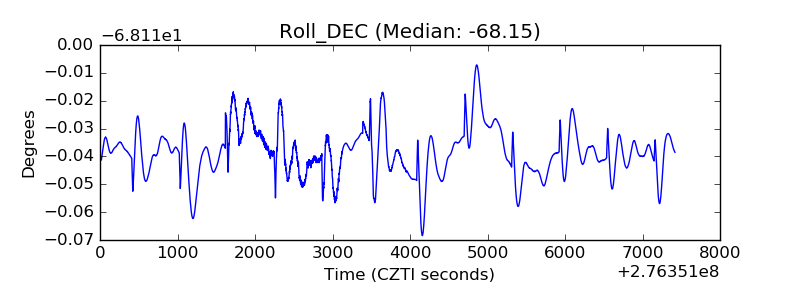 |
| _Roll_RA | 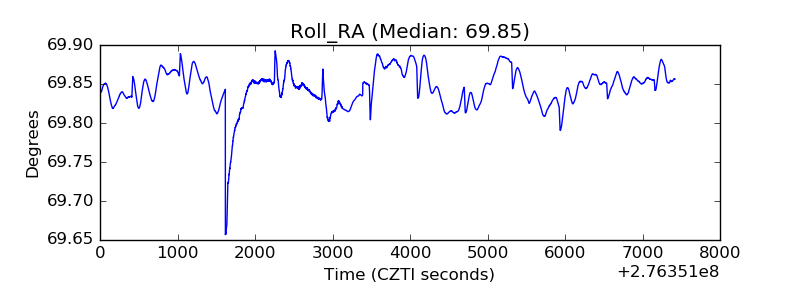 |
| Veto Counter | 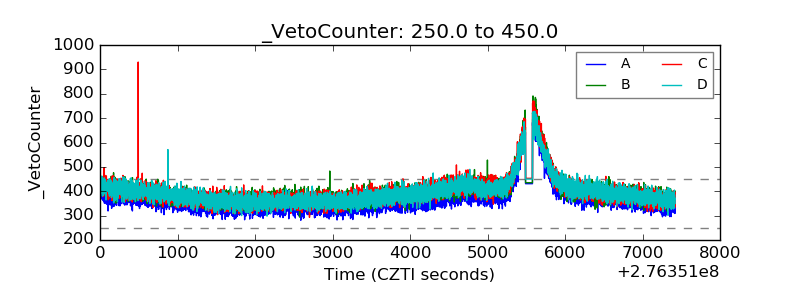 |