| Param | Original file | Final file |
|---|---|---|
| Filename | modeM0/AS1A05_096T04_9000002406_16318cztM0_level2.evt | modeM0/AS1A05_096T04_9000002406_16318cztM0_level2_quad_clean.evt |
| Size (bytes) | 526,861,440 | 109,333,440 |
| Size | 502.5 MB | 104.3 MB |
| Events in quadrant A | 3,646,576 | 695,559 |
| Events in quadrant B | 3,994,689 | 700,430 |
| Events in quadrant C | 3,775,758 | 690,522 |
| Events in quadrant D | 4,009,337 | 682,620 |
| Mode M0 | |||
|---|---|---|---|
| Quadrant | BADHDUFLAG | Total packets | Discarded packets |
| A | 0 | 16152 | 2 |
| B | 0 | 16874 | 1 |
| C | 0 | 16213 | 1 |
| D | 0 | 17312 | 1 |
| Mode SS | |||
|---|---|---|---|
| Quadrant | BADHDUFLAG | Total packets | Discarded packets |
| A | 0 | 158 | 0 |
| B | 0 | 158 | 0 |
| C | 0 | 158 | 0 |
| D | 0 | 158 | 0 |
| Mode M9 | |||
|---|---|---|---|
| Quadrant | BADHDUFLAG | Total packets | Discarded packets |
| A | 0 | 3 | 0 |
| B | 0 | 3 | 0 |
| C | 0 | 3 | 0 |
| D | 0 | 3 | 0 |
| Quadrant | Total seconds | Saturated seconds | Saturation percentage |
|---|---|---|---|
| A | 7797 | 153 | 1.962293% |
| B | 7797 | 232 | 2.975503% |
| C | 7797 | 199 | 2.552264% |
| D | 7797 | 187 | 2.398358% |
Noise dominated data is calculated using 1-second bins in cleaned event files. If a bin has >2000 counts, and if more than 50% of those come from <1% of pixels, then it is considered to be noise-dominated and hence unusable.
| Quadrant | # 1 sec bins | Bins with >0 counts | Bins with >2000 counts | High rate bins dominated by noise | Noise dominated (total time) | Noise dominated (detector-on time) | Marked lightcurve |
|---|---|---|---|---|---|---|---|
| A | 8088 | 7799 | 0 | 0 | 0.00% | 0.00% | 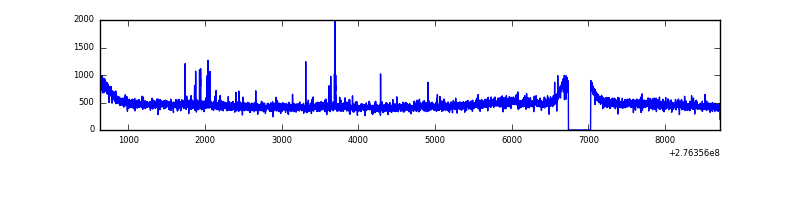 |
| B | 8088 | 7799 | 19 | 19 | 0.23% | 0.24% | 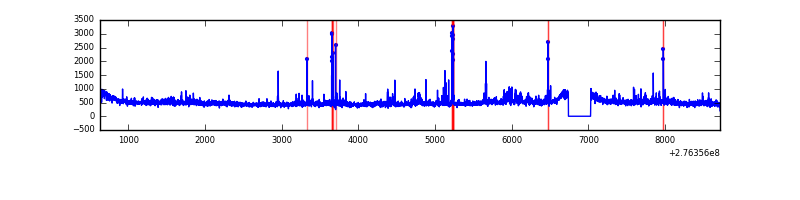 |
| C | 8088 | 7799 | 0 | 0 | 0.00% | 0.00% | 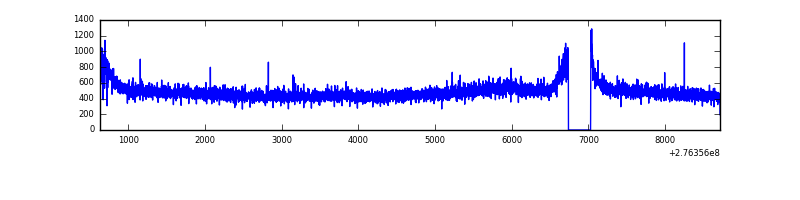 |
| D | 8088 | 7799 | 46 | 46 | 0.57% | 0.59% | 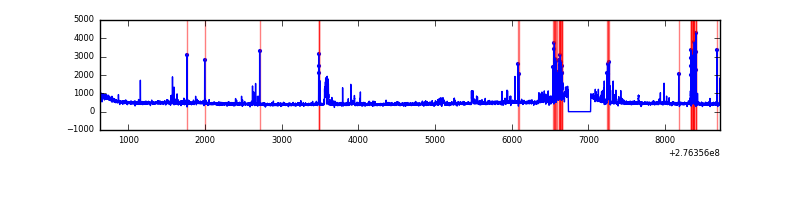 |
Top three noisy pixels from each quadrant. If the there are fewer than three noisy pixels in the level2.evt file, extra rows are filled as -1
| Pixel properties | Quadrant properties | ||||||
|---|---|---|---|---|---|---|---|
| Quadrant | DetID | PixID | Counts | Sigma | Mean | Median | Sigma |
| A | 15 | 174 | 37392 | 193.2 | 936 | 914 | 188.8 |
| A | 0 | 226 | 8325 | 39.25 | 936 | 914 | 188.8 |
| A | 12 | 194 | 7002 | 32.24 | 936 | 914 | 188.8 |
| B | 3 | 112 | 117678 | 657.37 | 935 | 910 | 177.6 |
| B | 0 | 198 | 62456 | 346.49 | 935 | 910 | 177.6 |
| B | 4 | 173 | 45986 | 253.76 | 935 | 910 | 177.6 |
| C | 14 | 238 | 140118 | 667.89 | 905 | 909 | 208.4 |
| C | 3 | 233 | 98719 | 469.27 | 905 | 909 | 208.4 |
| C | 0 | 207 | 7849 | 33.3 | 905 | 909 | 208.4 |
| D | 12 | 110 | 327641 | 1331.93 | 912 | 894 | 245.3 |
| D | 2 | 122 | 84914 | 342.49 | 912 | 894 | 245.3 |
| D | 1 | 52 | 35440 | 140.82 | 912 | 894 | 245.3 |
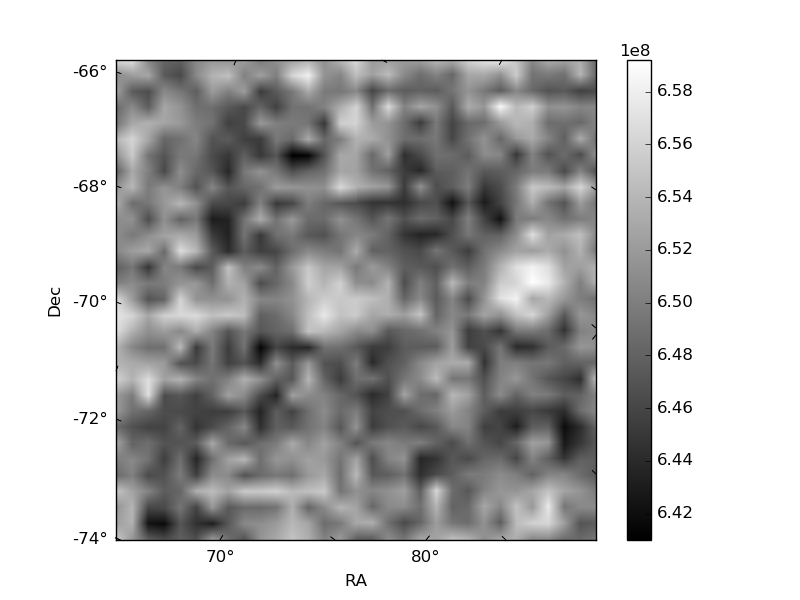
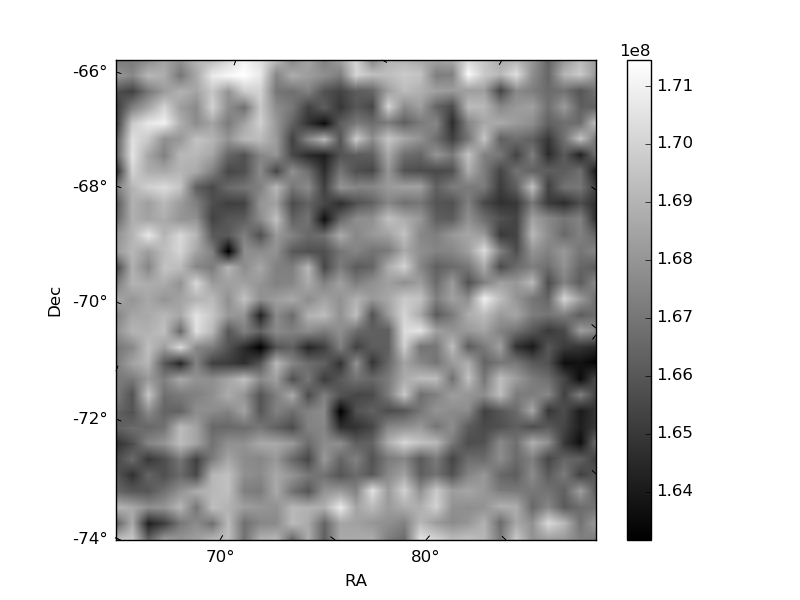
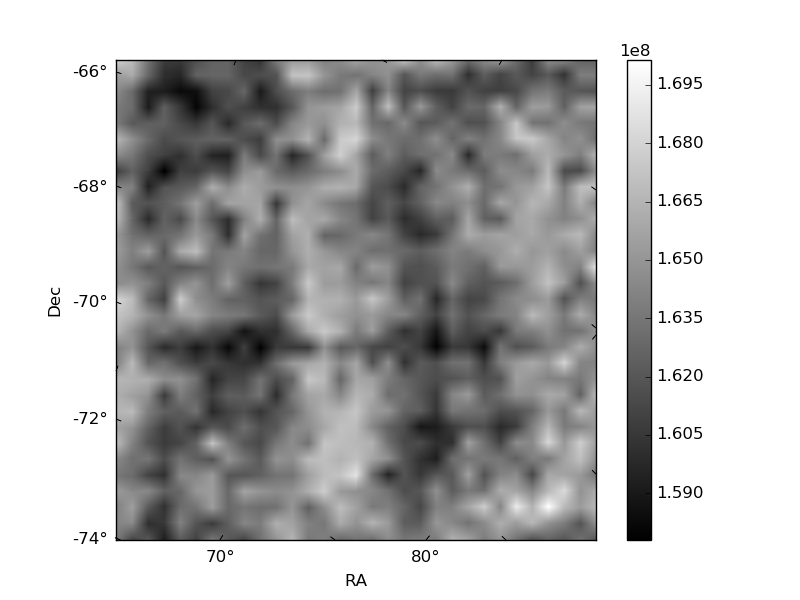
Histogram calculated using DETX and DETY for each event in the final _common_clean file
| Quadrant A | 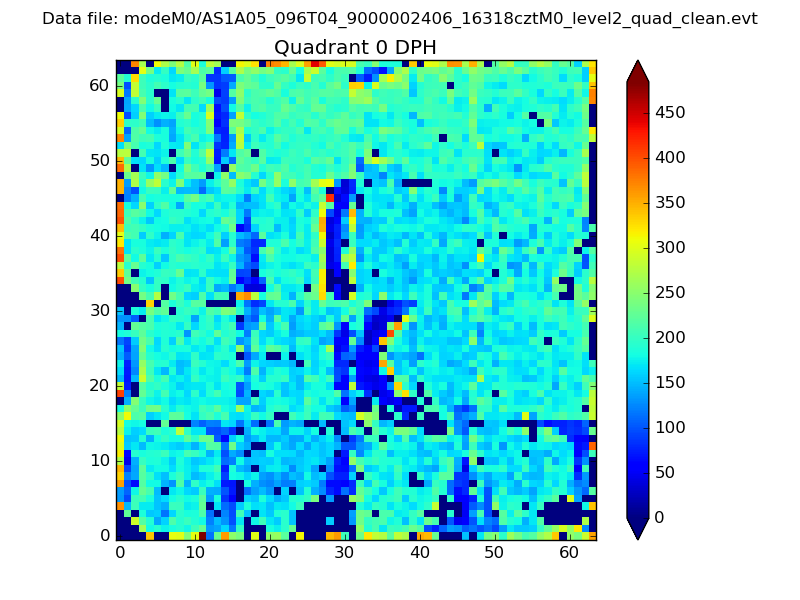 |
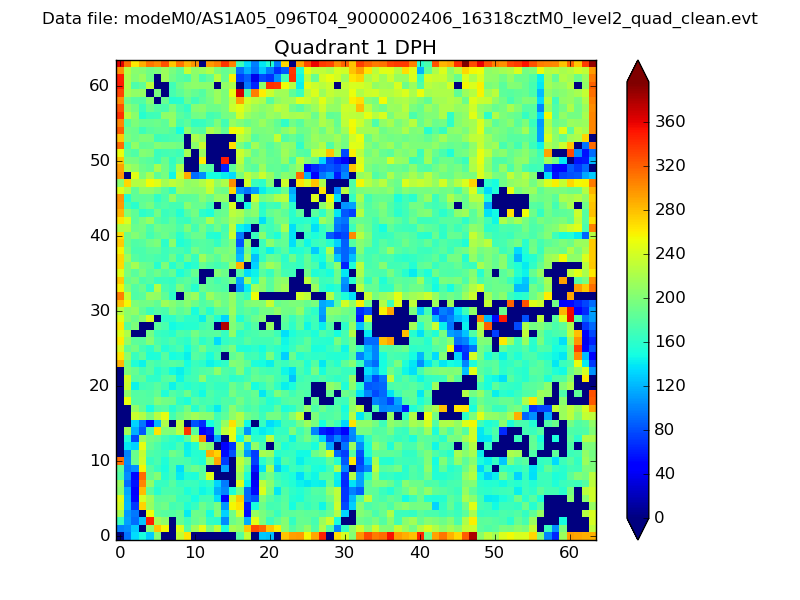 |
Quadrant B |
|---|---|---|---|
| Quadrant D | 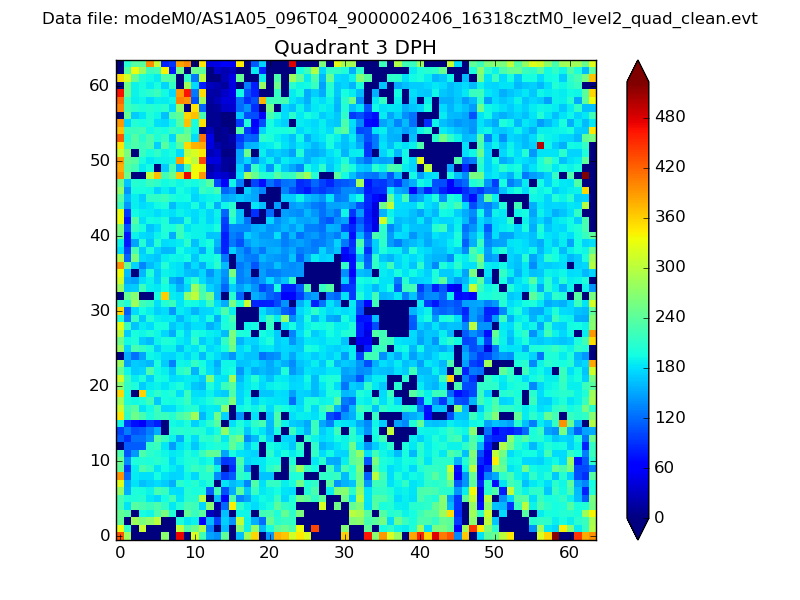 |
 |
Quadrant C |
| Plot type | Count rate plots | Images |
|---|---|---|
| Comparison with Poisson distribution Blue bars denote a histogram of data divided into 1 sec bins. Red curve is a Poisson curve with rate = median count rate of data. |
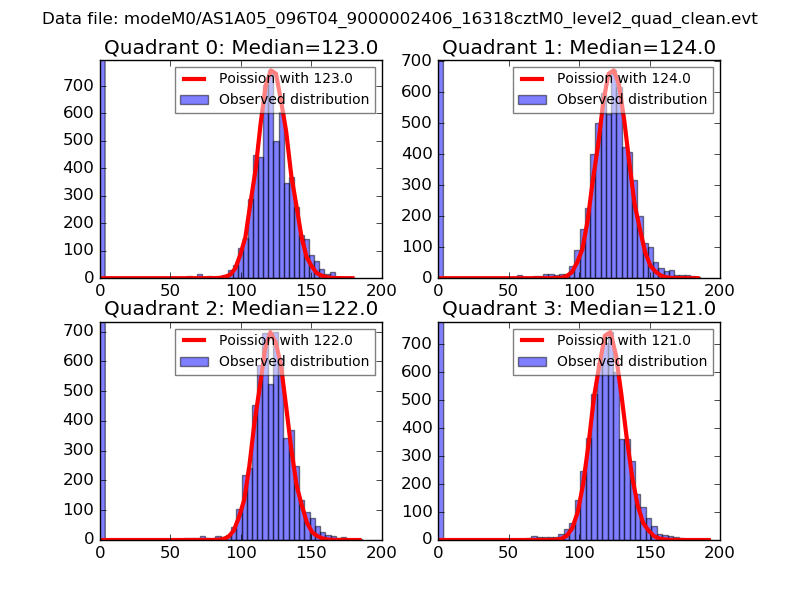 |
 |
| Quadrant-wise count rates Data is divided into 100 sec bins |
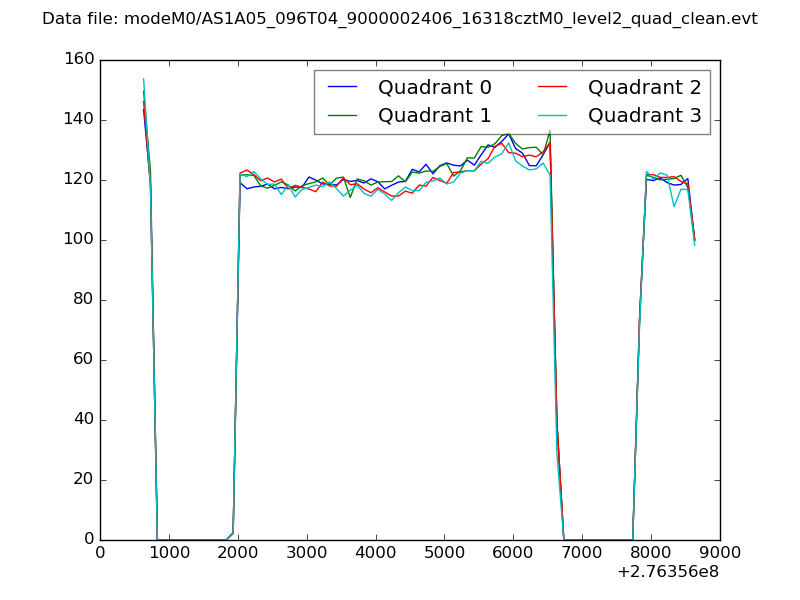 |
|
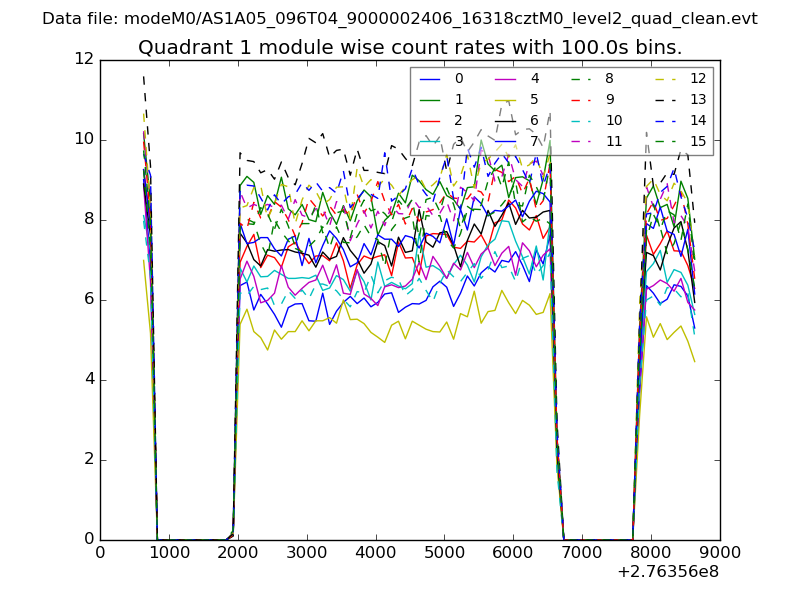
| Module-wise count rates for Quadrant A Data is divided into 100 sec bins |
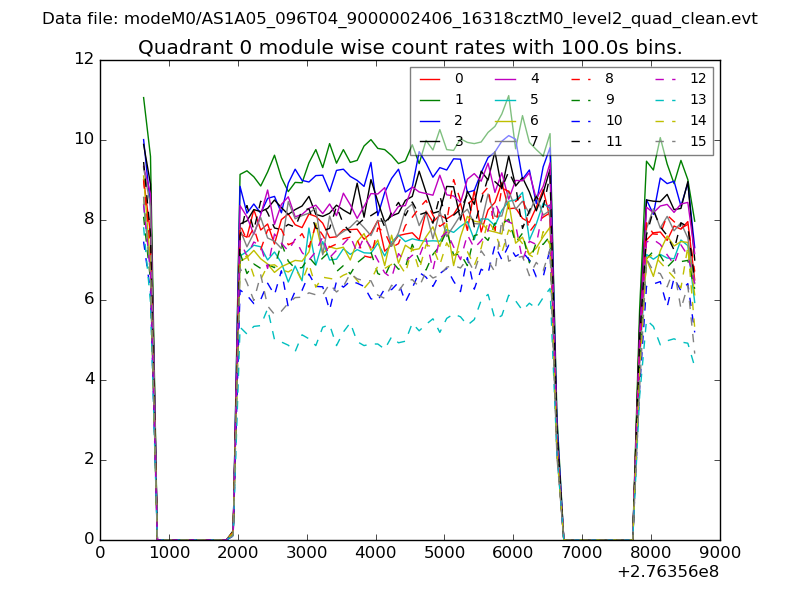 |
 |
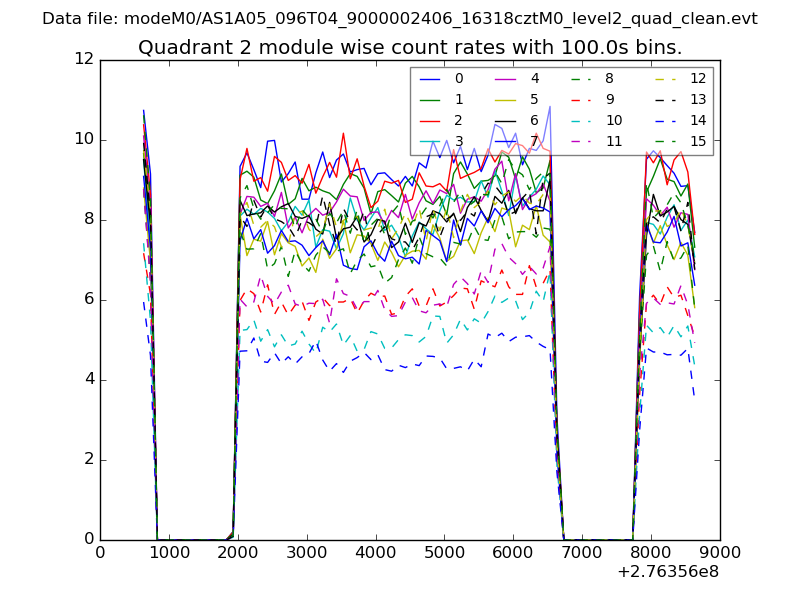
| Module-wise count rates for Quadrant B Data is divided into 100 sec bins |
 |
 |
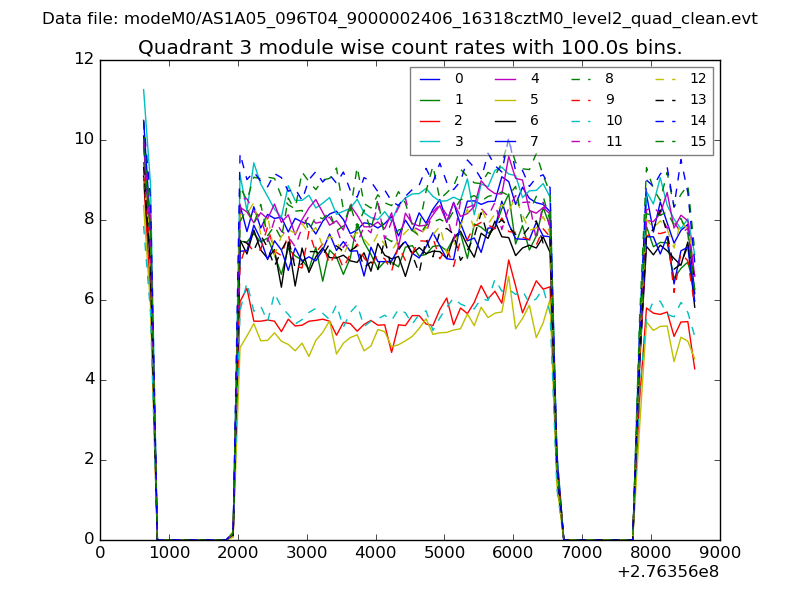
| Module-wise count rates for Quadrant C Data is divided into 100 sec bins |
 |
 |
| Module-wise count rates for Quadrant D Data is divided into 100 sec bins |
 |
 |
| Parameter | Plot |
|---|---|
| CZT HV Monitor | 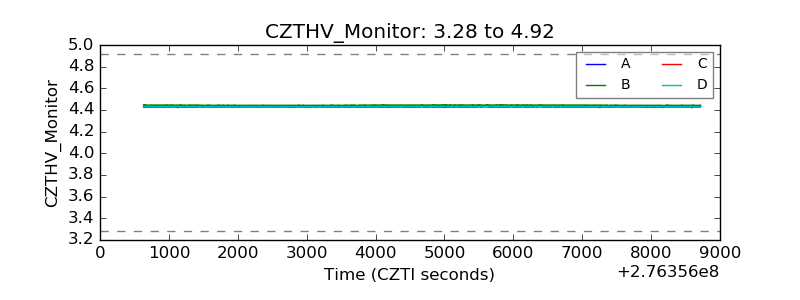 |
| D_VDD | 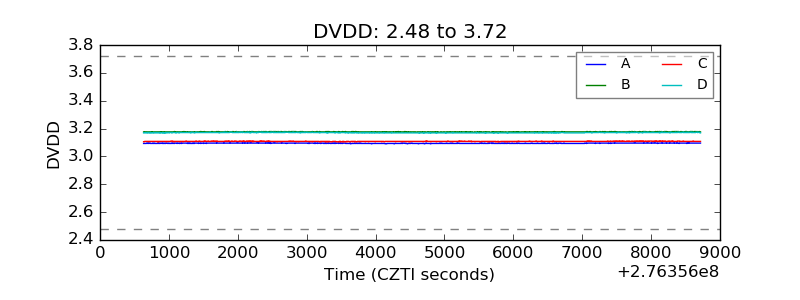 |
| Temperature 1 | 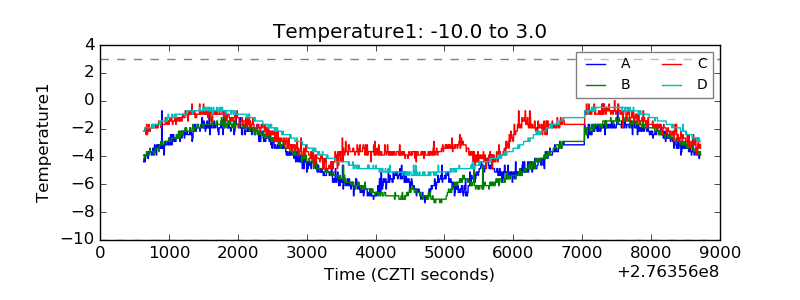 |
| Veto HV Monitor | 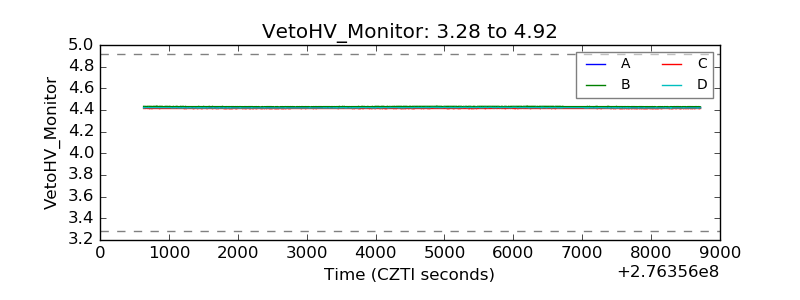 |
| Veto LLD | 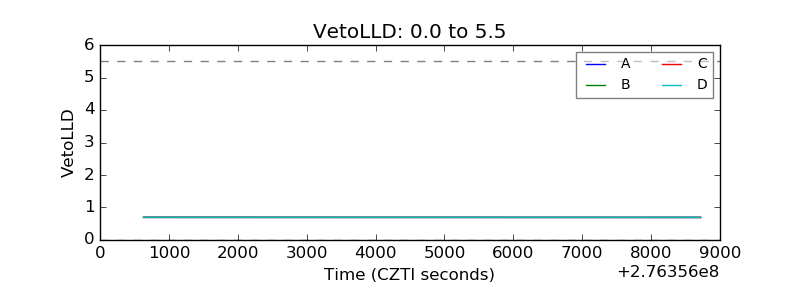 |
| Alpha Counter | 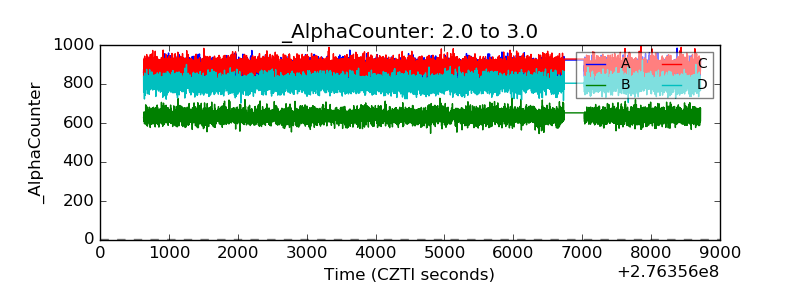 |
| _CPM_Rate | 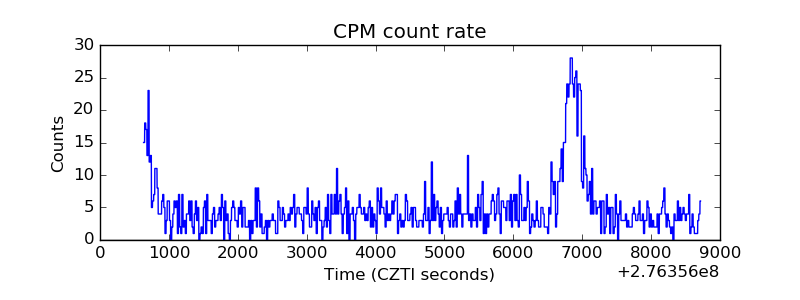 |
| CZT Counter | 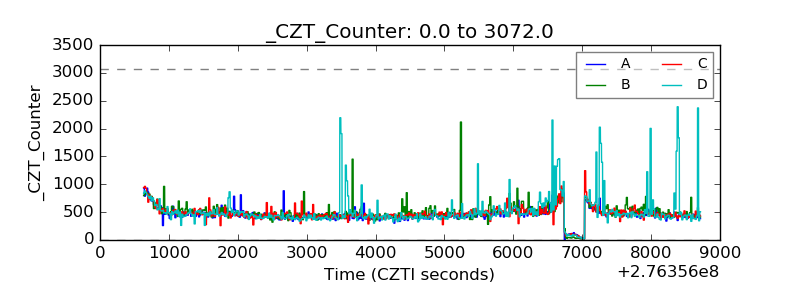 |
| +2.5 Volts monitor | 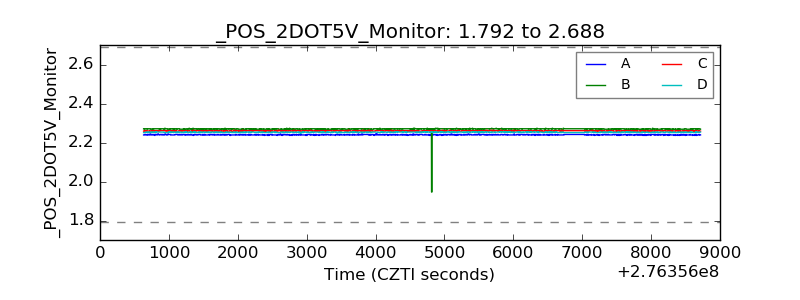 |
| +5 Volts monitor |  |
| _ROLL_ROT | 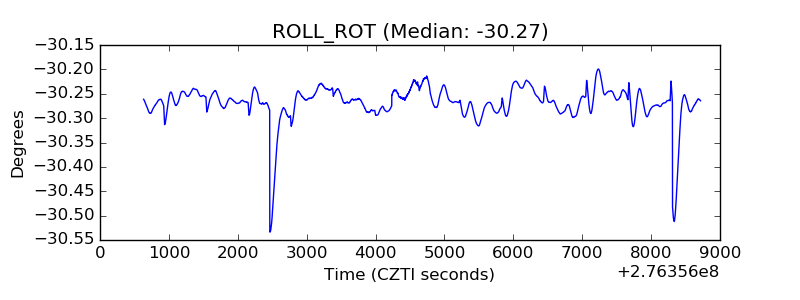 |
| _Roll_DEC | 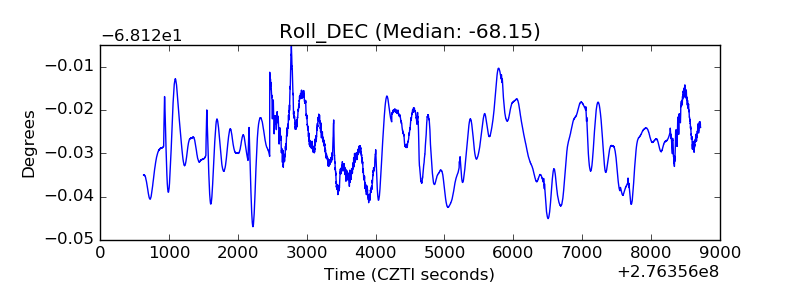 |
| _Roll_RA | 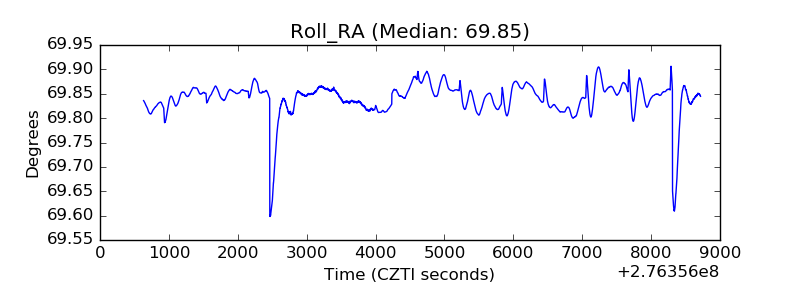 |
| Veto Counter | 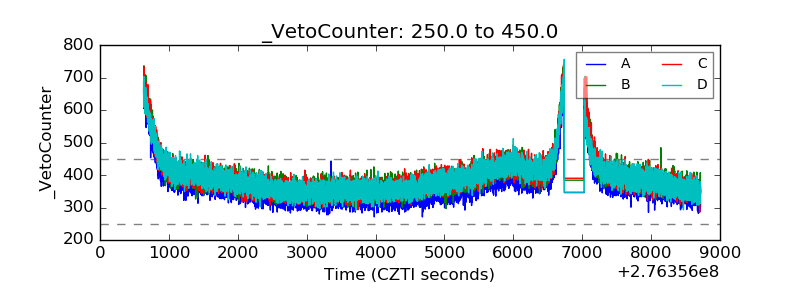 |