| Param | Original file | Final file |
|---|---|---|
| Filename | modeM0/AS1A05_096T04_9000002406_16320cztM0_level2.evt | modeM0/AS1A05_096T04_9000002406_16320cztM0_level2_quad_clean.evt |
| Size (bytes) | 344,292,480 | 86,296,320 |
| Size | 328.3 MB | 82.3 MB |
| Events in quadrant A | 2,367,408 | 564,144 |
| Events in quadrant B | 2,757,977 | 567,980 |
| Events in quadrant C | 2,469,013 | 554,439 |
| Events in quadrant D | 2,465,391 | 549,667 |
| Mode M0 | |||
|---|---|---|---|
| Quadrant | BADHDUFLAG | Total packets | Discarded packets |
| A | 0 | 10812 | 1 |
| B | 0 | 11683 | 0 |
| C | 0 | 10848 | 0 |
| D | 0 | 11200 | 0 |
| Mode SS | |||
|---|---|---|---|
| Quadrant | BADHDUFLAG | Total packets | Discarded packets |
| A | 0 | 108 | 0 |
| B | 0 | 108 | 0 |
| C | 0 | 108 | 0 |
| D | 0 | 108 | 0 |
| Quadrant | Total seconds | Saturated seconds | Saturation percentage |
|---|---|---|---|
| A | 5385 | 1 | 0.018570% |
| B | 5385 | 49 | 0.909935% |
| C | 5385 | 19 | 0.352832% |
| D | 5385 | 24 | 0.445682% |
Noise dominated data is calculated using 1-second bins in cleaned event files. If a bin has >2000 counts, and if more than 50% of those come from <1% of pixels, then it is considered to be noise-dominated and hence unusable.
| Quadrant | # 1 sec bins | Bins with >0 counts | Bins with >2000 counts | High rate bins dominated by noise | Noise dominated (total time) | Noise dominated (detector-on time) | Marked lightcurve |
|---|---|---|---|---|---|---|---|
| A | 5386 | 5386 | 0 | 0 | 0.00% | 0.00% | 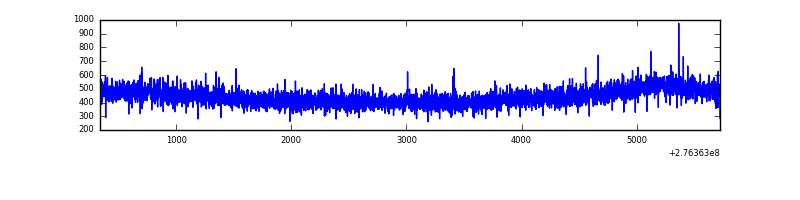 |
| B | 5386 | 5386 | 34 | 34 | 0.63% | 0.63% | 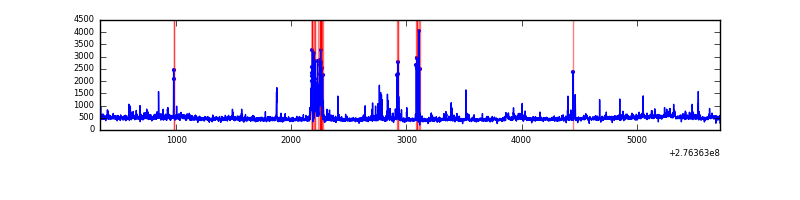 |
| C | 5386 | 5386 | 0 | 0 | 0.00% | 0.00% | 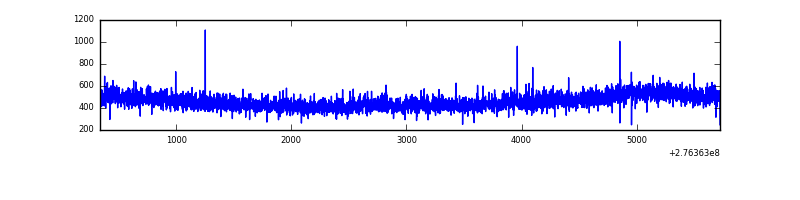 |
| D | 5386 | 5386 | 21 | 21 | 0.39% | 0.39% | 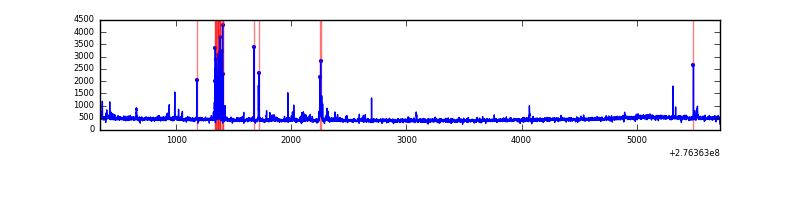 |
Top three noisy pixels from each quadrant. If the there are fewer than three noisy pixels in the level2.evt file, extra rows are filled as -1
| Pixel properties | Quadrant properties | ||||||
|---|---|---|---|---|---|---|---|
| Quadrant | DetID | PixID | Counts | Sigma | Mean | Median | Sigma |
| A | 0 | 226 | 5505 | 39.11 | 613 | 599 | 125.4 |
| A | 12 | 194 | 4511 | 31.19 | 613 | 599 | 125.4 |
| A | 15 | 174 | 4454 | 30.73 | 613 | 599 | 125.4 |
| B | 3 | 112 | 183715 | 1559.24 | 615 | 600 | 117.4 |
| B | 4 | 173 | 76176 | 643.54 | 615 | 600 | 117.4 |
| B | 0 | 198 | 23133 | 191.87 | 615 | 600 | 117.4 |
| C | 14 | 238 | 91140 | 646.89 | 596 | 599 | 140.0 |
| C | 3 | 233 | 44067 | 310.57 | 596 | 599 | 140.0 |
| C | 0 | 207 | 7982 | 52.75 | 596 | 599 | 140.0 |
| D | 12 | 110 | 86286 | 586.16 | 601 | 583 | 146.2 |
| D | 1 | 52 | 74072 | 502.62 | 601 | 583 | 146.2 |
| D | 2 | 234 | 24042 | 160.45 | 601 | 583 | 146.2 |
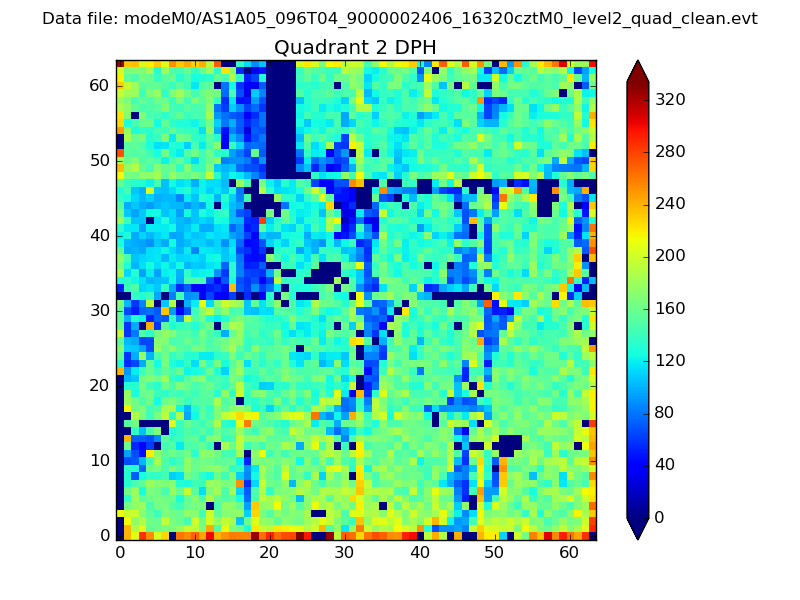
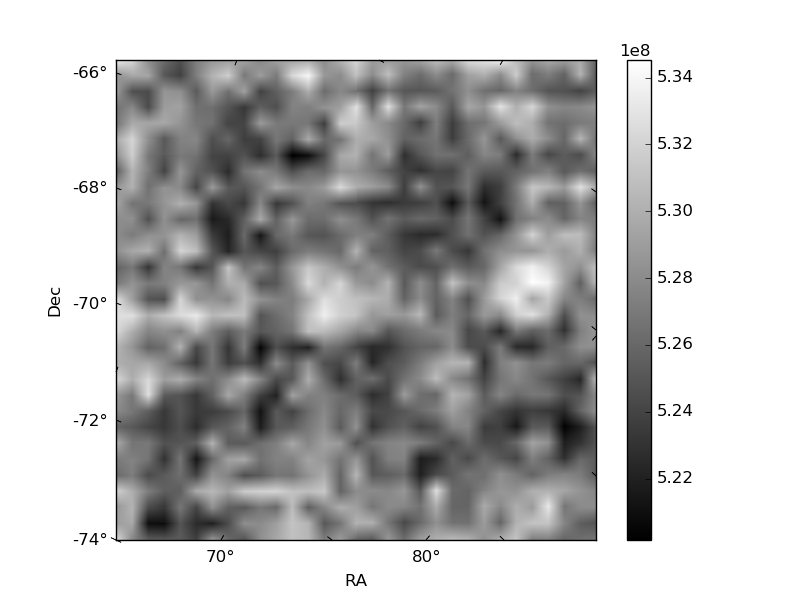
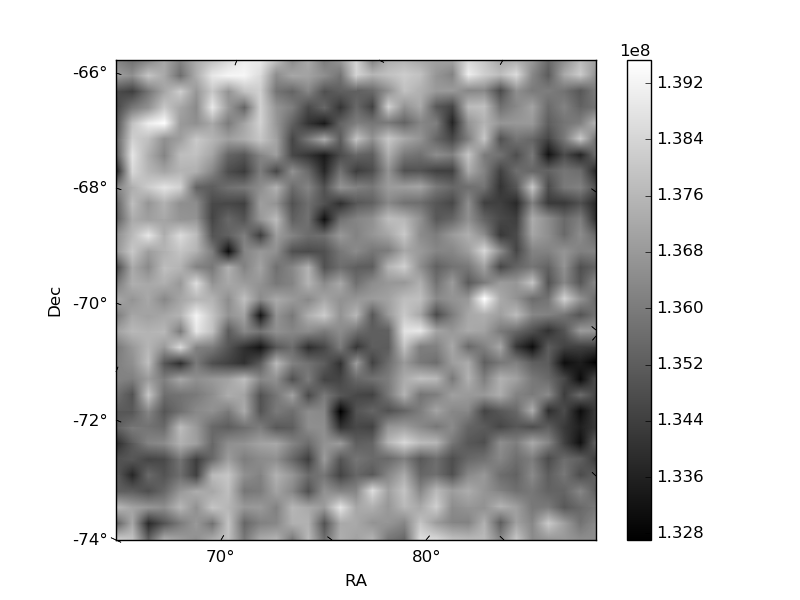
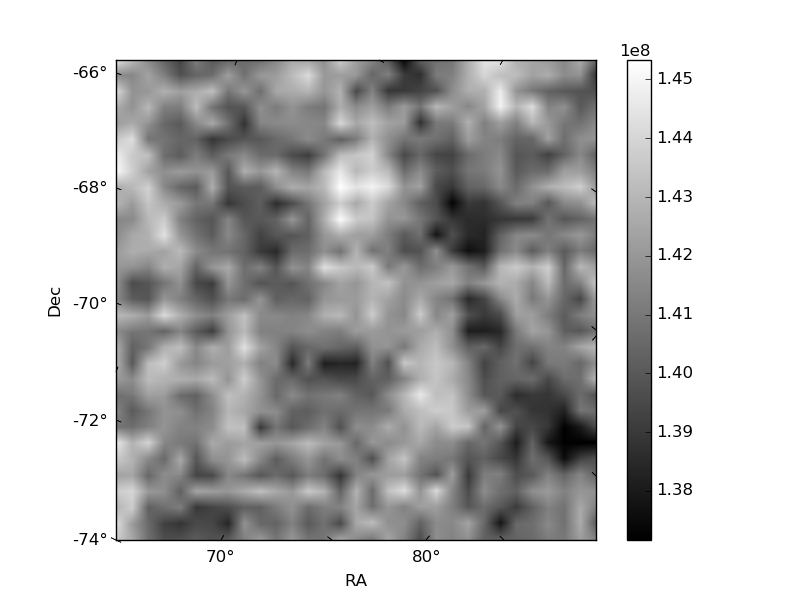
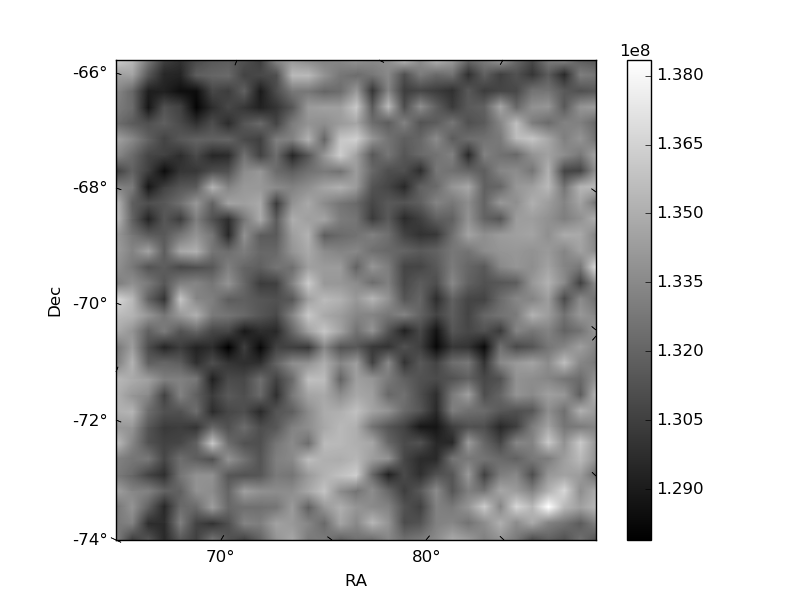
Histogram calculated using DETX and DETY for each event in the final _common_clean file
| Quadrant A | 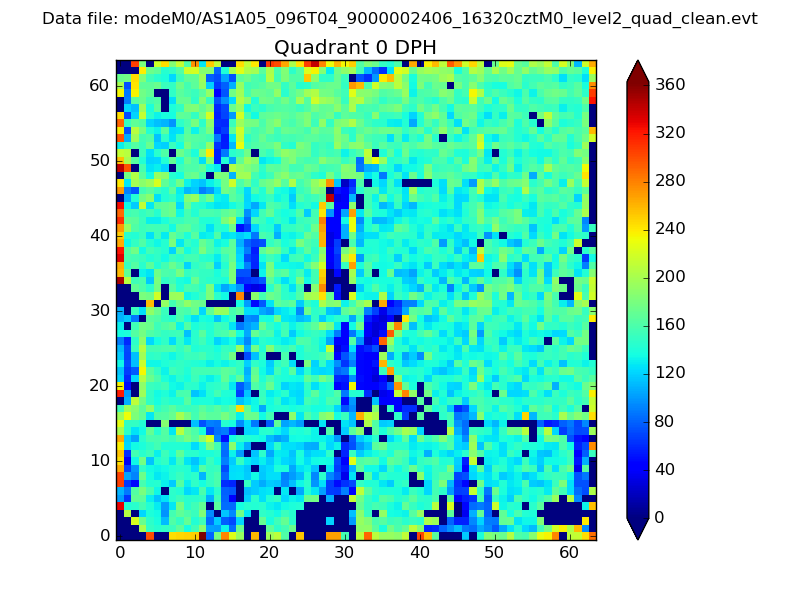 |
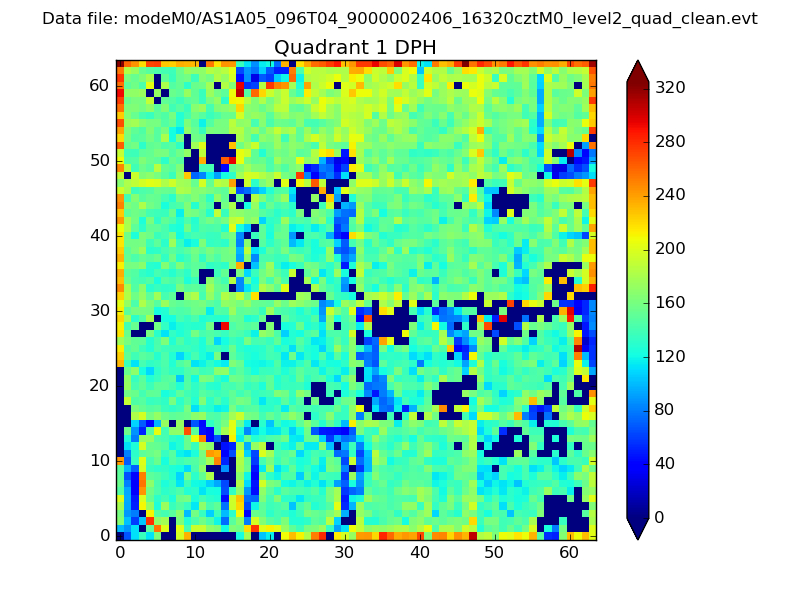 |
Quadrant B |
|---|---|---|---|
| Quadrant D | 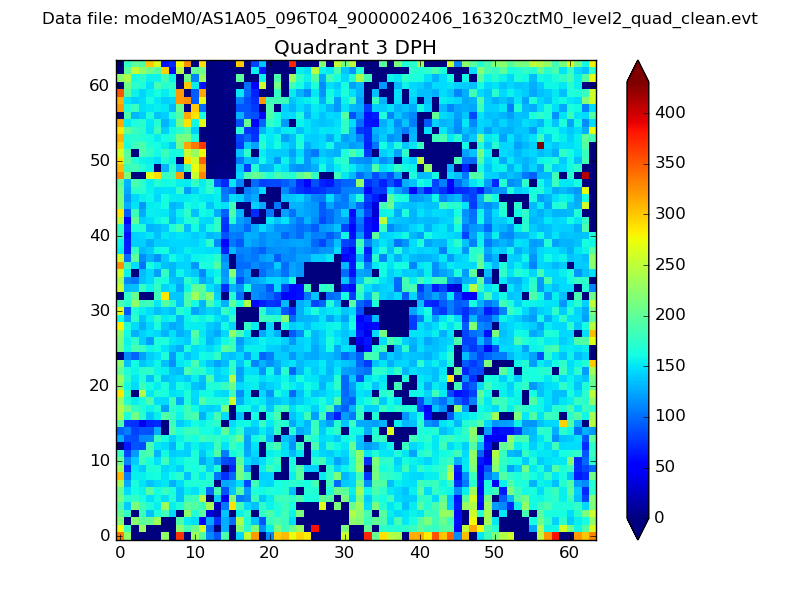 |
 |
Quadrant C |
| Plot type | Count rate plots | Images |
|---|---|---|
| Comparison with Poisson distribution Blue bars denote a histogram of data divided into 1 sec bins. Red curve is a Poisson curve with rate = median count rate of data. |
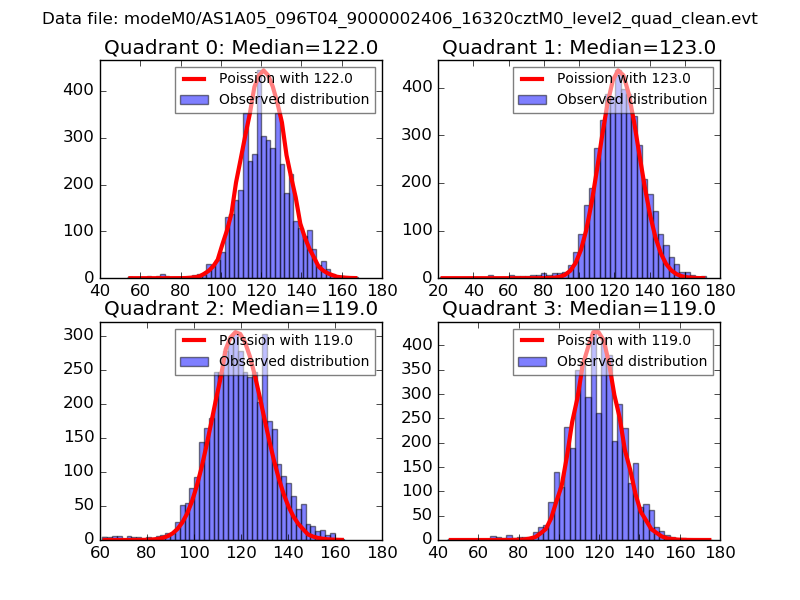 |
 |
| Quadrant-wise count rates Data is divided into 100 sec bins |
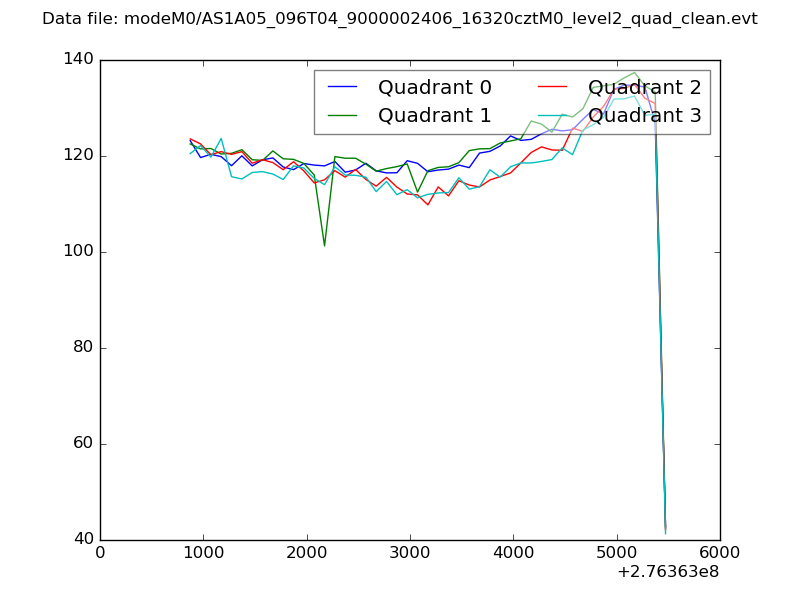 |
|
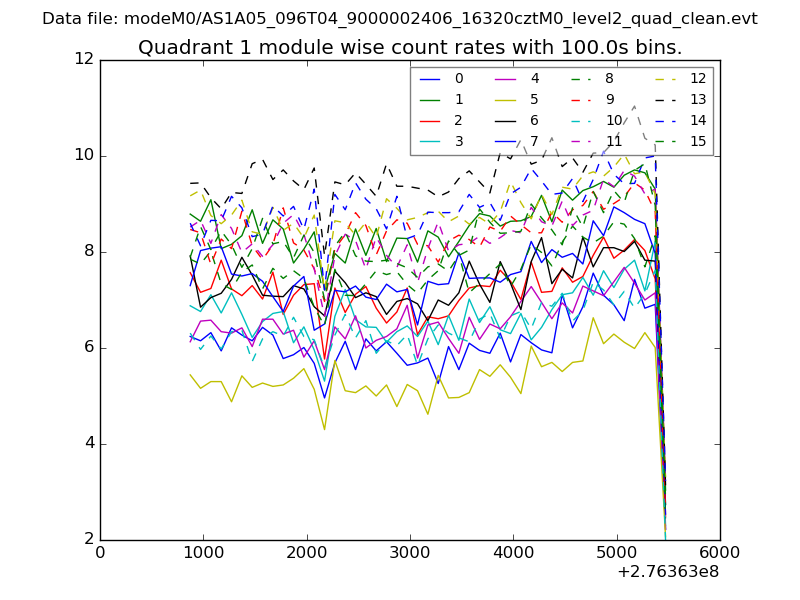
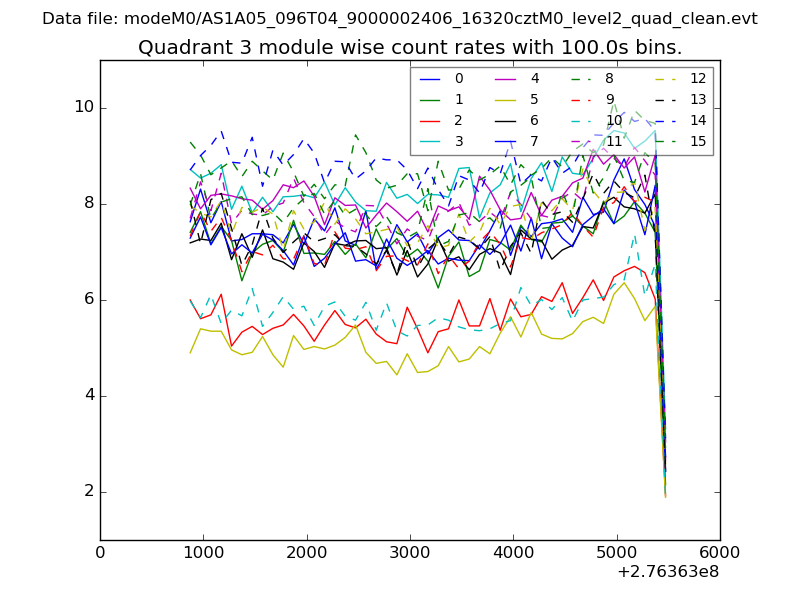
| Module-wise count rates for Quadrant A Data is divided into 100 sec bins |
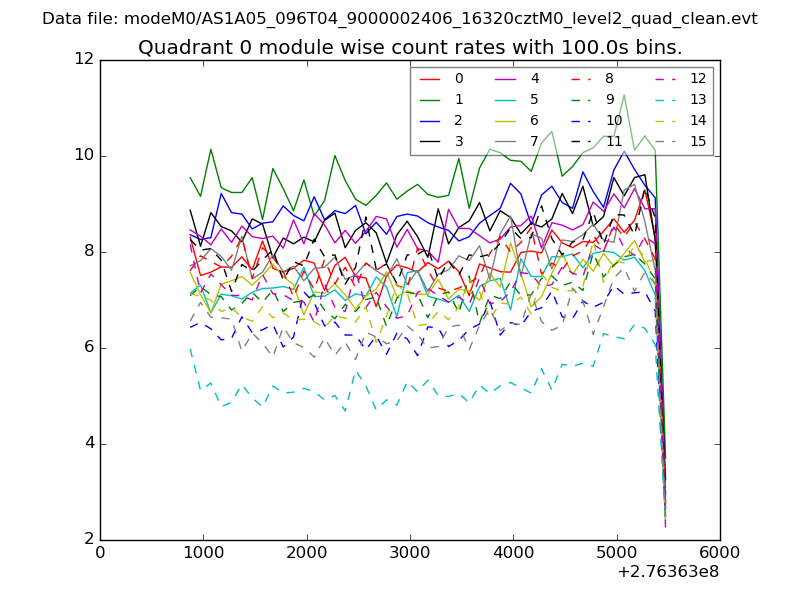 |
 |
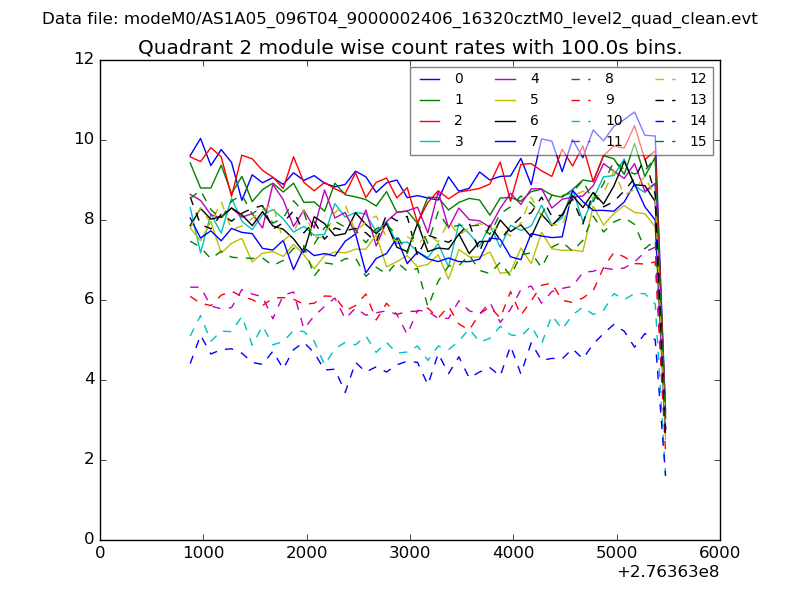
| Module-wise count rates for Quadrant B Data is divided into 100 sec bins |
 |
 |
| Module-wise count rates for Quadrant C Data is divided into 100 sec bins |
 |
 |
| Module-wise count rates for Quadrant D Data is divided into 100 sec bins |
 |
 |
| Parameter | Plot |
|---|---|
| CZT HV Monitor | 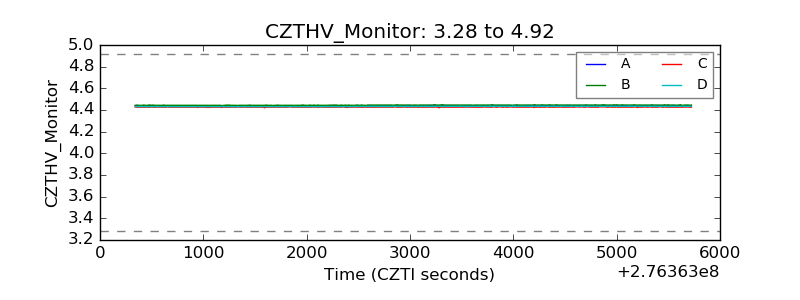 |
| D_VDD | 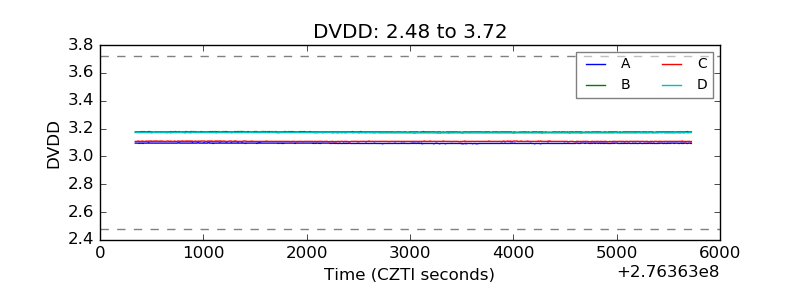 |
| Temperature 1 | 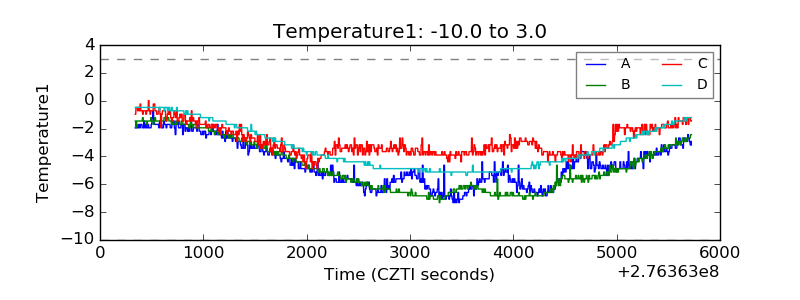 |
| Veto HV Monitor | 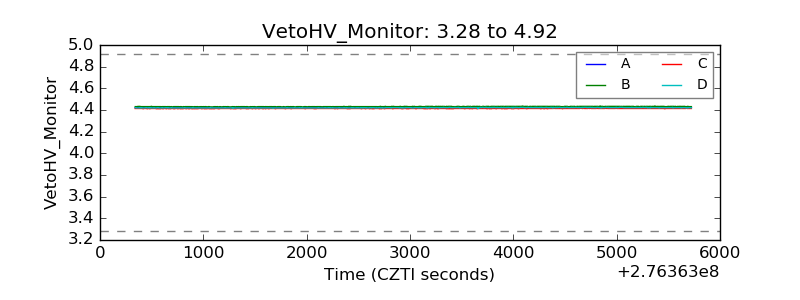 |
| Veto LLD | 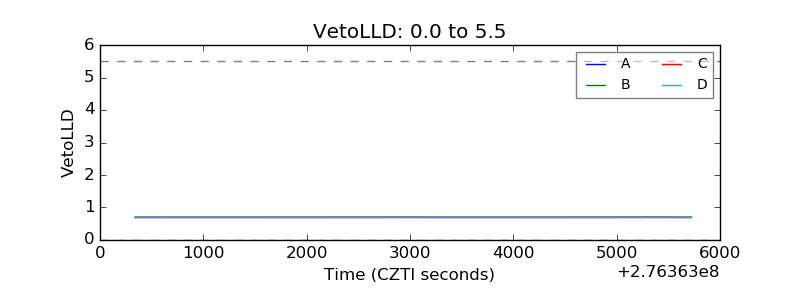 |
| Alpha Counter | 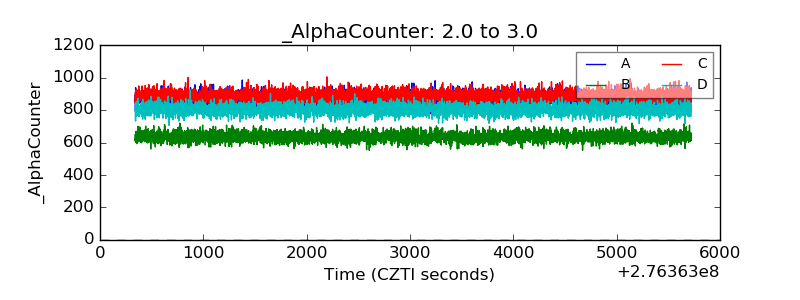 |
| _CPM_Rate | 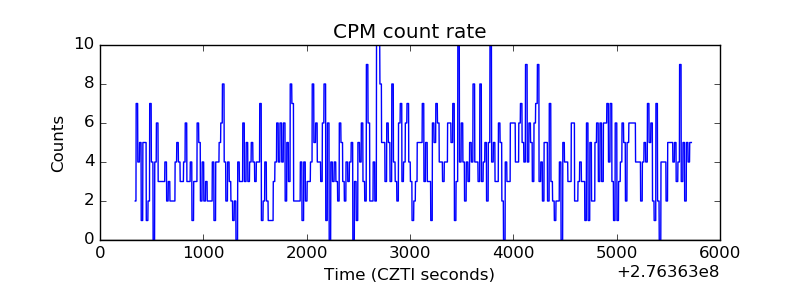 |
| CZT Counter | 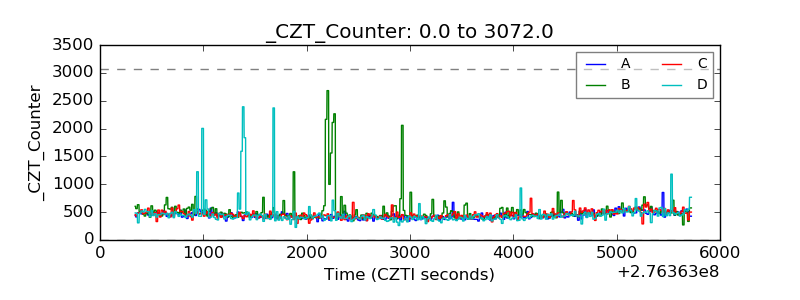 |
| +2.5 Volts monitor |  |
| +5 Volts monitor |  |
| _ROLL_ROT | 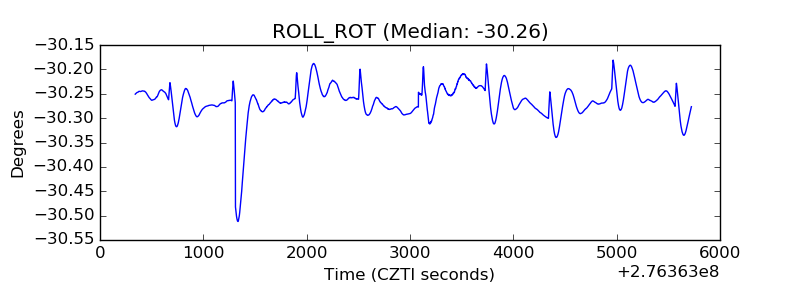 |
| _Roll_DEC | 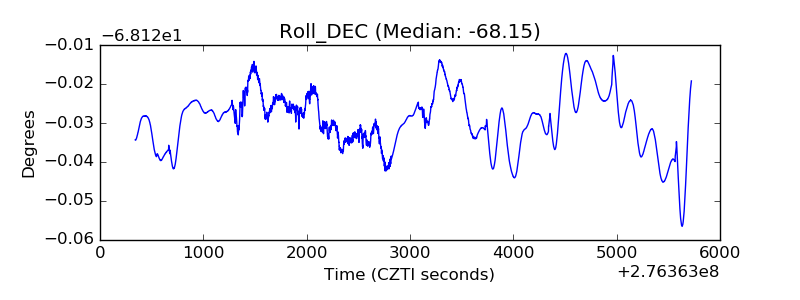 |
| _Roll_RA | 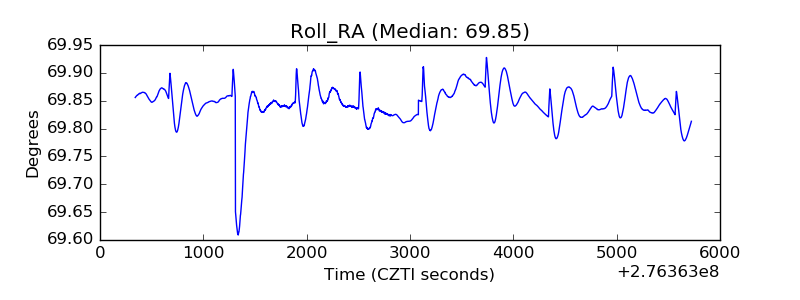 |
| Veto Counter | 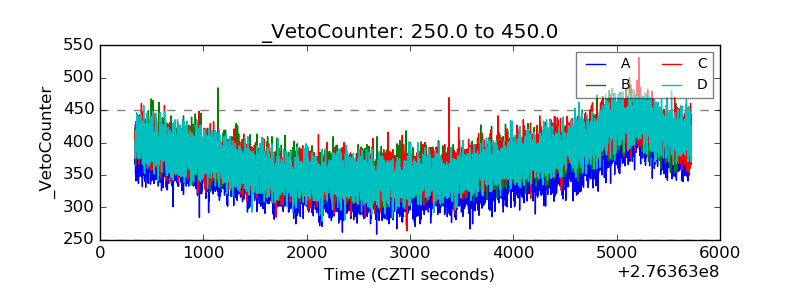 |