| Param | Original file | Final file |
|---|---|---|
| Filename | modeM0/AS1A05_096T04_9000002406_16321cztM0_level2.evt | modeM0/AS1A05_096T04_9000002406_16321cztM0_level2_quad_clean.evt |
| Size (bytes) | 954,360,000 | 207,097,920 |
| Size | 910.1 MB | 197.5 MB |
| Events in quadrant A | 6,113,638 | 1,356,086 |
| Events in quadrant B | 8,873,340 | 1,343,525 |
| Events in quadrant C | 6,237,240 | 1,337,204 |
| Events in quadrant D | 6,773,230 | 1,311,765 |
| Mode M0 | |||
|---|---|---|---|
| Quadrant | BADHDUFLAG | Total packets | Discarded packets |
| A | 0 | 27269 | 4 |
| B | 0 | 35281 | 3 |
| C | 0 | 27220 | 3 |
| D | 0 | 29363 | 3 |
| Mode SS | |||
|---|---|---|---|
| Quadrant | BADHDUFLAG | Total packets | Discarded packets |
| A | 0 | 274 | 0 |
| B | 0 | 274 | 0 |
| C | 0 | 274 | 0 |
| D | 0 | 274 | 0 |
| Mode M9 | |||
|---|---|---|---|
| Quadrant | BADHDUFLAG | Total packets | Discarded packets |
| A | 0 | 20 | 0 |
| B | 0 | 20 | 0 |
| C | 0 | 20 | 0 |
| D | 0 | 20 | 0 |
| Quadrant | Total seconds | Saturated seconds | Saturation percentage |
|---|---|---|---|
| A | 13374 | 85 | 0.635562% |
| B | 13374 | 815 | 6.093914% |
| C | 13374 | 129 | 0.964558% |
| D | 13374 | 168 | 1.256169% |
Noise dominated data is calculated using 1-second bins in cleaned event files. If a bin has >2000 counts, and if more than 50% of those come from <1% of pixels, then it is considered to be noise-dominated and hence unusable.
| Quadrant | # 1 sec bins | Bins with >0 counts | Bins with >2000 counts | High rate bins dominated by noise | Noise dominated (total time) | Noise dominated (detector-on time) | Marked lightcurve |
|---|---|---|---|---|---|---|---|
| A | 15420 | 13378 | 4 | 4 | 0.03% | 0.03% | 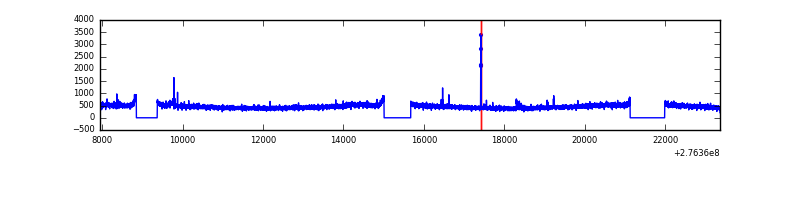 |
| B | 15420 | 13378 | 434 | 434 | 2.81% | 3.24% |  |
| C | 15420 | 13378 | 0 | 0 | 0.00% | 0.00% | 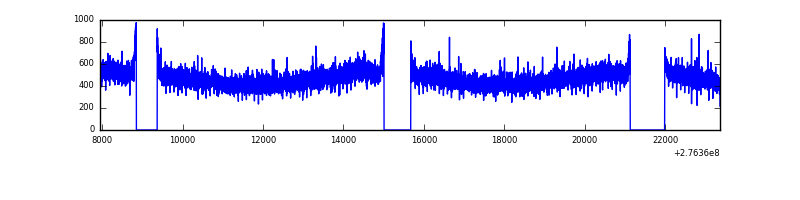 |
| D | 15420 | 13378 | 92 | 92 | 0.60% | 0.69% | 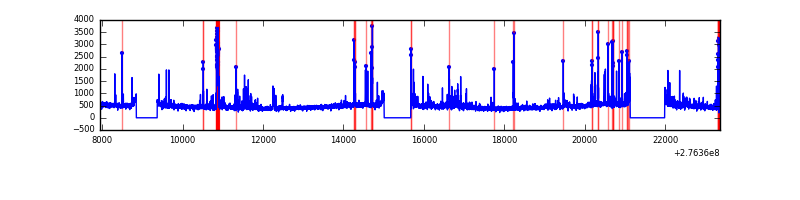 |
Top three noisy pixels from each quadrant. If the there are fewer than three noisy pixels in the level2.evt file, extra rows are filled as -1
| Pixel properties | Quadrant properties | ||||||
|---|---|---|---|---|---|---|---|
| Quadrant | DetID | PixID | Counts | Sigma | Mean | Median | Sigma |
| A | 15 | 174 | 57907 | 177.98 | 1572 | 1537 | 316.7 |
| A | 0 | 226 | 13851 | 38.88 | 1572 | 1537 | 316.7 |
| A | 12 | 194 | 11603 | 31.78 | 1572 | 1537 | 316.7 |
| B | 3 | 112 | 2347696 | 7970.48 | 1544 | 1501 | 294.4 |
| B | 4 | 173 | 101946 | 341.23 | 1544 | 1501 | 294.4 |
| B | 0 | 189 | 97239 | 325.24 | 1544 | 1501 | 294.4 |
| C | 14 | 238 | 237256 | 668.74 | 1522 | 1532 | 352.5 |
| C | 3 | 233 | 31317 | 84.5 | 1522 | 1532 | 352.5 |
| C | 0 | 207 | 24518 | 65.21 | 1522 | 1532 | 352.5 |
| D | 2 | 122 | 328899 | 888.81 | 1534 | 1492 | 368.4 |
| D | 12 | 110 | 327701 | 885.56 | 1534 | 1492 | 368.4 |
| D | 1 | 52 | 112555 | 301.5 | 1534 | 1492 | 368.4 |
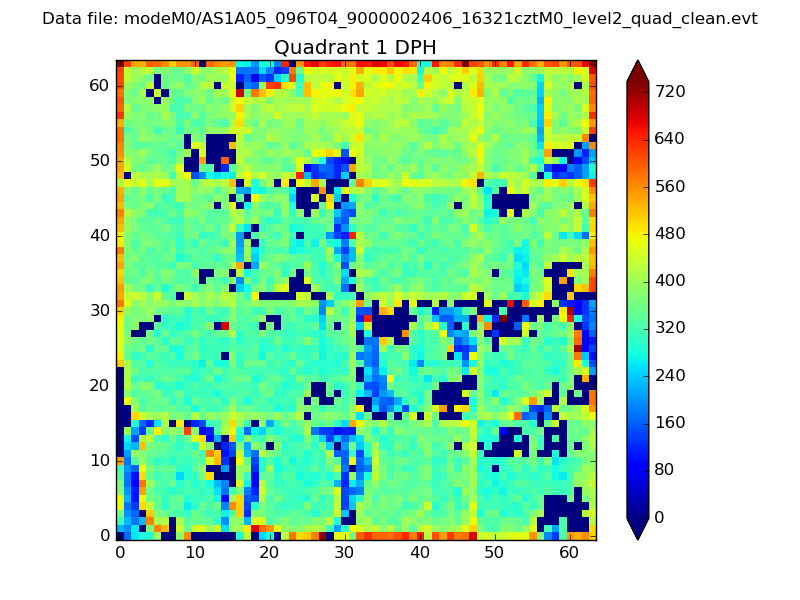
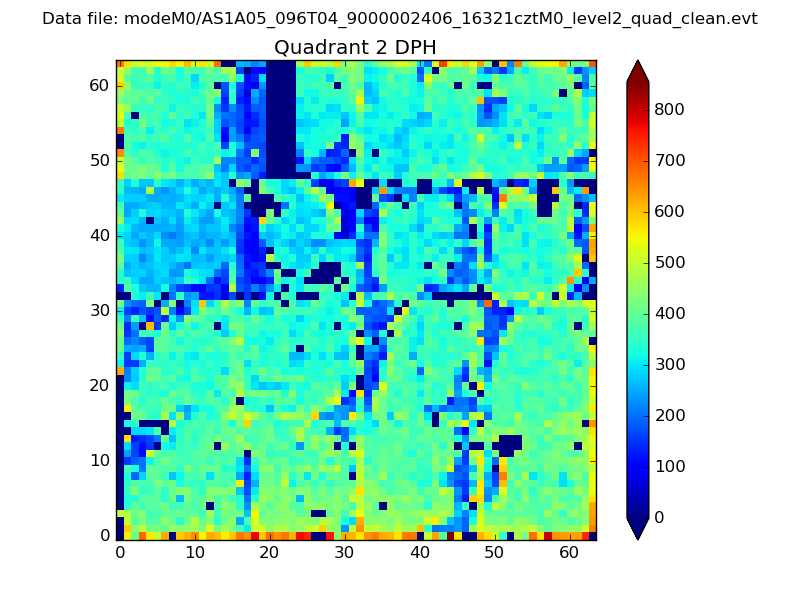
Histogram calculated using DETX and DETY for each event in the final _common_clean file
| Quadrant A |  |
 |
Quadrant B |
|---|---|---|---|
| Quadrant D | 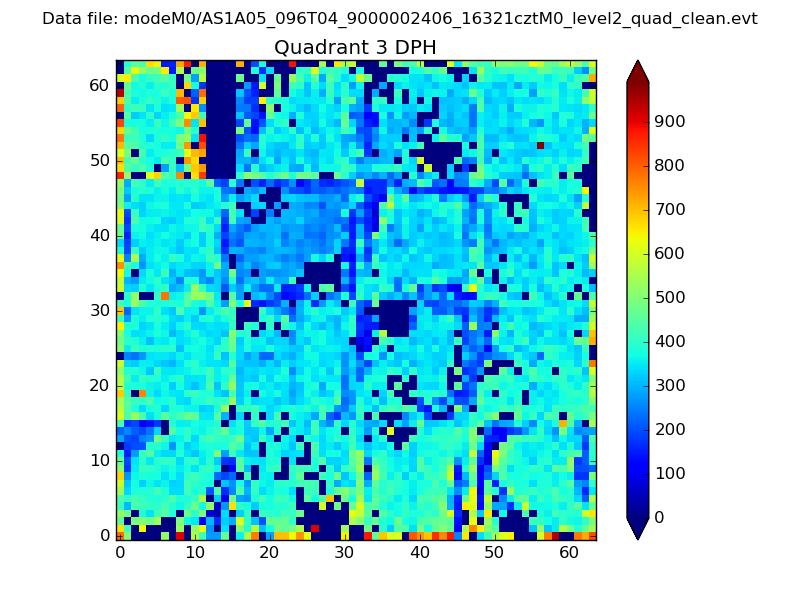 |
 |
Quadrant C |
| Plot type | Count rate plots | Images |
|---|---|---|
| Comparison with Poisson distribution Blue bars denote a histogram of data divided into 1 sec bins. Red curve is a Poisson curve with rate = median count rate of data. |
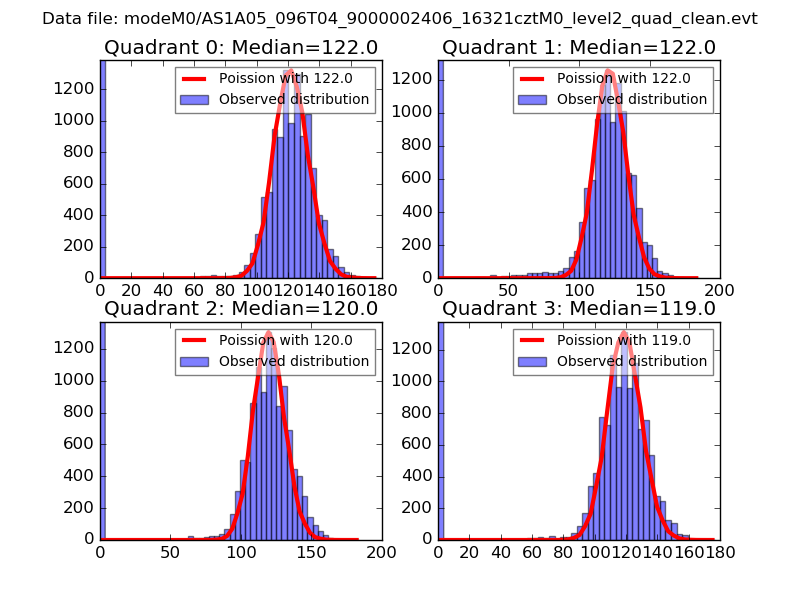 |
 |
| Quadrant-wise count rates Data is divided into 100 sec bins |
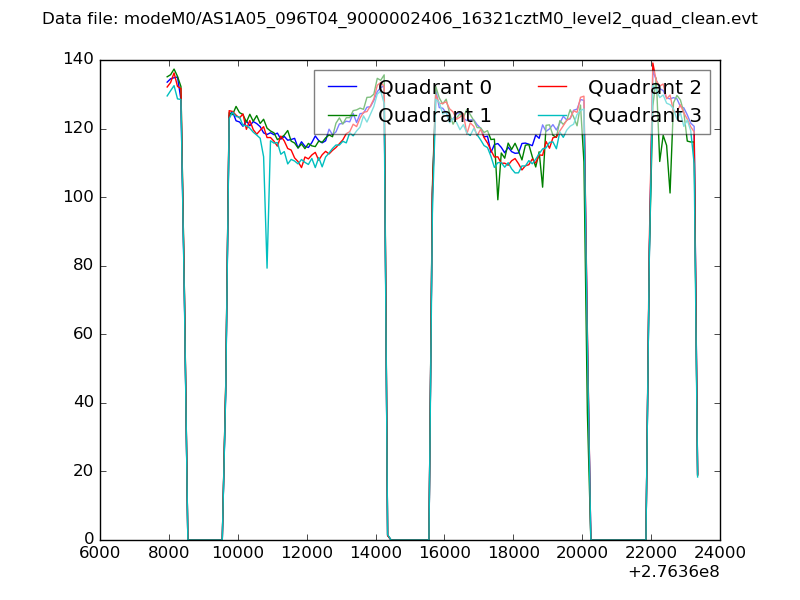 |
|
| Module-wise count rates for Quadrant A Data is divided into 100 sec bins |
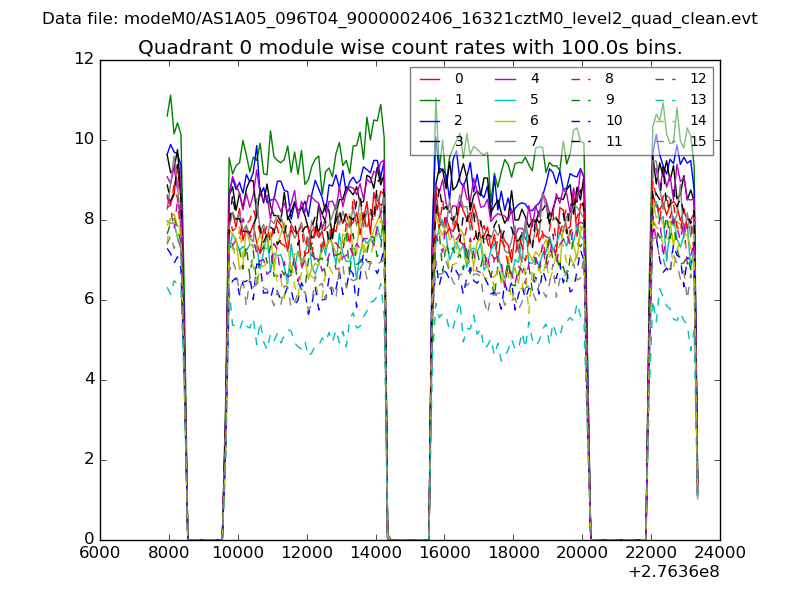 |
 |
| Module-wise count rates for Quadrant B Data is divided into 100 sec bins |
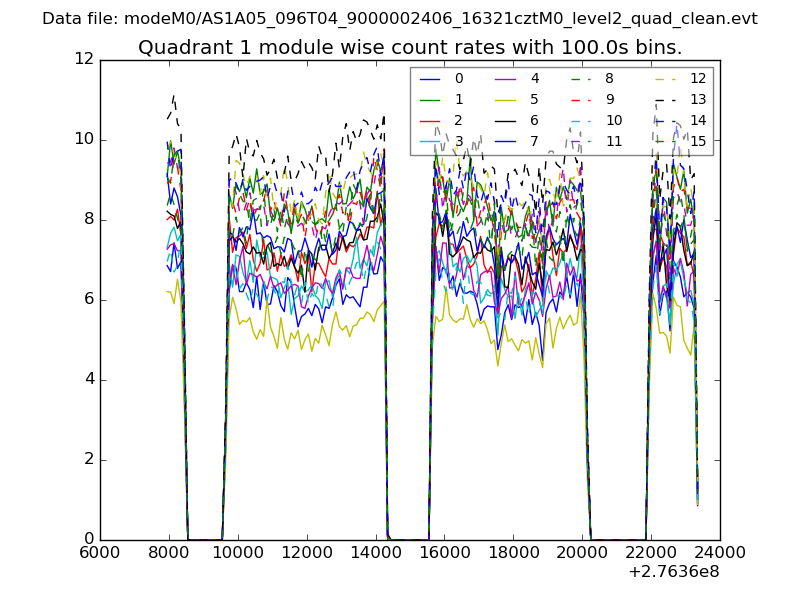 |
 |
| Module-wise count rates for Quadrant C Data is divided into 100 sec bins |
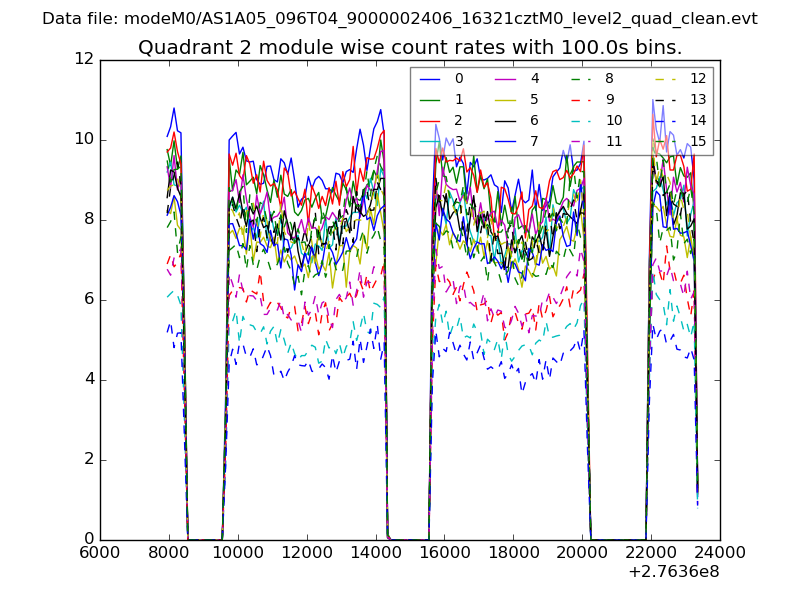 |
 |
| Module-wise count rates for Quadrant D Data is divided into 100 sec bins |
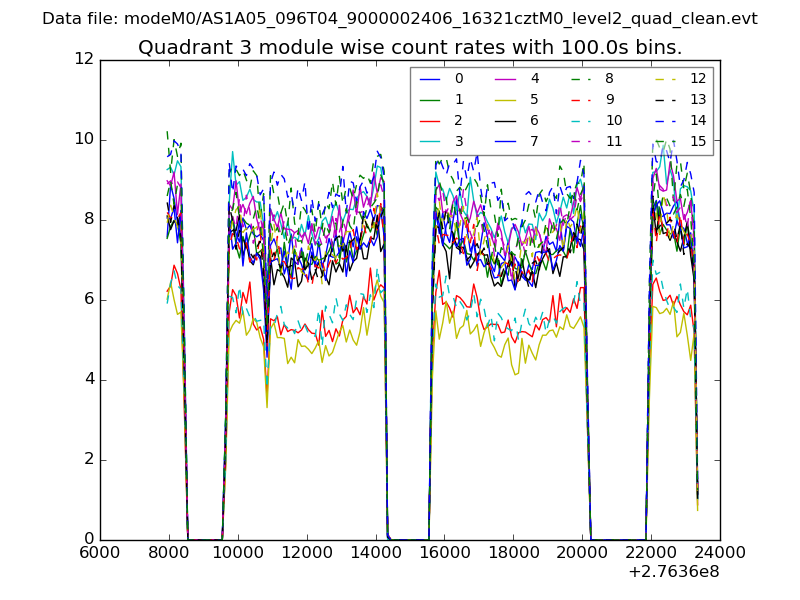 |
 |
| Parameter | Plot |
|---|---|
| CZT HV Monitor | 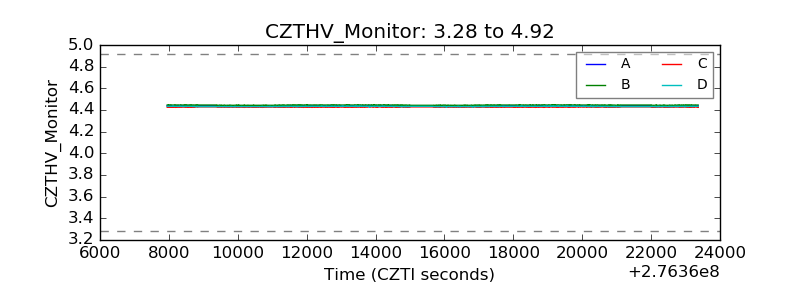 |
| D_VDD | 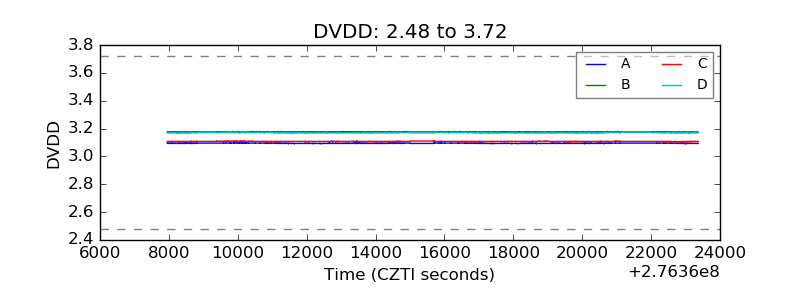 |
| Temperature 1 | 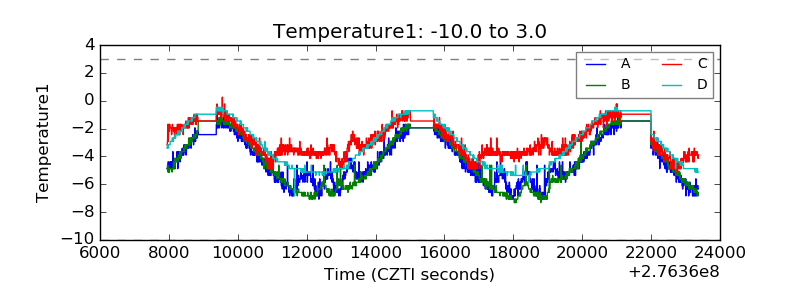 |
| Veto HV Monitor | 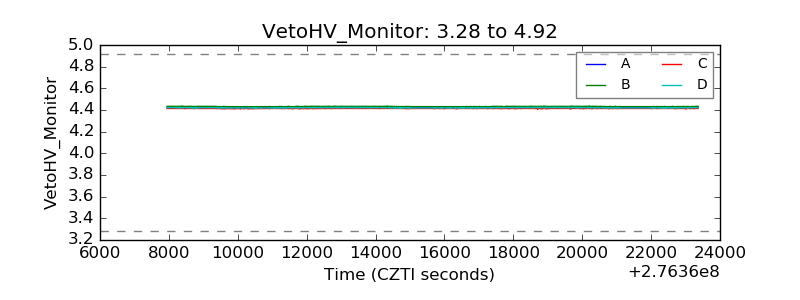 |
| Veto LLD |  |
| Alpha Counter | 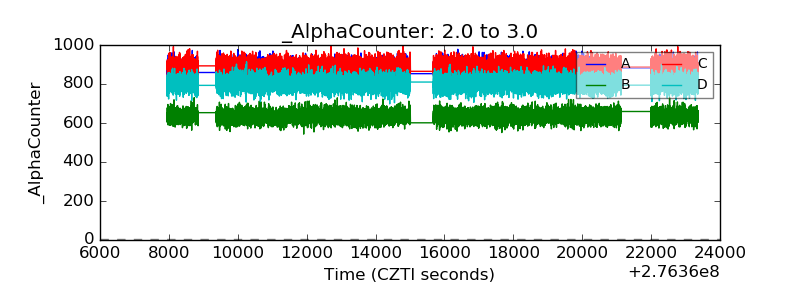 |
| _CPM_Rate | 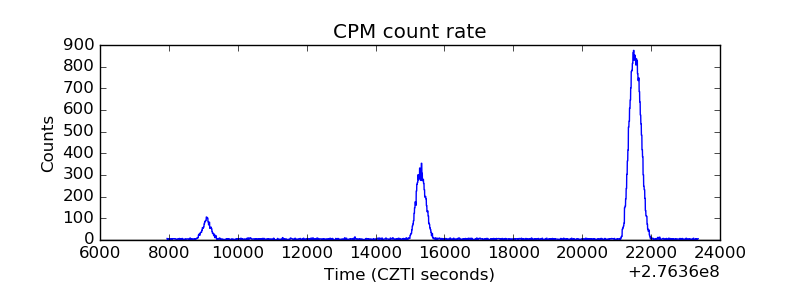 |
| CZT Counter | 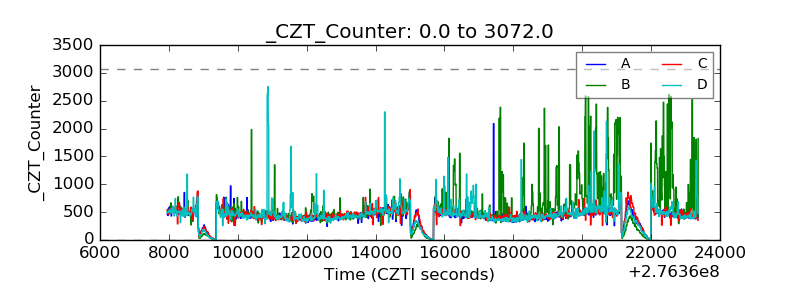 |
| +2.5 Volts monitor |  |
| +5 Volts monitor |  |
| _ROLL_ROT | 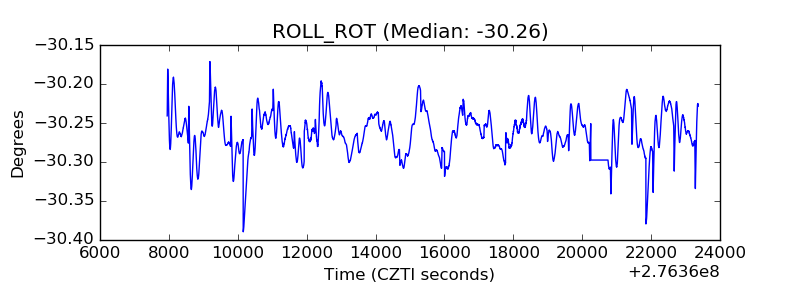 |
| _Roll_DEC | 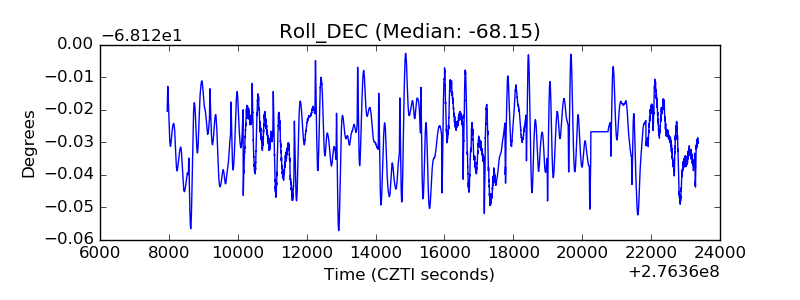 |
| _Roll_RA | 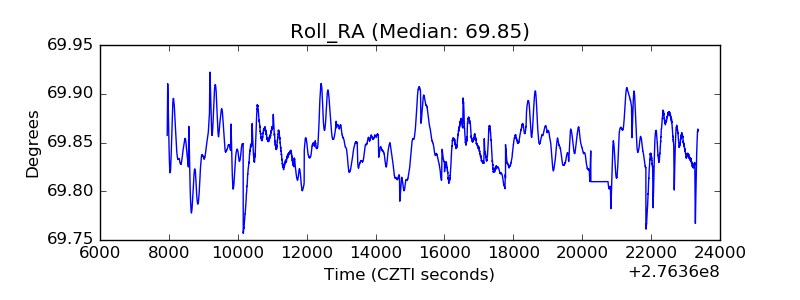 |
| Veto Counter | 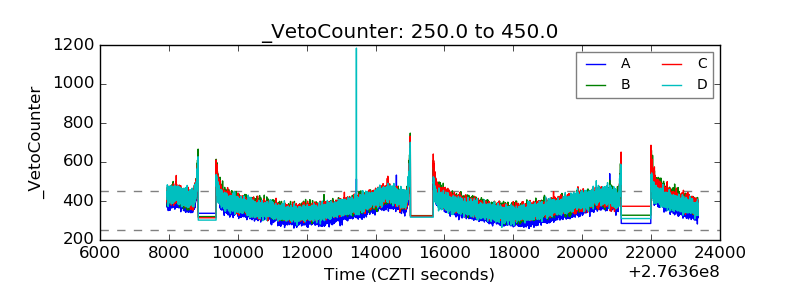 |