| Param | Original file | Final file |
|---|---|---|
| Filename | modeM0/AS1A05_096T04_9000002406_16322cztM0_level2.evt | modeM0/AS1A05_096T04_9000002406_16322cztM0_level2_quad_clean.evt |
| Size (bytes) | 509,431,680 | 105,672,960 |
| Size | 485.8 MB | 100.8 MB |
| Events in quadrant A | 3,081,595 | 694,821 |
| Events in quadrant B | 5,140,146 | 679,521 |
| Events in quadrant C | 3,212,481 | 686,537 |
| Events in quadrant D | 3,537,477 | 670,703 |
| Mode M0 | |||
|---|---|---|---|
| Quadrant | BADHDUFLAG | Total packets | Discarded packets |
| A | 0 | 13767 | 3 |
| B | 0 | 19943 | 2 |
| C | 0 | 13831 | 2 |
| D | 0 | 15298 | 2 |
| Mode SS | |||
|---|---|---|---|
| Quadrant | BADHDUFLAG | Total packets | Discarded packets |
| A | 0 | 134 | 0 |
| B | 0 | 134 | 0 |
| C | 0 | 134 | 0 |
| D | 0 | 134 | 0 |
| Mode M9 | |||
|---|---|---|---|
| Quadrant | BADHDUFLAG | Total packets | Discarded packets |
| A | 0 | 16 | 0 |
| B | 0 | 16 | 0 |
| C | 0 | 16 | 0 |
| D | 0 | 17 | 0 |
| Quadrant | Total seconds | Saturated seconds | Saturation percentage |
|---|---|---|---|
| A | 6731 | 17 | 0.252563% |
| B | 6731 | 654 | 9.716238% |
| C | 6731 | 34 | 0.505126% |
| D | 6731 | 143 | 2.124499% |
Noise dominated data is calculated using 1-second bins in cleaned event files. If a bin has >2000 counts, and if more than 50% of those come from <1% of pixels, then it is considered to be noise-dominated and hence unusable.
| Quadrant | # 1 sec bins | Bins with >0 counts | Bins with >2000 counts | High rate bins dominated by noise | Noise dominated (total time) | Noise dominated (detector-on time) | Marked lightcurve |
|---|---|---|---|---|---|---|---|
| A | 7787 | 6733 | 1 | 1 | 0.01% | 0.01% | 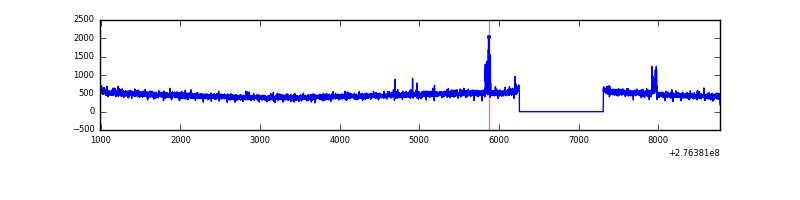 |
| B | 7787 | 6733 | 385 | 385 | 4.94% | 5.72% | 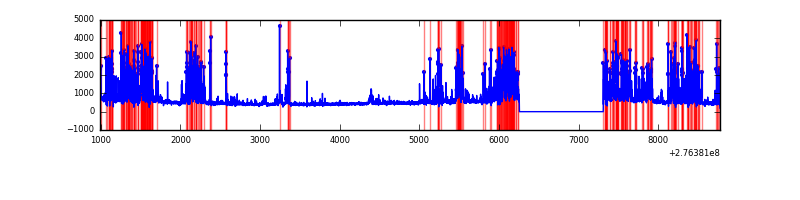 |
| C | 7787 | 6733 | 0 | 0 | 0.00% | 0.00% | 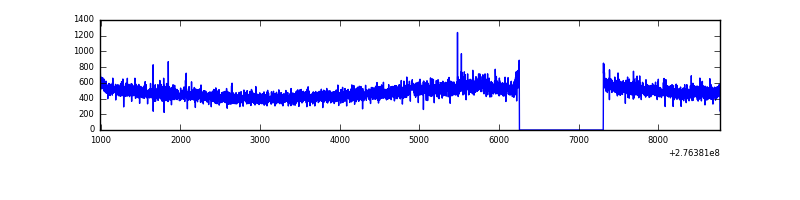 |
| D | 7787 | 6733 | 109 | 109 | 1.40% | 1.62% | 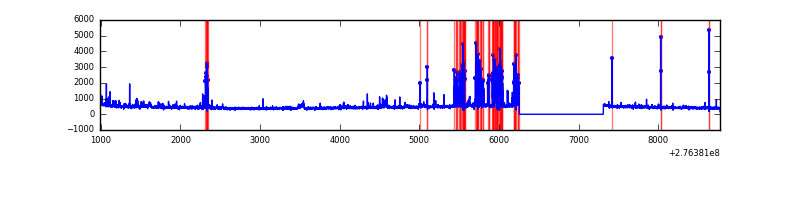 |
Top three noisy pixels from each quadrant. If the there are fewer than three noisy pixels in the level2.evt file, extra rows are filled as -1
| Pixel properties | Quadrant properties | ||||||
|---|---|---|---|---|---|---|---|
| Quadrant | DetID | PixID | Counts | Sigma | Mean | Median | Sigma |
| A | 15 | 174 | 45930 | 284.41 | 787 | 770 | 158.8 |
| A | 0 | 226 | 7086 | 39.78 | 787 | 770 | 158.8 |
| A | 12 | 194 | 5742 | 31.31 | 787 | 770 | 158.8 |
| B | 3 | 112 | 1916989 | 13076.61 | 769 | 749 | 146.5 |
| B | 0 | 189 | 53848 | 362.35 | 769 | 749 | 146.5 |
| B | 0 | 219 | 48917 | 328.7 | 769 | 749 | 146.5 |
| C | 14 | 238 | 119988 | 666.6 | 766 | 772 | 178.8 |
| C | 3 | 233 | 93048 | 515.96 | 766 | 772 | 178.8 |
| C | 0 | 207 | 9385 | 48.16 | 766 | 772 | 178.8 |
| D | 12 | 110 | 377579 | 2039.23 | 763 | 740 | 184.8 |
| D | 2 | 122 | 130923 | 704.47 | 763 | 740 | 184.8 |
| D | 13 | 168 | 45048 | 239.77 | 763 | 740 | 184.8 |
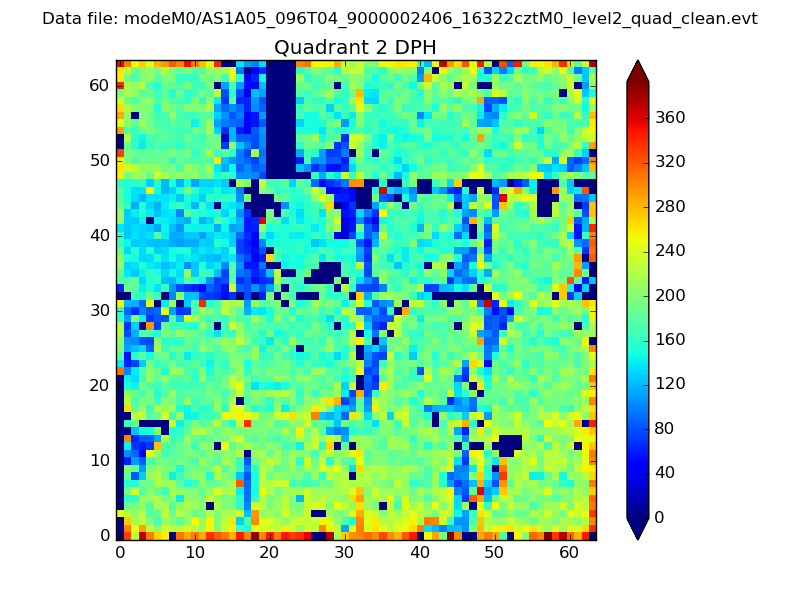
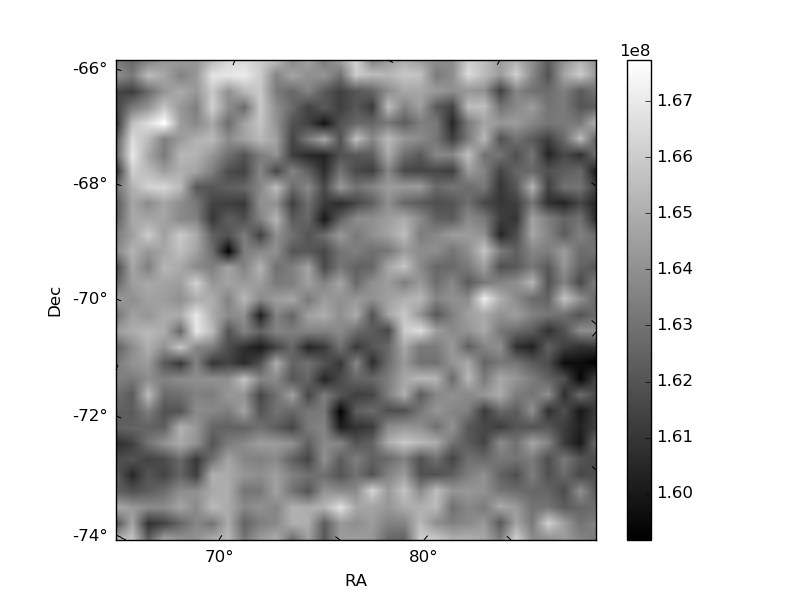
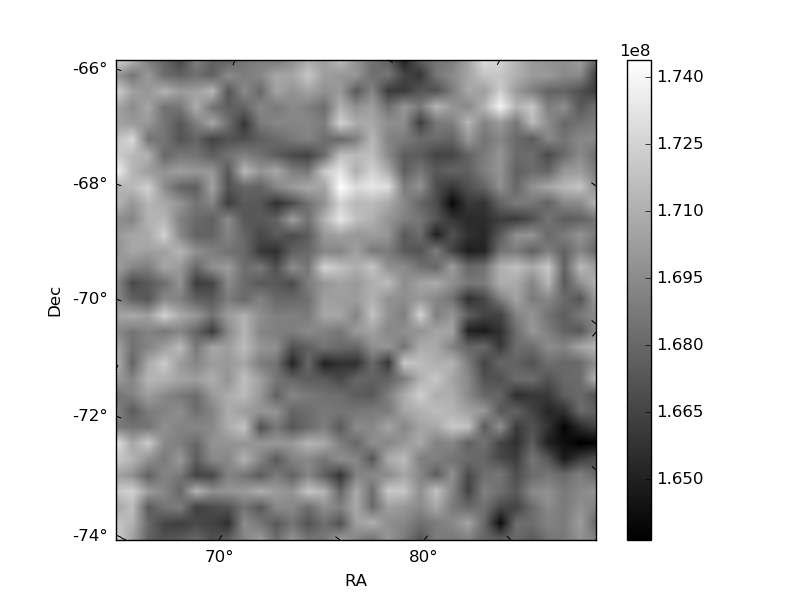
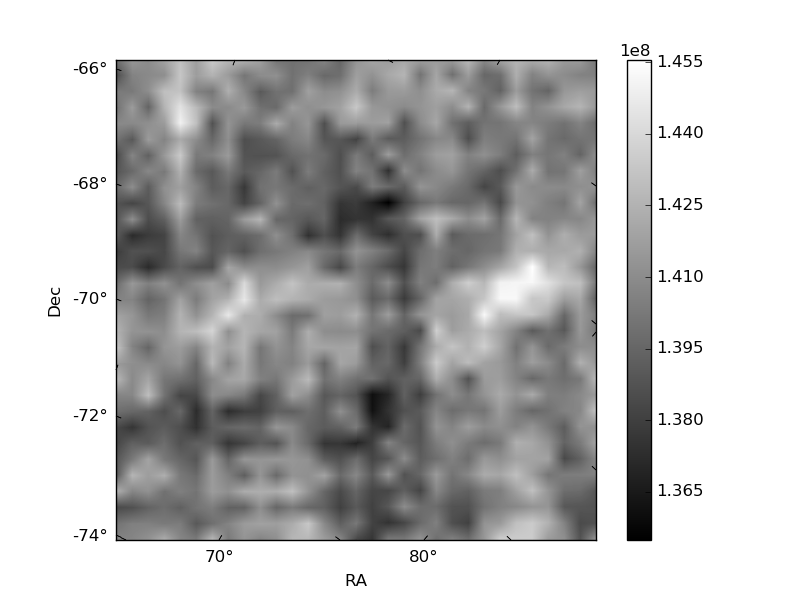
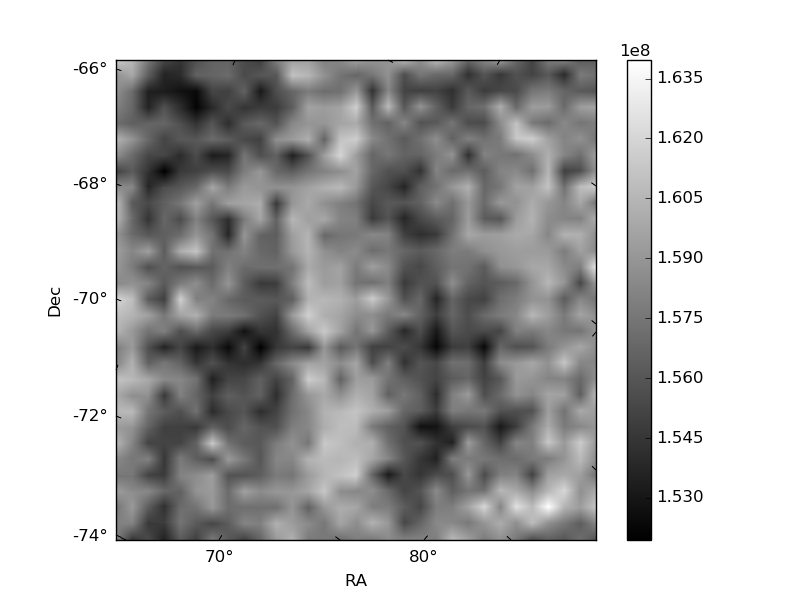
Histogram calculated using DETX and DETY for each event in the final _common_clean file
| Quadrant A | 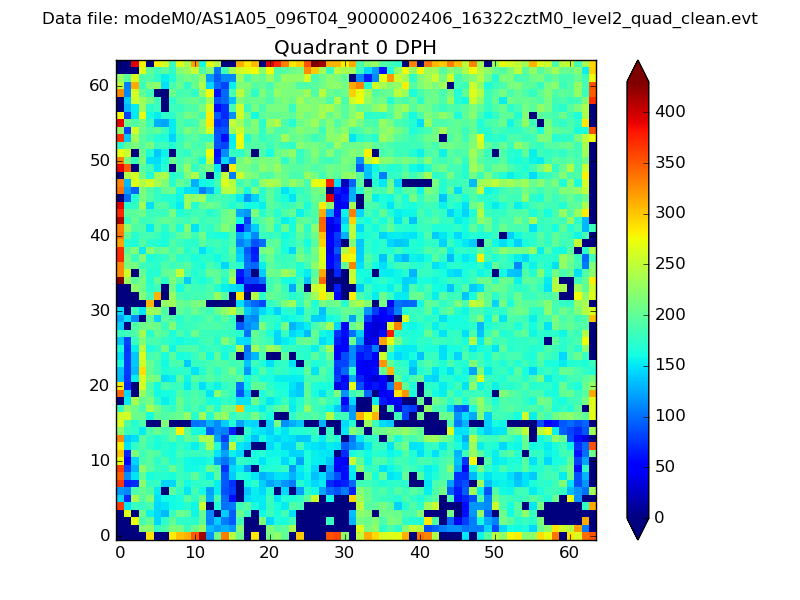 |
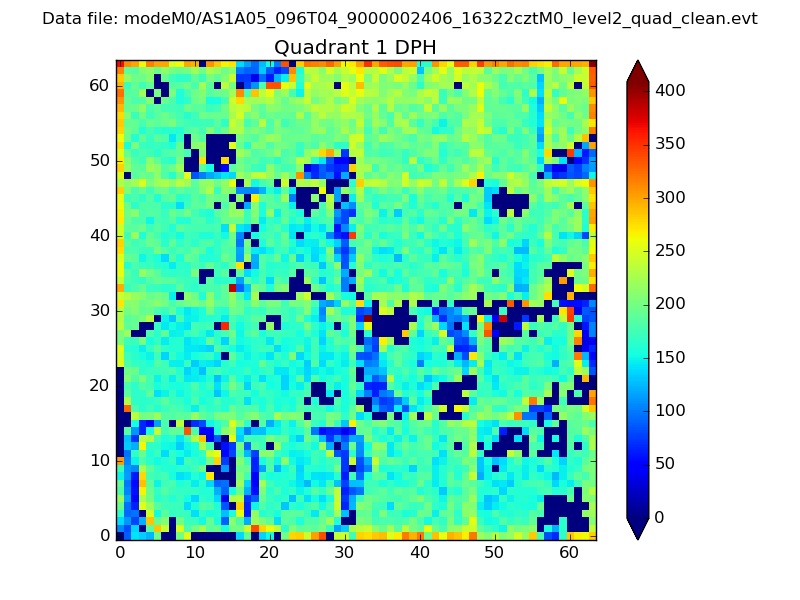 |
Quadrant B |
|---|---|---|---|
| Quadrant D | 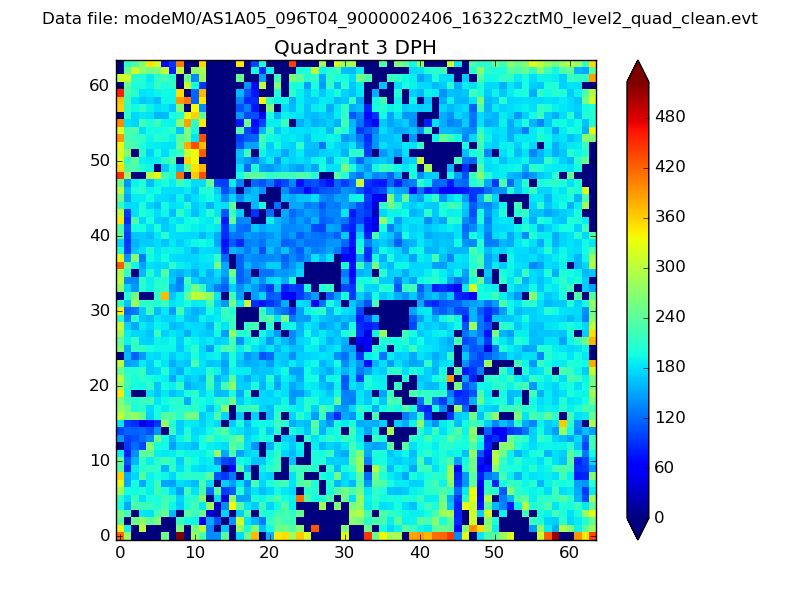 |
 |
Quadrant C |
| Plot type | Count rate plots | Images |
|---|---|---|
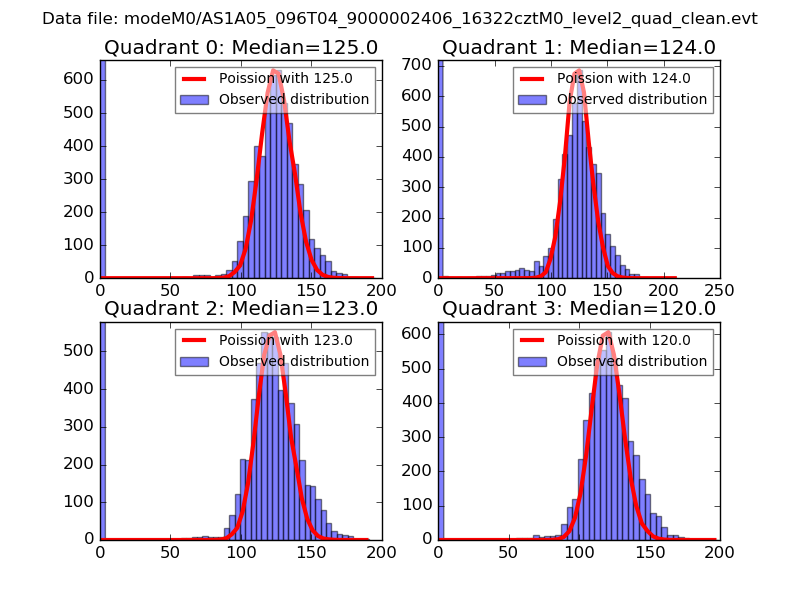
| Comparison with Poisson distribution Blue bars denote a histogram of data divided into 1 sec bins. Red curve is a Poisson curve with rate = median count rate of data. |
 |
 |
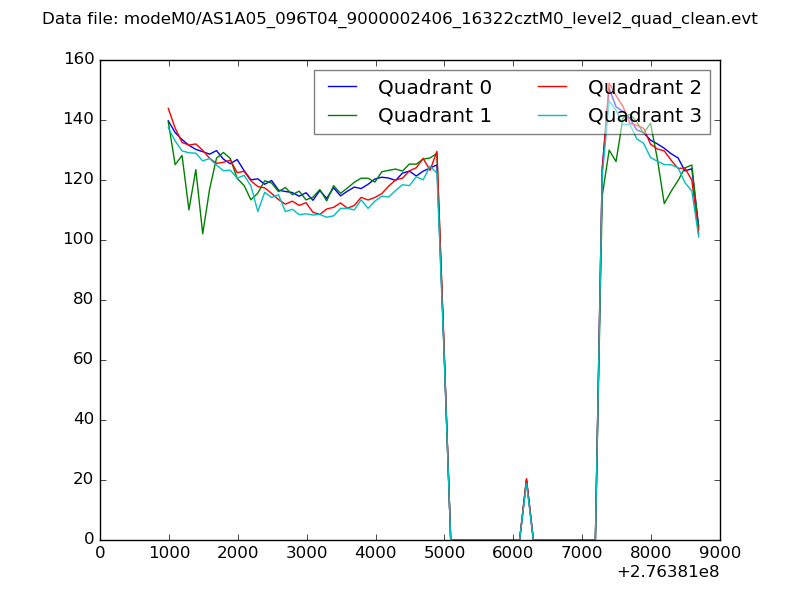
| Quadrant-wise count rates Data is divided into 100 sec bins |
 |
|
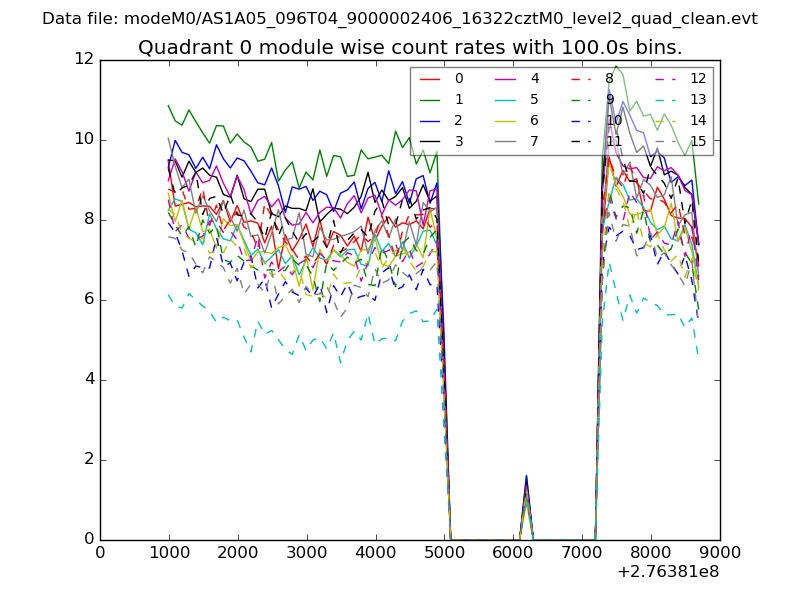
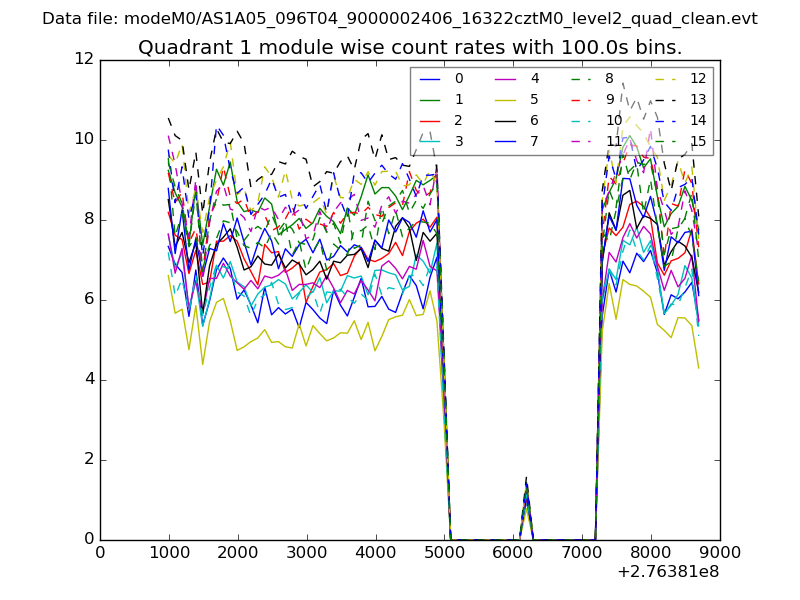
| Module-wise count rates for Quadrant A Data is divided into 100 sec bins |
 |
 |
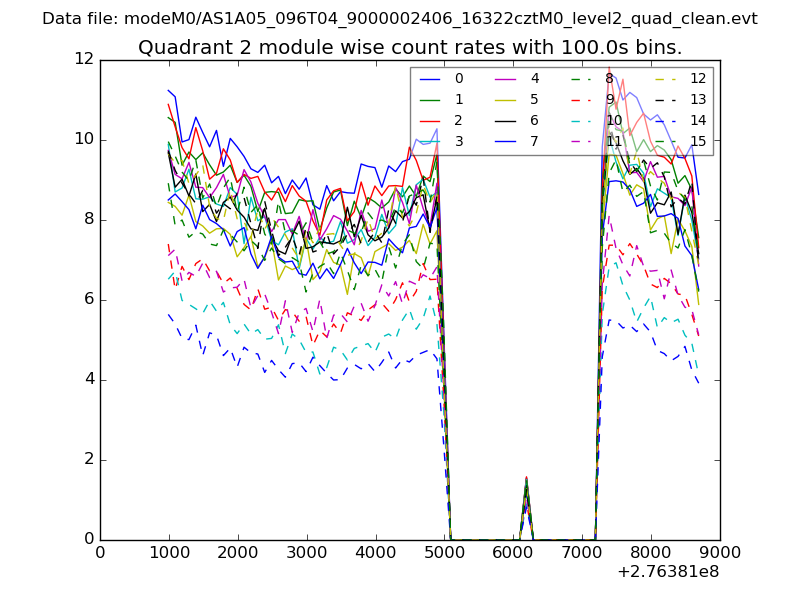
| Module-wise count rates for Quadrant B Data is divided into 100 sec bins |
 |
 |
| Module-wise count rates for Quadrant C Data is divided into 100 sec bins |
 |
 |
| Module-wise count rates for Quadrant D Data is divided into 100 sec bins |
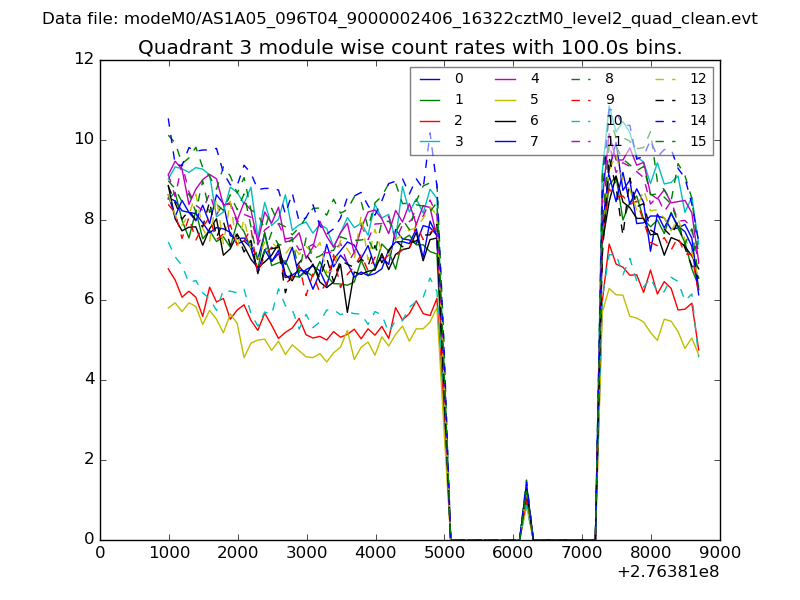 |
 |
| Parameter | Plot |
|---|---|
| CZT HV Monitor | 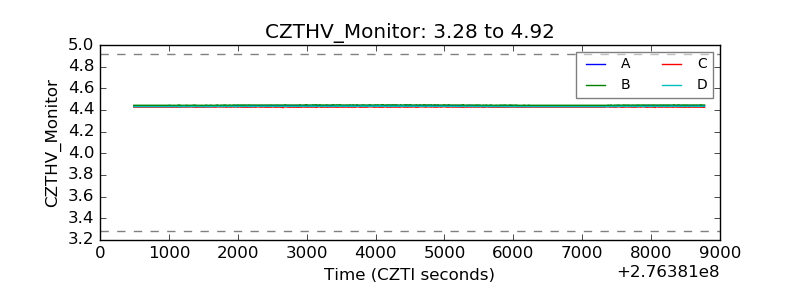 |
| D_VDD | 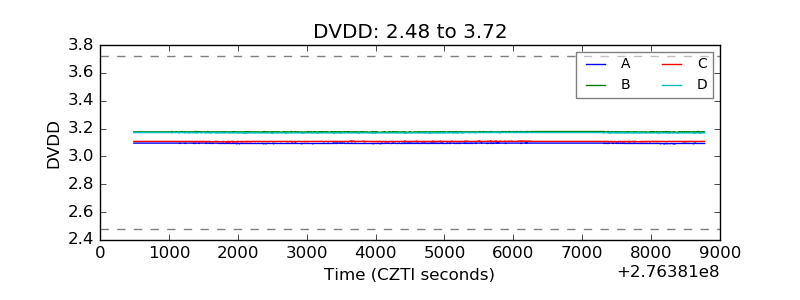 |
| Temperature 1 | 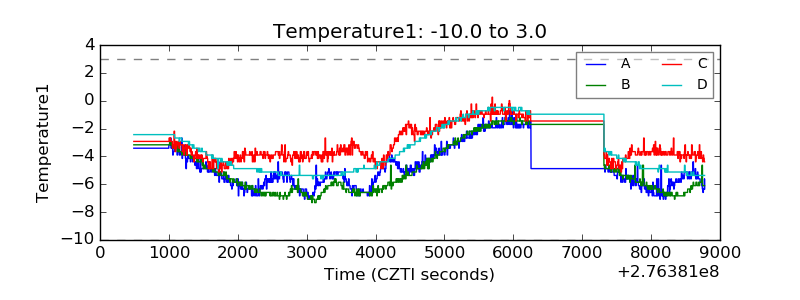 |
| Veto HV Monitor | 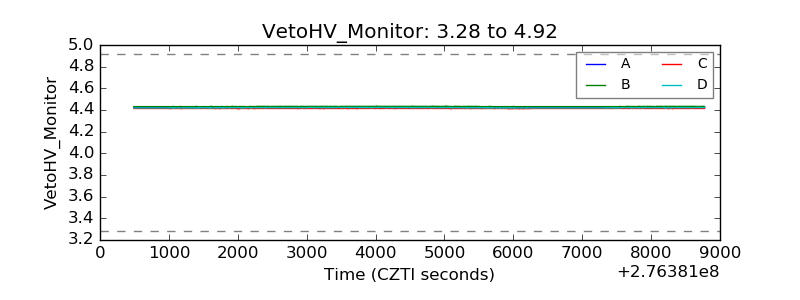 |
| Veto LLD | 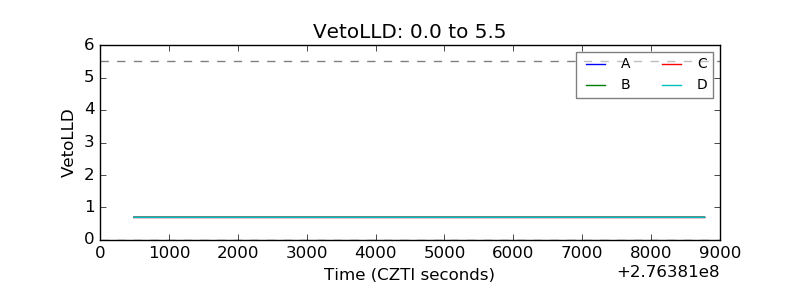 |
| Alpha Counter | 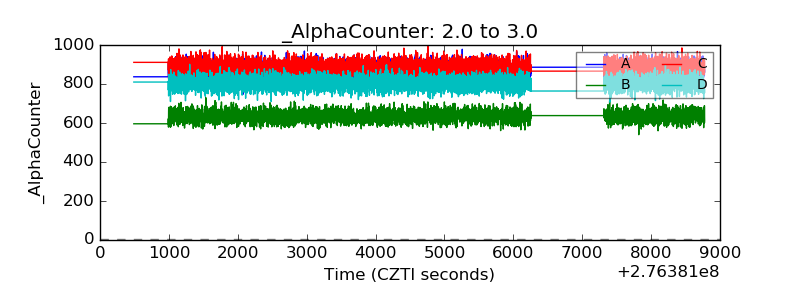 |
| _CPM_Rate | 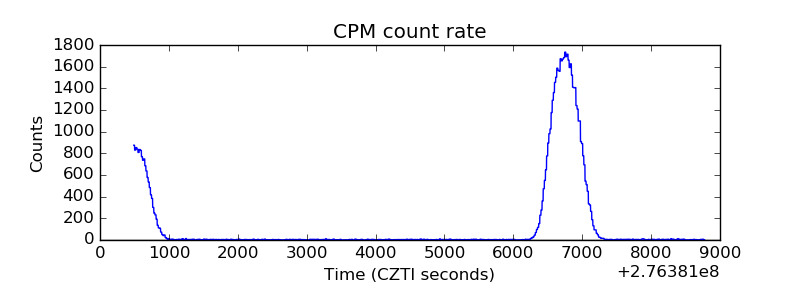 |
| CZT Counter | 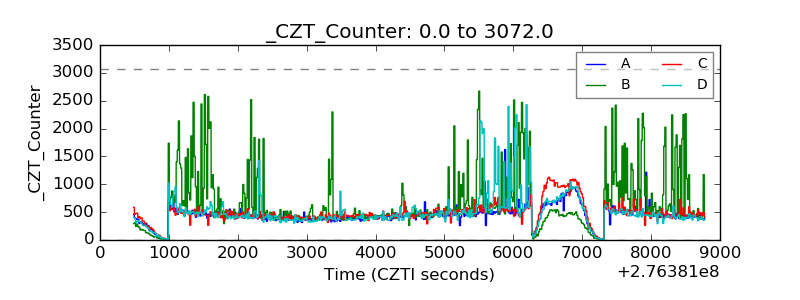 |
| +2.5 Volts monitor |  |
| +5 Volts monitor |  |
| _ROLL_ROT | 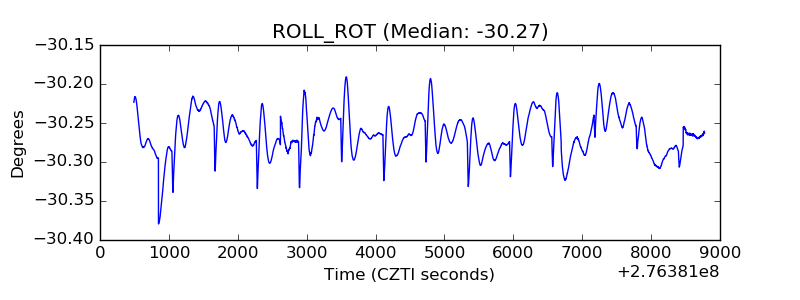 |
| _Roll_DEC | 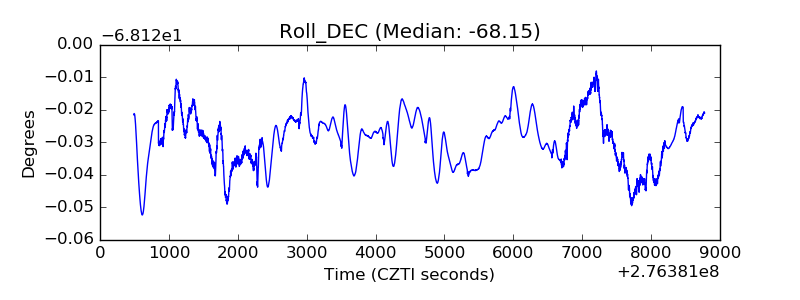 |
| _Roll_RA | 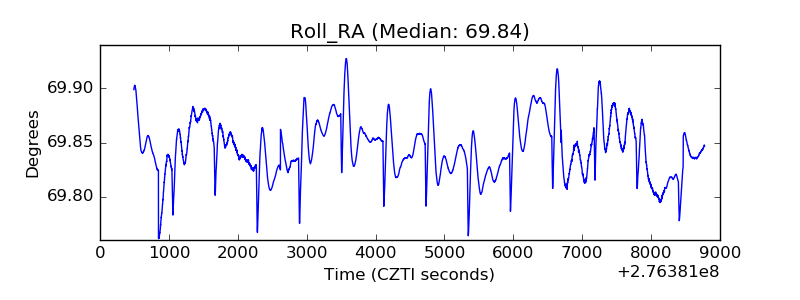 |
| Veto Counter | 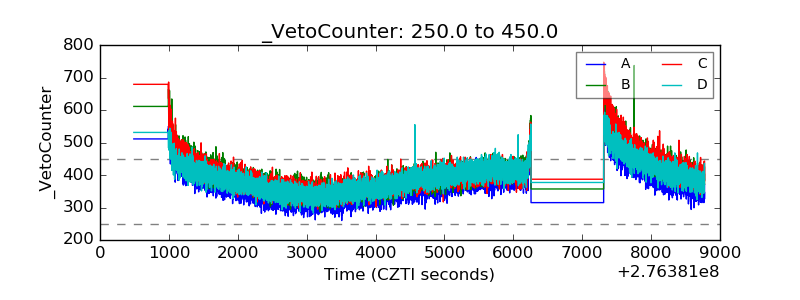 |