| Param | Original file | Final file |
|---|---|---|
| Filename | modeM0/AS1A05_096T04_9000002406_16325cztM0_level2.evt | modeM0/AS1A05_096T04_9000002406_16325cztM0_level2_quad_clean.evt |
| Size (bytes) | 541,920,960 | 111,643,200 |
| Size | 516.8 MB | 106.5 MB |
| Events in quadrant A | 3,129,999 | 747,969 |
| Events in quadrant B | 5,101,020 | 723,592 |
| Events in quadrant C | 3,281,935 | 753,332 |
| Events in quadrant D | 4,463,117 | 707,704 |
| Mode M0 | |||
|---|---|---|---|
| Quadrant | BADHDUFLAG | Total packets | Discarded packets |
| A | 0 | 13410 | 3 |
| B | 0 | 19663 | 2 |
| C | 0 | 13639 | 2 |
| D | 0 | 17470 | 2 |
| Mode SS | |||
|---|---|---|---|
| Quadrant | BADHDUFLAG | Total packets | Discarded packets |
| A | 0 | 130 | 0 |
| B | 0 | 130 | 0 |
| C | 0 | 130 | 0 |
| D | 0 | 130 | 0 |
| Mode M9 | |||
|---|---|---|---|
| Quadrant | BADHDUFLAG | Total packets | Discarded packets |
| A | 0 | 23 | 0 |
| B | 0 | 23 | 0 |
| C | 0 | 23 | 0 |
| D | 0 | 23 | 0 |
| Quadrant | Total seconds | Saturated seconds | Saturation percentage |
|---|---|---|---|
| A | 6431 | 9 | 0.139947% |
| B | 6431 | 662 | 10.293889% |
| C | 6431 | 60 | 0.932981% |
| D | 6431 | 320 | 4.975898% |
Noise dominated data is calculated using 1-second bins in cleaned event files. If a bin has >2000 counts, and if more than 50% of those come from <1% of pixels, then it is considered to be noise-dominated and hence unusable.
| Quadrant | # 1 sec bins | Bins with >0 counts | Bins with >2000 counts | High rate bins dominated by noise | Noise dominated (total time) | Noise dominated (detector-on time) | Marked lightcurve |
|---|---|---|---|---|---|---|---|
| A | 7697 | 6433 | 0 | 0 | 0.00% | 0.00% | 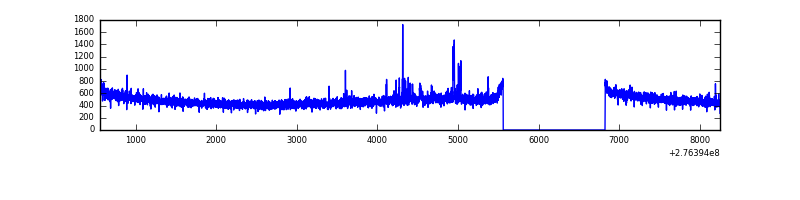 |
| B | 7697 | 6433 | 466 | 466 | 6.05% | 7.24% | 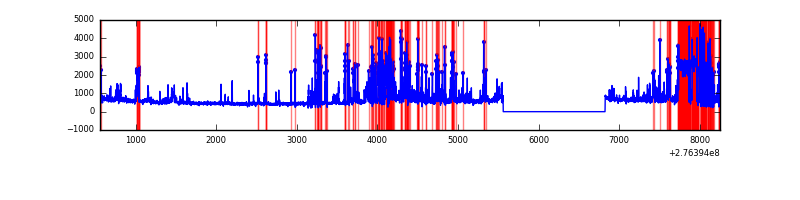 |
| C | 7697 | 6433 | 0 | 0 | 0.00% | 0.00% | 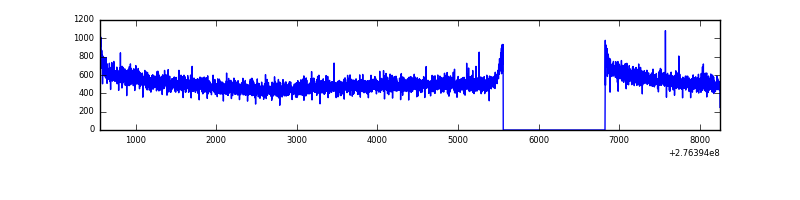 |
| D | 7697 | 6433 | 223 | 223 | 2.90% | 3.47% | 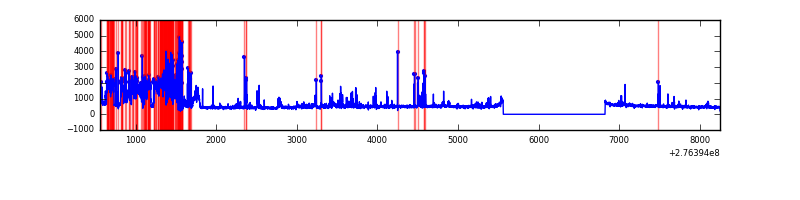 |
Top three noisy pixels from each quadrant. If the there are fewer than three noisy pixels in the level2.evt file, extra rows are filled as -1
| Pixel properties | Quadrant properties | ||||||
|---|---|---|---|---|---|---|---|
| Quadrant | DetID | PixID | Counts | Sigma | Mean | Median | Sigma |
| A | 15 | 174 | 47160 | 292.18 | 799 | 782 | 158.7 |
| A | 0 | 226 | 6962 | 38.93 | 799 | 782 | 158.7 |
| A | 13 | 210 | 6117 | 33.61 | 799 | 782 | 158.7 |
| B | 3 | 112 | 1882447 | 13356.06 | 765 | 746 | 140.9 |
| B | 4 | 173 | 41395 | 288.52 | 765 | 746 | 140.9 |
| B | 0 | 189 | 37994 | 264.38 | 765 | 746 | 140.9 |
| C | 14 | 238 | 123708 | 666.91 | 798 | 805 | 184.3 |
| C | 3 | 233 | 37148 | 197.21 | 798 | 805 | 184.3 |
| C | 0 | 207 | 7452 | 36.07 | 798 | 805 | 184.3 |
| D | 2 | 14 | 976638 | 5219.36 | 783 | 761 | 187.0 |
| D | 12 | 110 | 364681 | 1946.38 | 783 | 761 | 187.0 |
| D | 2 | 122 | 70299 | 371.91 | 783 | 761 | 187.0 |
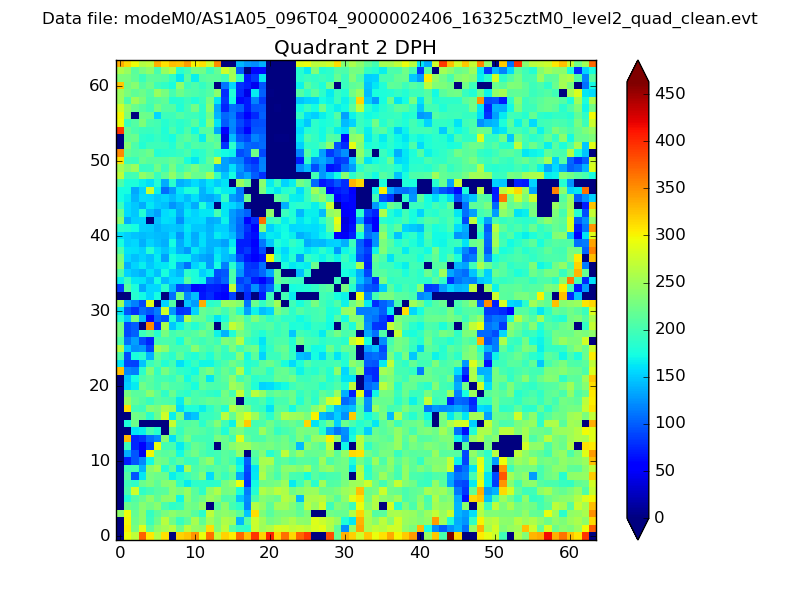
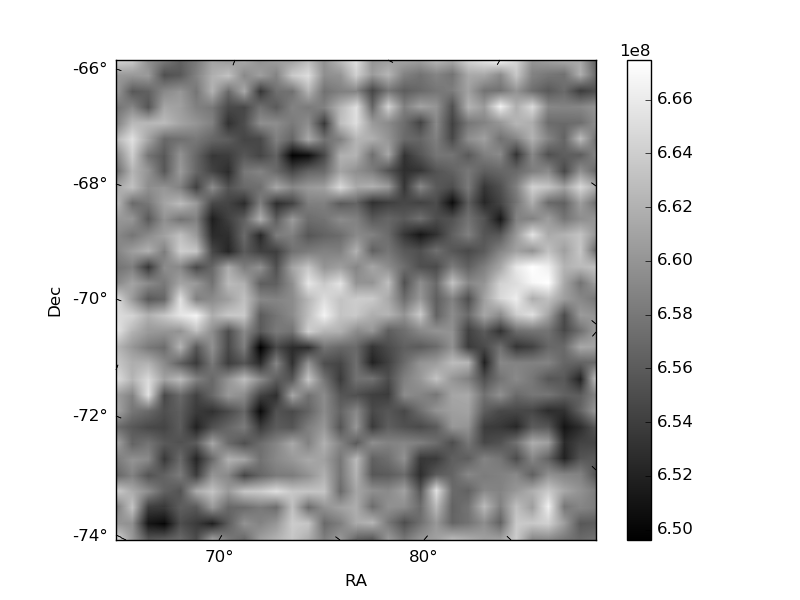
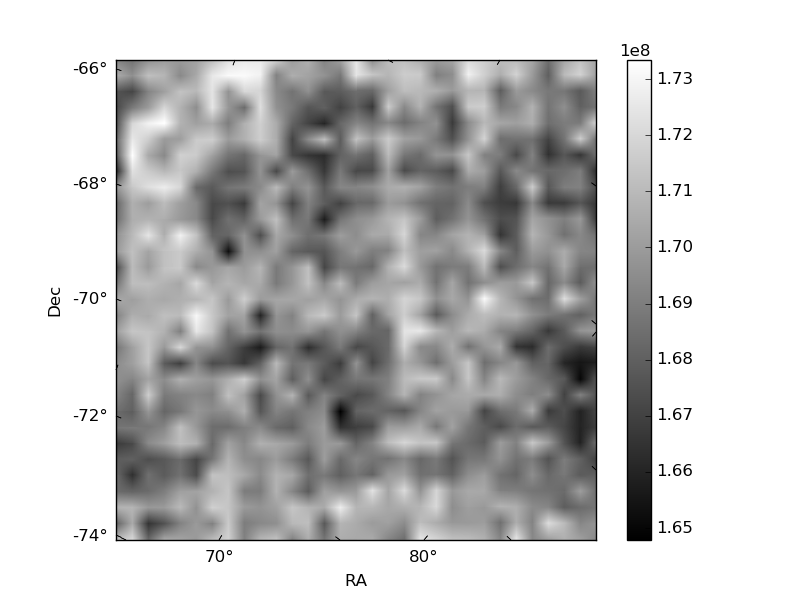
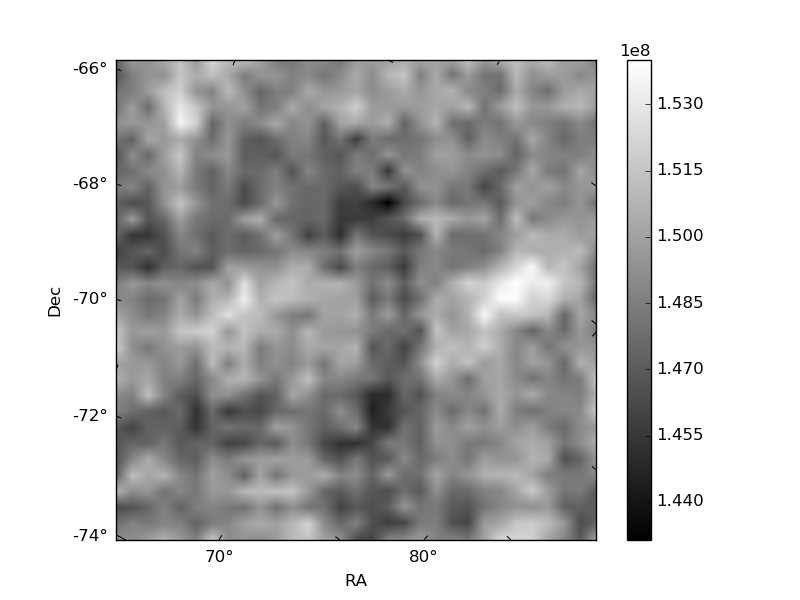
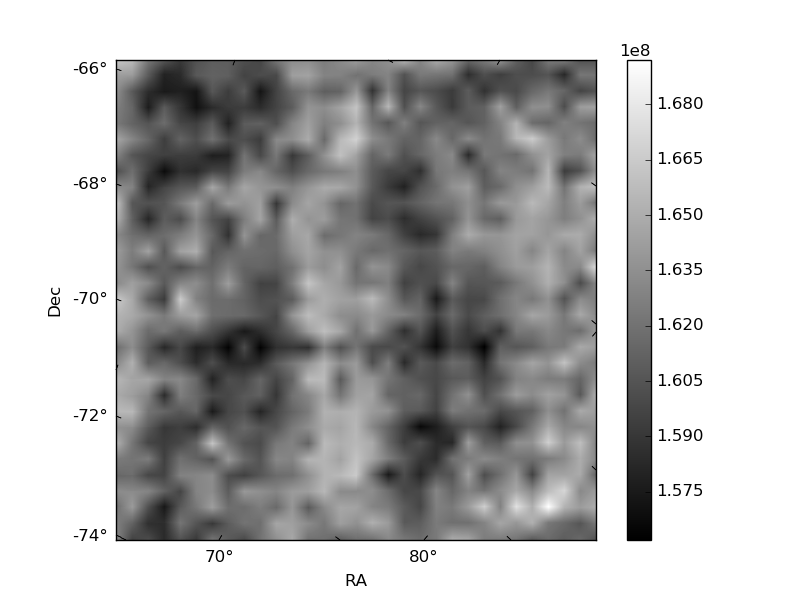
Histogram calculated using DETX and DETY for each event in the final _common_clean file
| Quadrant A | 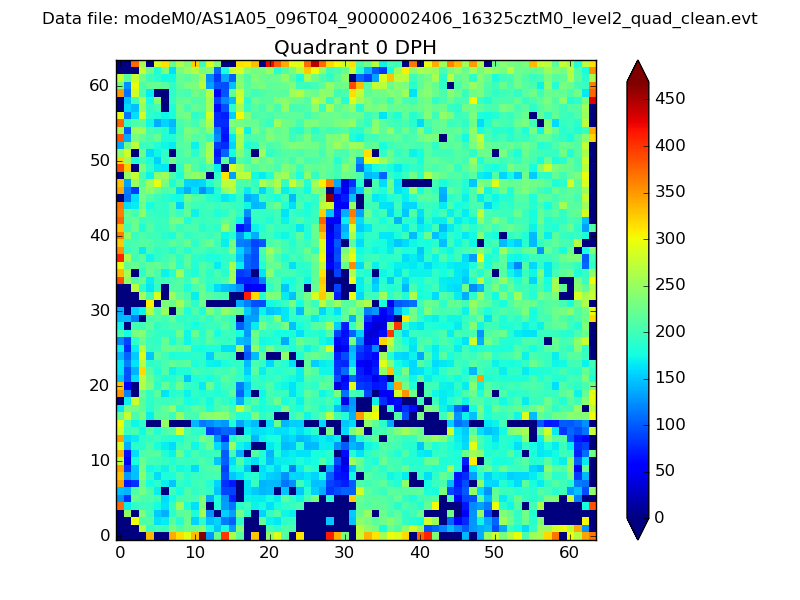 |
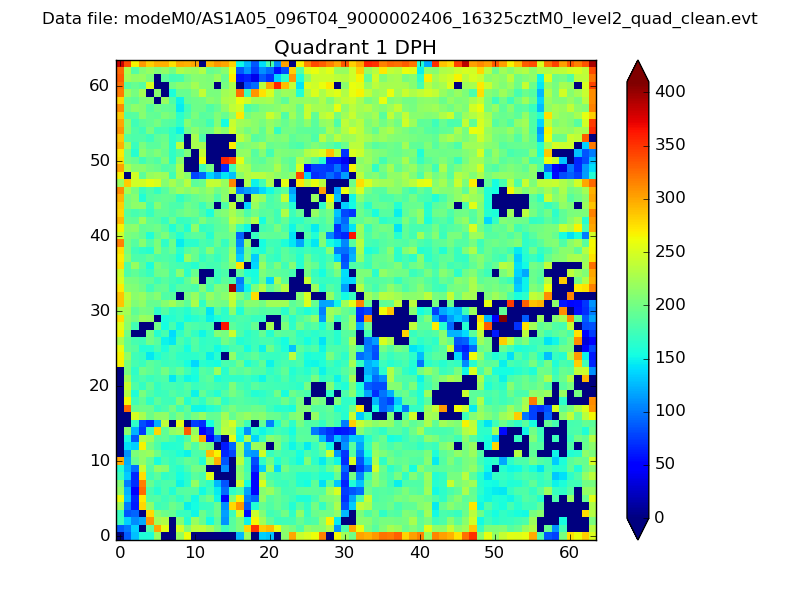 |
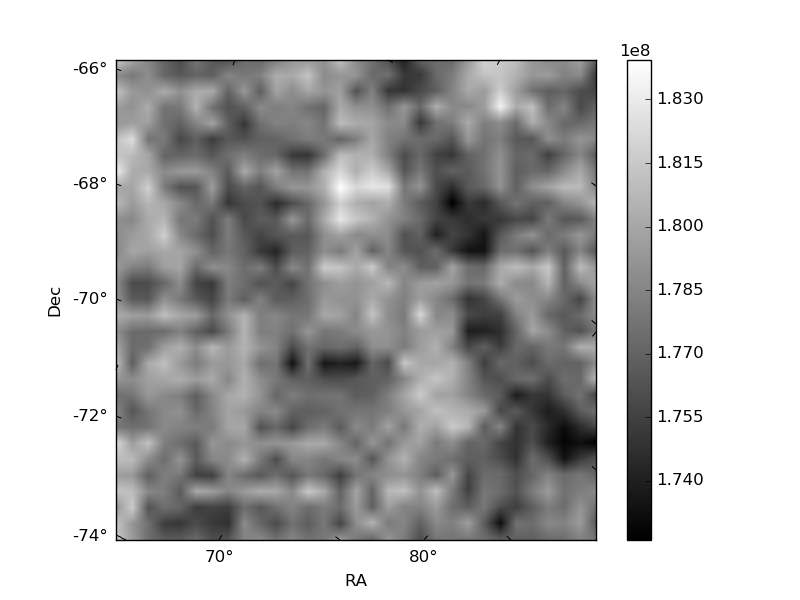
Quadrant B |
|---|---|---|---|
| Quadrant D | 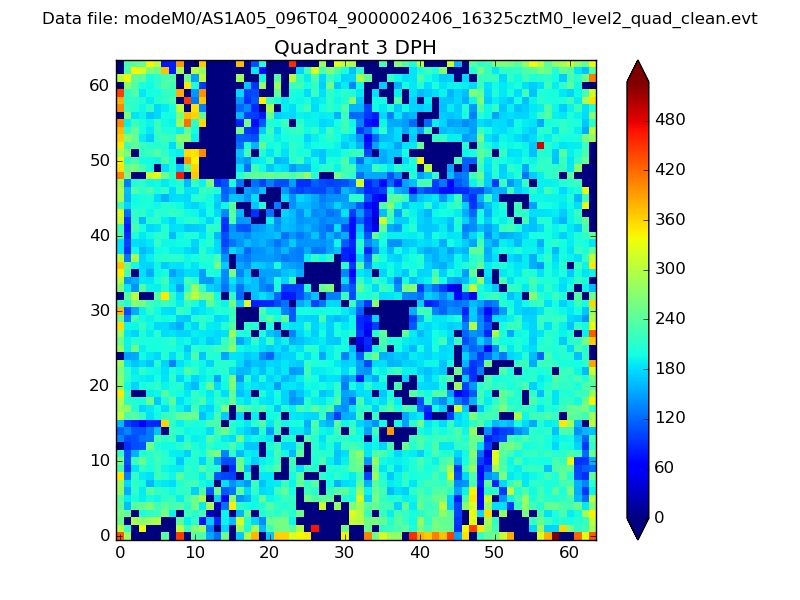 |
 |
Quadrant C |
| Plot type | Count rate plots | Images |
|---|---|---|
| Comparison with Poisson distribution Blue bars denote a histogram of data divided into 1 sec bins. Red curve is a Poisson curve with rate = median count rate of data. |
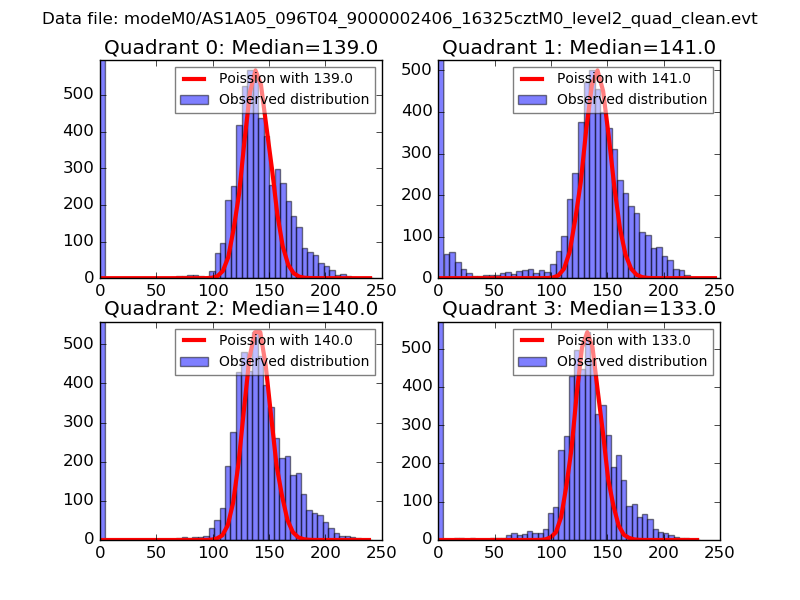 |
 |
| Quadrant-wise count rates Data is divided into 100 sec bins |
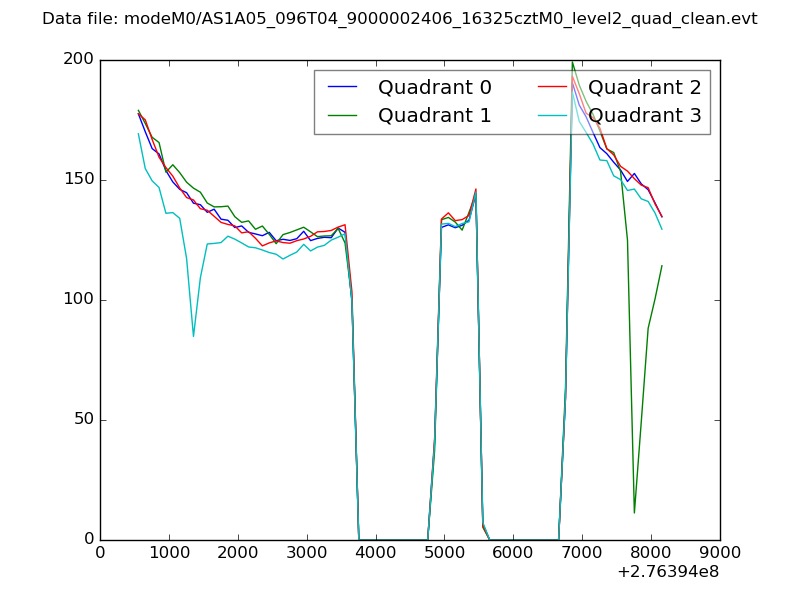 |
|
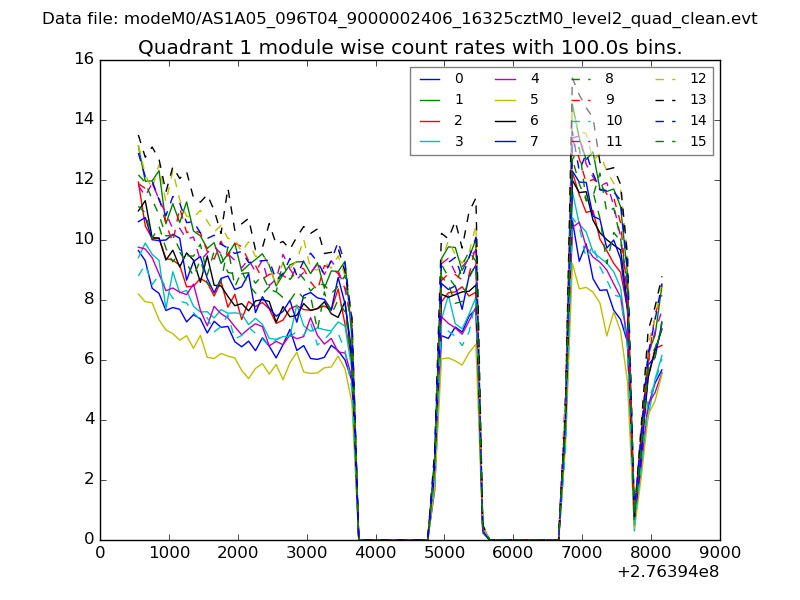
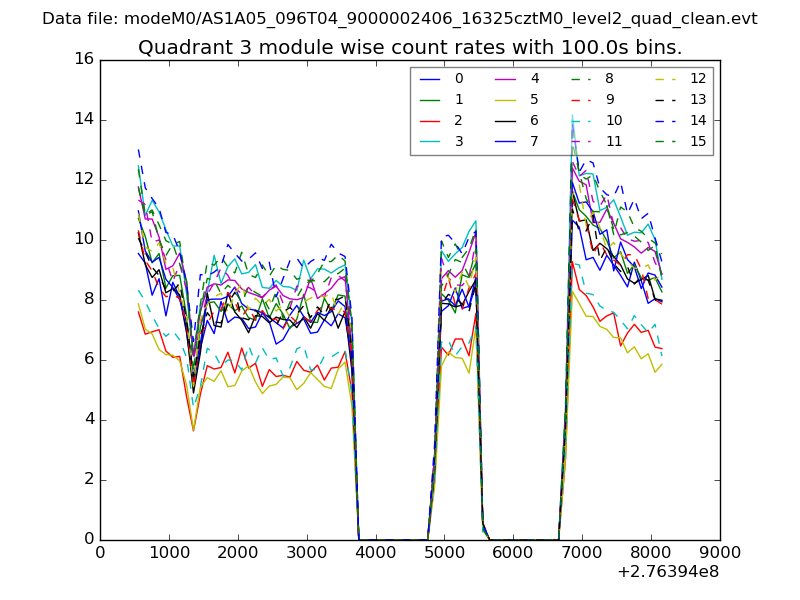
| Module-wise count rates for Quadrant A Data is divided into 100 sec bins |
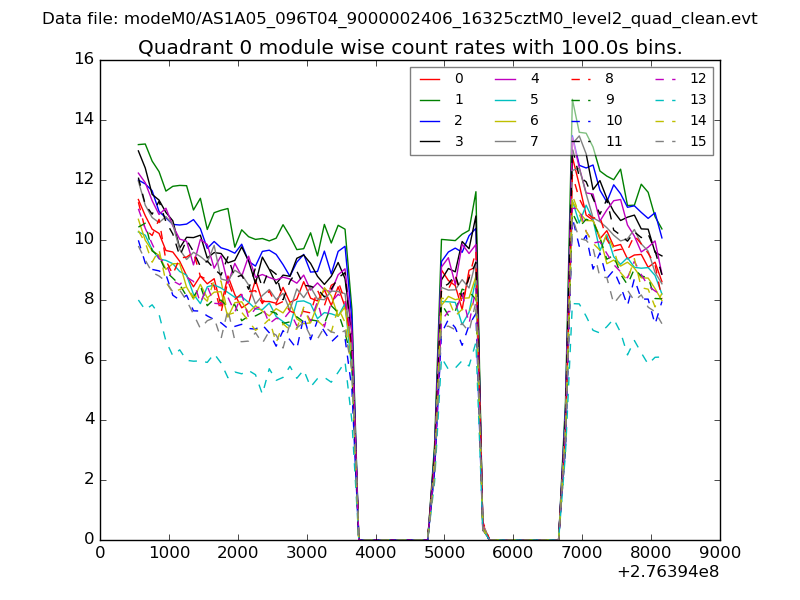 |
 |
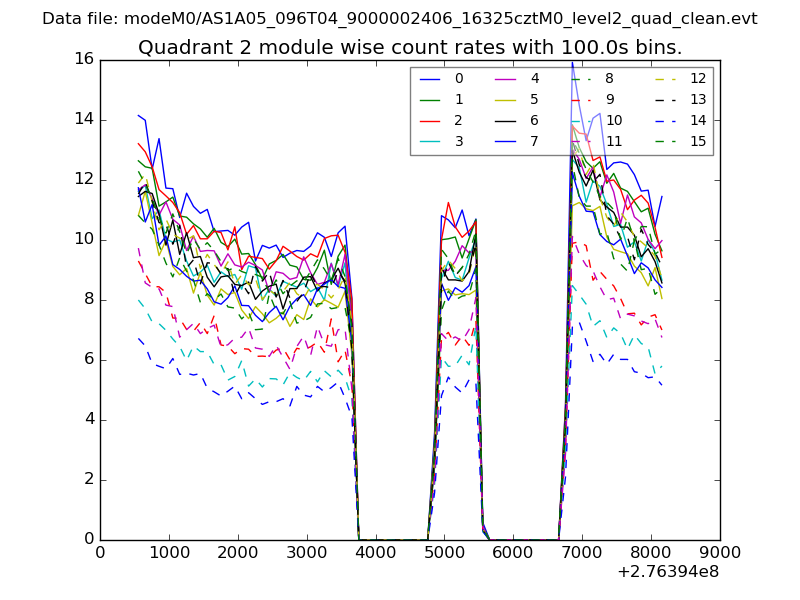
| Module-wise count rates for Quadrant B Data is divided into 100 sec bins |
 |
 |
| Module-wise count rates for Quadrant C Data is divided into 100 sec bins |
 |
 |
| Module-wise count rates for Quadrant D Data is divided into 100 sec bins |
 |
 |
| Parameter | Plot |
|---|---|
| CZT HV Monitor | 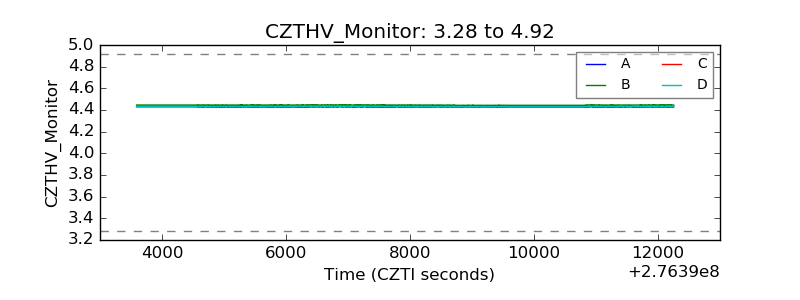 |
| D_VDD | 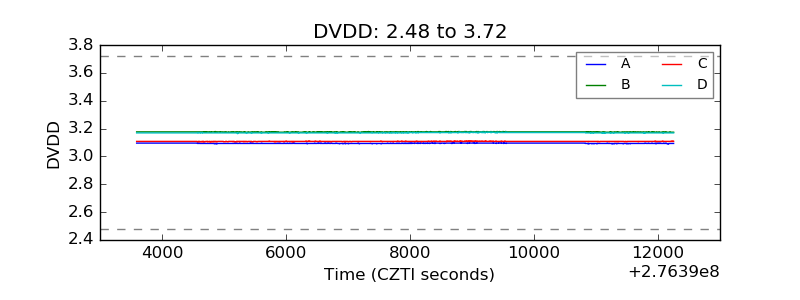 |
| Temperature 1 | 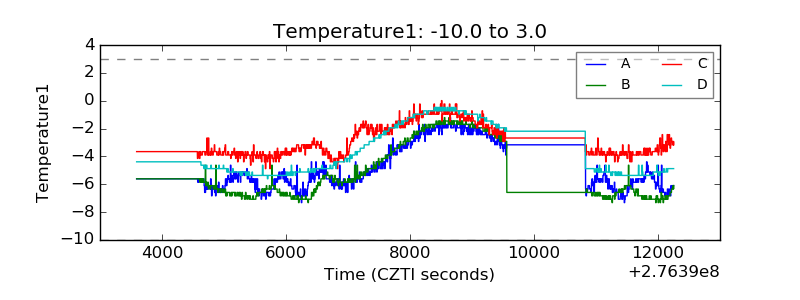 |
| Veto HV Monitor | 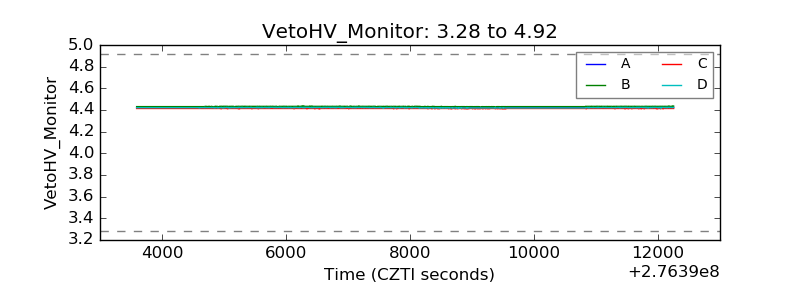 |
| Veto LLD | 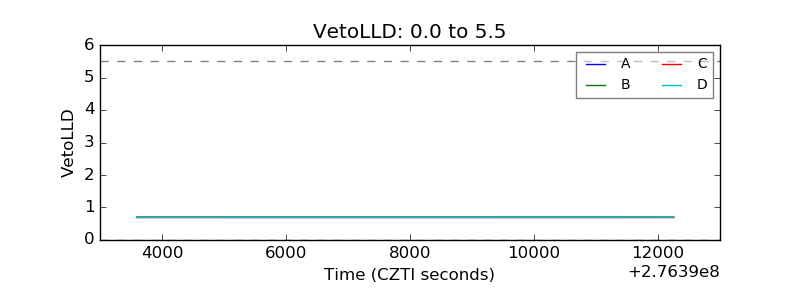 |
| Alpha Counter | 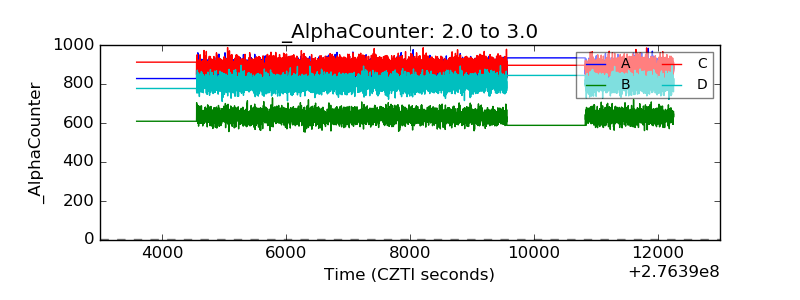 |
| _CPM_Rate | 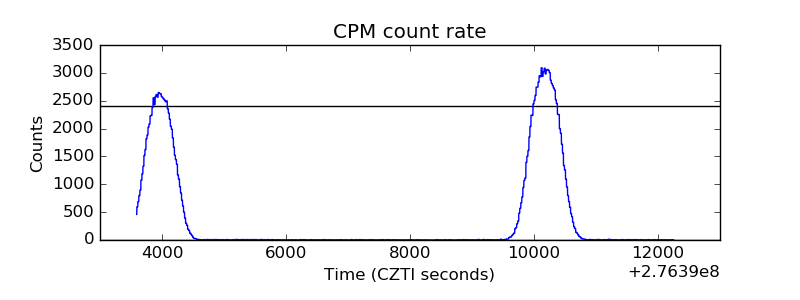 |
| CZT Counter | 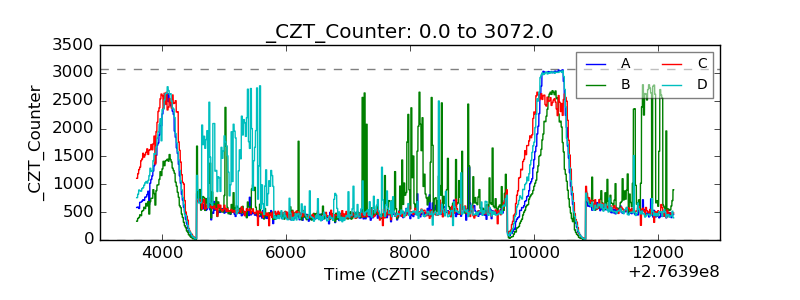 |
| +2.5 Volts monitor |  |
| +5 Volts monitor |  |
| _ROLL_ROT | 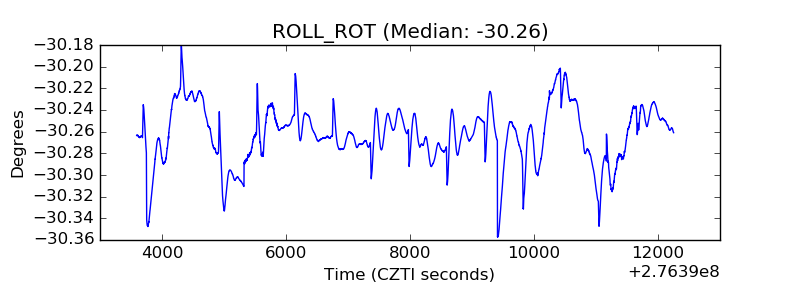 |
| _Roll_DEC | 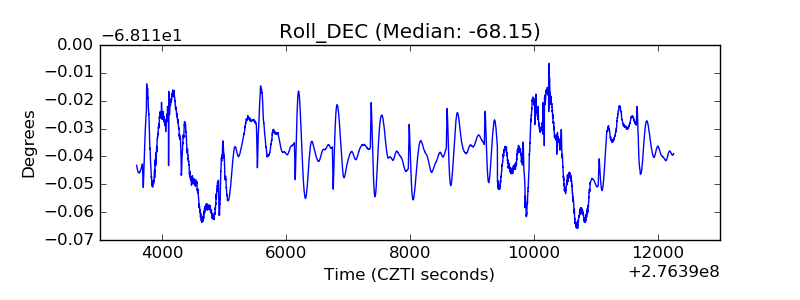 |
| _Roll_RA | 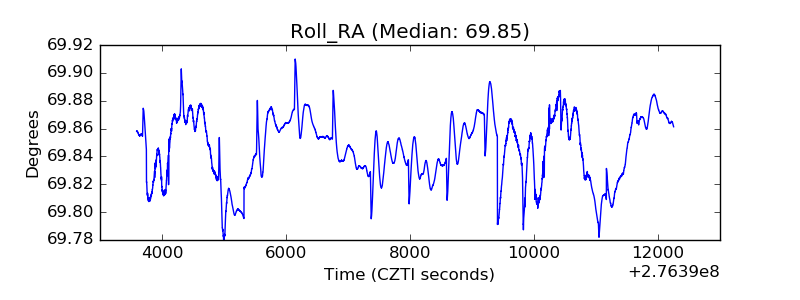 |
| Veto Counter | 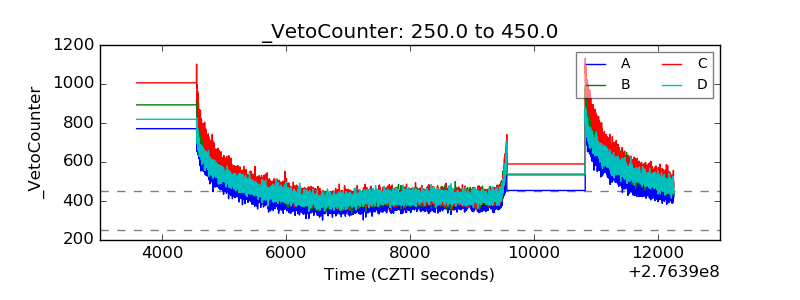 |