| Param | Original file | Final file |
|---|---|---|
| Filename | modeM0/AS1A05_096T04_9000002406_16326cztM0_level2.evt | modeM0/AS1A05_096T04_9000002406_16326cztM0_level2_quad_clean.evt |
| Size (bytes) | 597,844,800 | 112,501,440 |
| Size | 570.1 MB | 107.3 MB |
| Events in quadrant A | 3,395,461 | 778,207 |
| Events in quadrant B | 7,549,004 | 637,160 |
| Events in quadrant C | 3,340,060 | 788,804 |
| Events in quadrant D | 3,390,336 | 759,125 |
| Mode M0 | |||
|---|---|---|---|
| Quadrant | BADHDUFLAG | Total packets | Discarded packets |
| A | 0 | 14022 | 3 |
| B | 0 | 26829 | 2 |
| C | 0 | 13684 | 2 |
| D | 0 | 13956 | 2 |
| Mode SS | |||
|---|---|---|---|
| Quadrant | BADHDUFLAG | Total packets | Discarded packets |
| A | 0 | 130 | 0 |
| B | 0 | 130 | 0 |
| C | 0 | 130 | 0 |
| D | 0 | 130 | 0 |
| Mode M9 | |||
|---|---|---|---|
| Quadrant | BADHDUFLAG | Total packets | Discarded packets |
| A | 0 | 20 | 0 |
| B | 0 | 20 | 0 |
| C | 0 | 20 | 0 |
| D | 0 | 21 | 0 |
| Quadrant | Total seconds | Saturated seconds | Saturation percentage |
|---|---|---|---|
| A | 6350 | 113 | 1.779528% |
| B | 6350 | 1938 | 30.519685% |
| C | 6350 | 78 | 1.228346% |
| D | 6350 | 58 | 0.913386% |
Noise dominated data is calculated using 1-second bins in cleaned event files. If a bin has >2000 counts, and if more than 50% of those come from <1% of pixels, then it is considered to be noise-dominated and hence unusable.
| Quadrant | # 1 sec bins | Bins with >0 counts | Bins with >2000 counts | High rate bins dominated by noise | Noise dominated (total time) | Noise dominated (detector-on time) | Marked lightcurve |
|---|---|---|---|---|---|---|---|
| A | 7686 | 6352 | 51 | 51 | 0.66% | 0.80% | 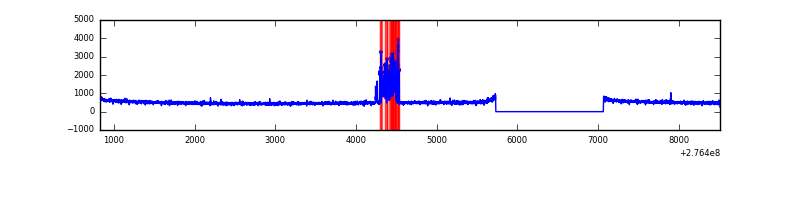 |
| B | 7686 | 6352 | 1395 | 1395 | 18.15% | 21.96% | 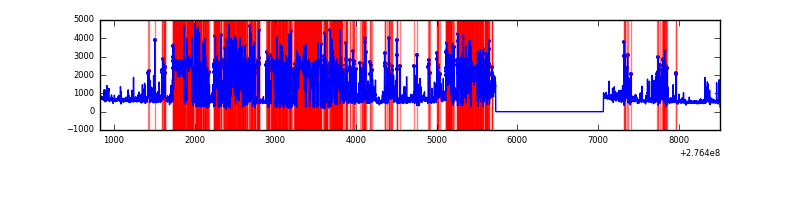 |
| C | 7686 | 6352 | 0 | 0 | 0.00% | 0.00% |  |
| D | 7686 | 6352 | 38 | 38 | 0.49% | 0.60% | 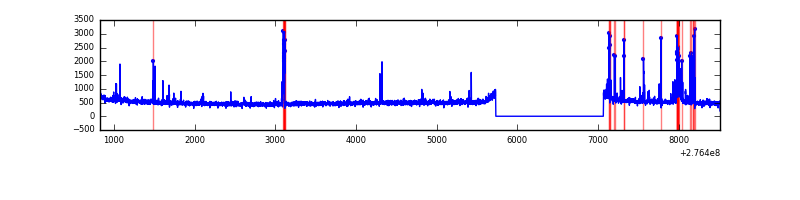 |
Top three noisy pixels from each quadrant. If the there are fewer than three noisy pixels in the level2.evt file, extra rows are filled as -1
| Pixel properties | Quadrant properties | ||||||
|---|---|---|---|---|---|---|---|
| Quadrant | DetID | PixID | Counts | Sigma | Mean | Median | Sigma |
| A | 15 | 174 | 269729 | 1688.64 | 812 | 797 | 159.3 |
| A | 0 | 226 | 7139 | 39.82 | 812 | 797 | 159.3 |
| A | 12 | 194 | 6027 | 32.84 | 812 | 797 | 159.3 |
| B | 3 | 112 | 4760917 | 39088.26 | 673 | 658 | 121.8 |
| B | 0 | 189 | 55511 | 450.42 | 673 | 658 | 121.8 |
| B | 4 | 173 | 41952 | 339.08 | 673 | 658 | 121.8 |
| C | 14 | 238 | 129584 | 683.22 | 818 | 824 | 188.5 |
| C | 0 | 207 | 13021 | 64.72 | 818 | 824 | 188.5 |
| C | 3 | 233 | 10220 | 49.86 | 818 | 824 | 188.5 |
| D | 2 | 14 | 158070 | 804.53 | 817 | 795 | 195.5 |
| D | 1 | 52 | 55414 | 279.4 | 817 | 795 | 195.5 |
| D | 13 | 104 | 30022 | 149.51 | 817 | 795 | 195.5 |
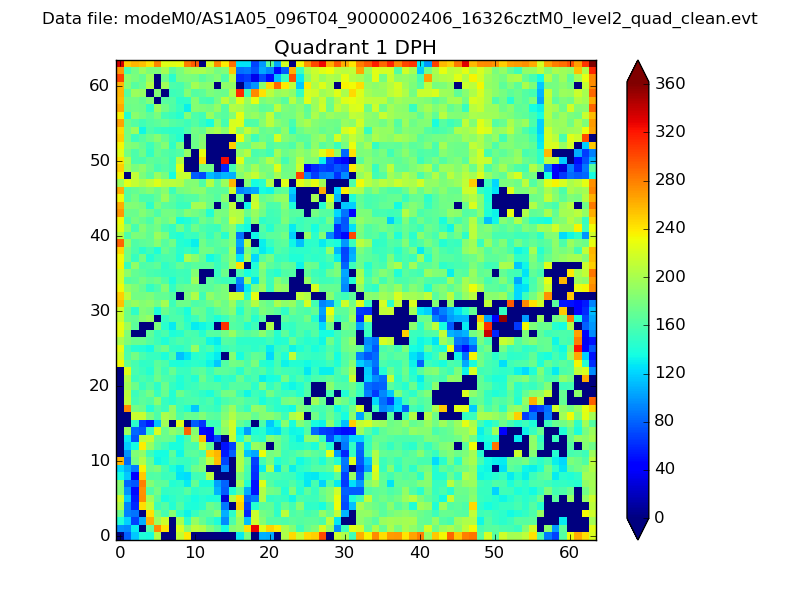
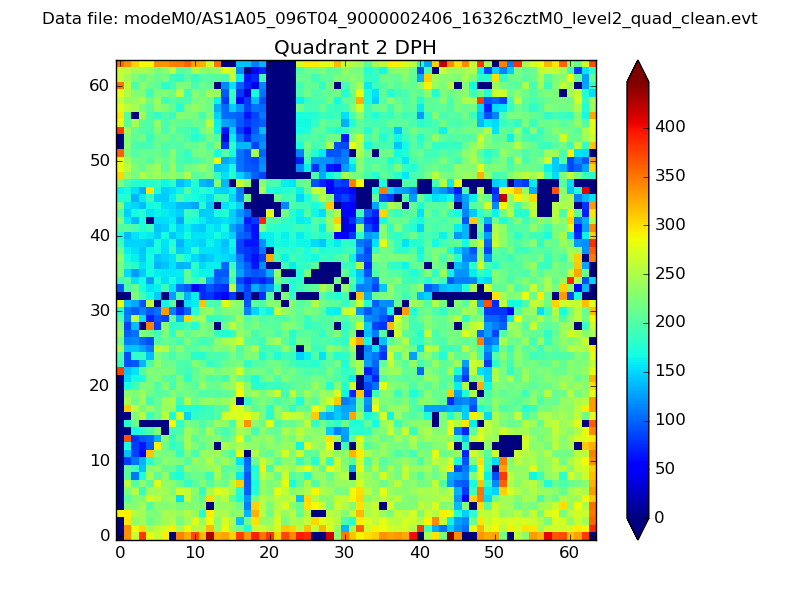
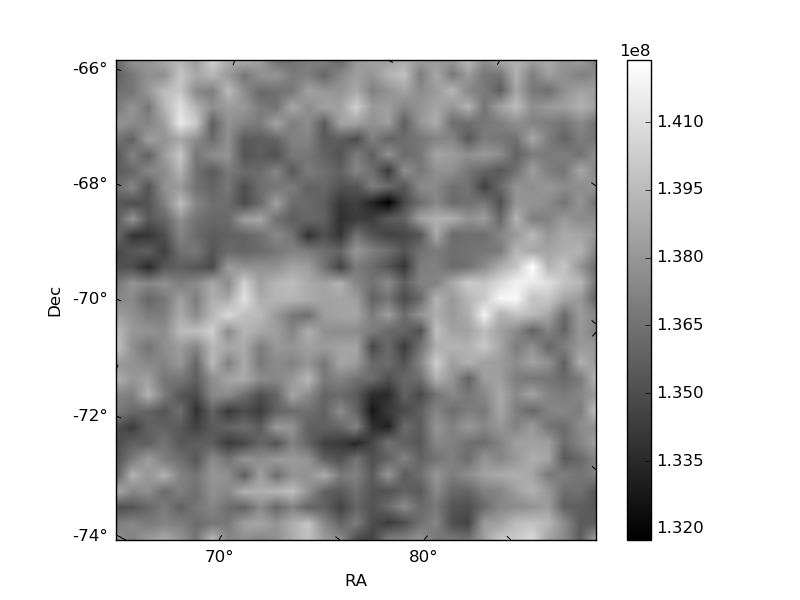
Histogram calculated using DETX and DETY for each event in the final _common_clean file
| Quadrant A | 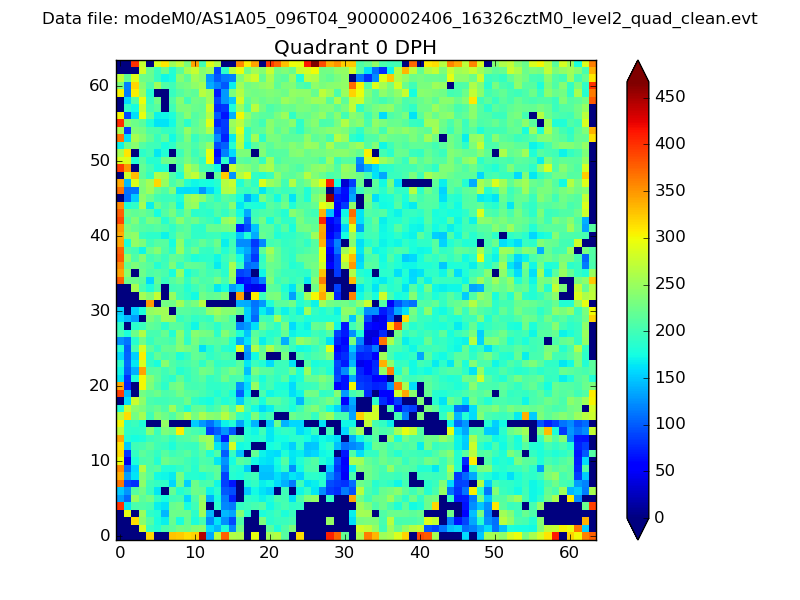 |
 |
Quadrant B |
|---|---|---|---|
| Quadrant D |  |
 |
Quadrant C |
| Plot type | Count rate plots | Images |
|---|---|---|
| Comparison with Poisson distribution Blue bars denote a histogram of data divided into 1 sec bins. Red curve is a Poisson curve with rate = median count rate of data. |
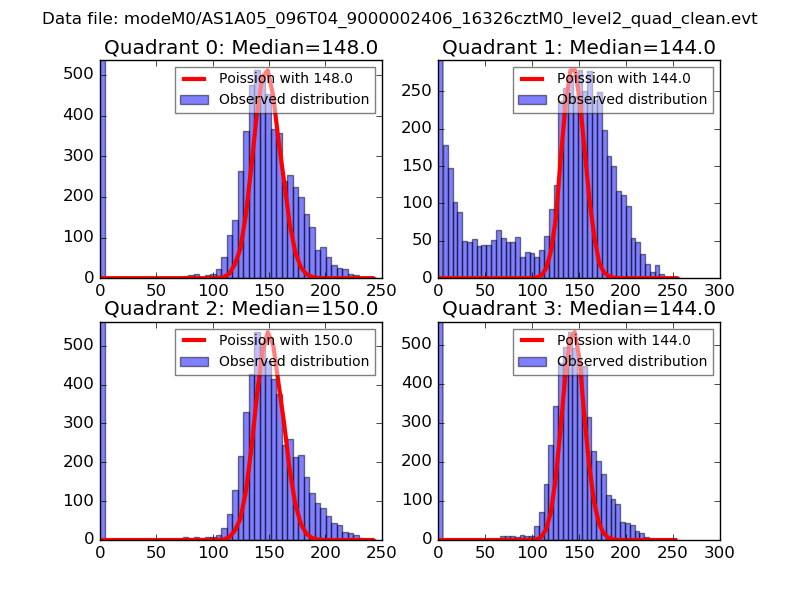 |
 |
| Quadrant-wise count rates Data is divided into 100 sec bins |
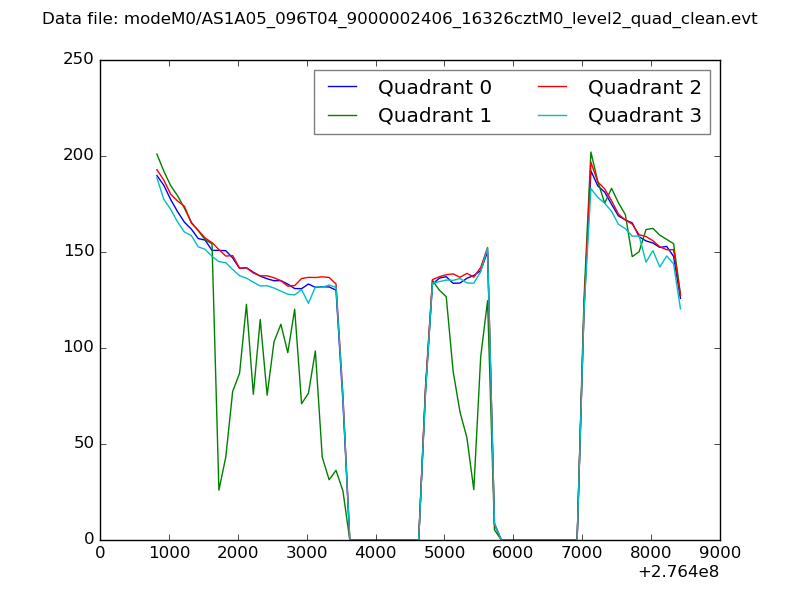 |
|
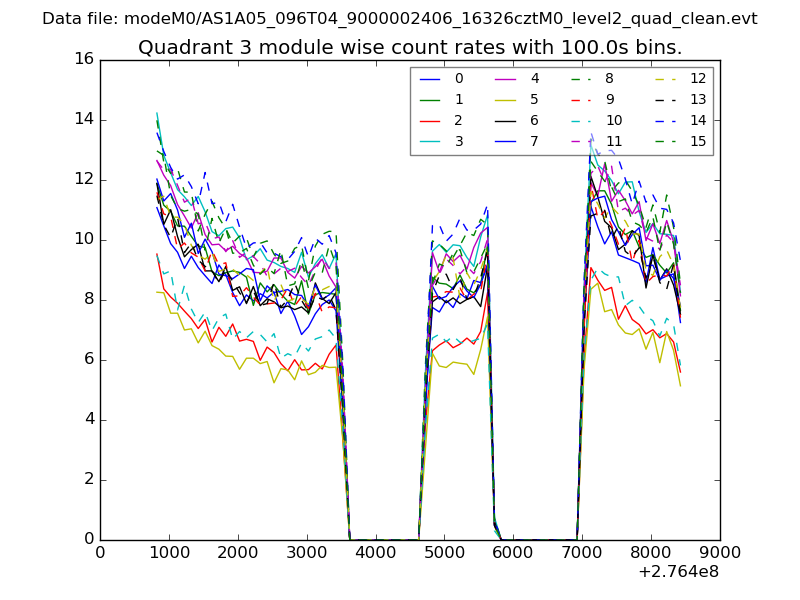
| Module-wise count rates for Quadrant A Data is divided into 100 sec bins |
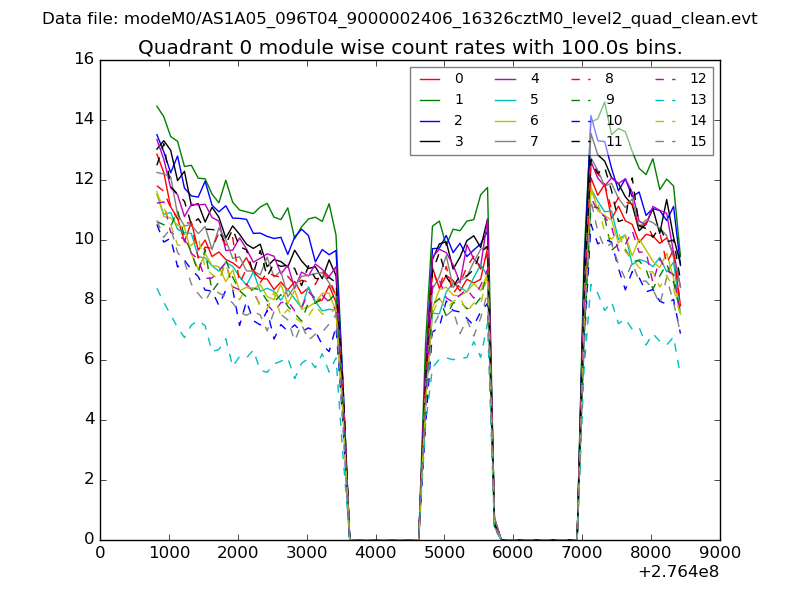 |
 |
| Module-wise count rates for Quadrant B Data is divided into 100 sec bins |
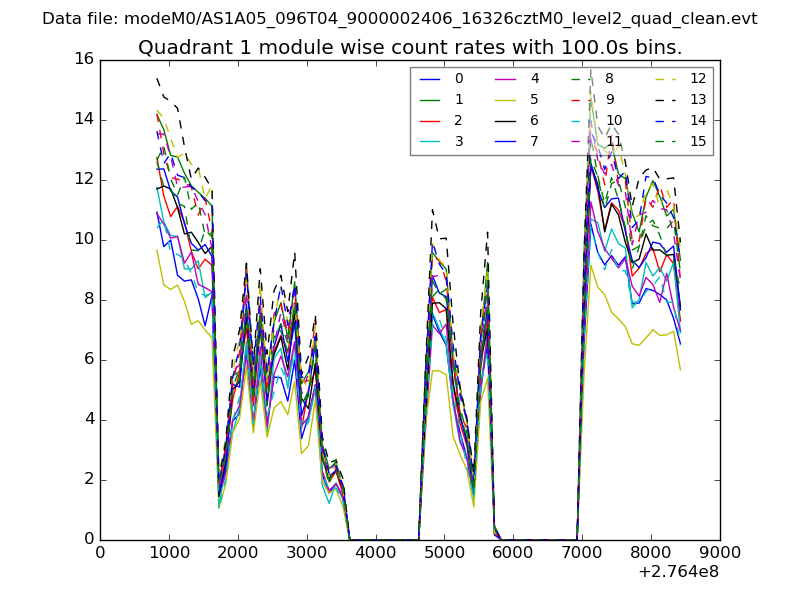 |
 |
| Module-wise count rates for Quadrant C Data is divided into 100 sec bins |
 |
 |
| Module-wise count rates for Quadrant D Data is divided into 100 sec bins |
 |
 |
| Parameter | Plot |
|---|---|
| CZT HV Monitor | 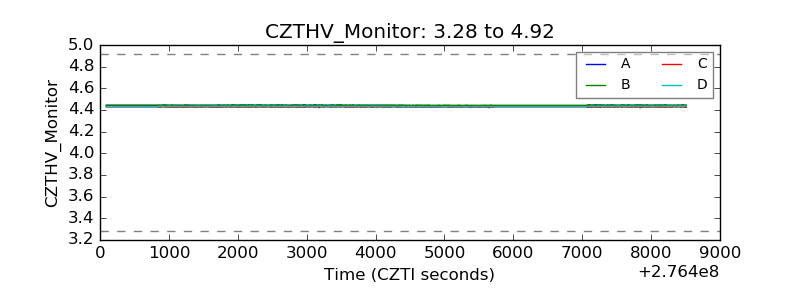 |
| D_VDD | 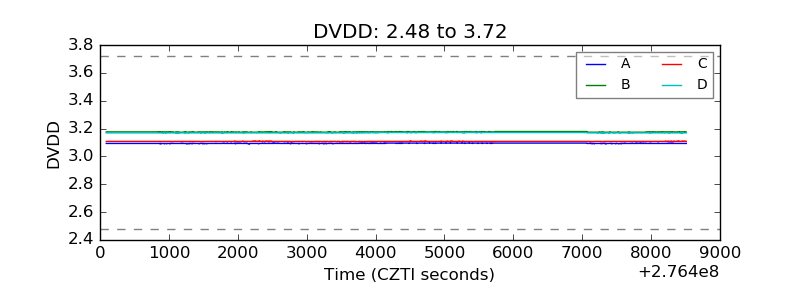 |
| Temperature 1 | 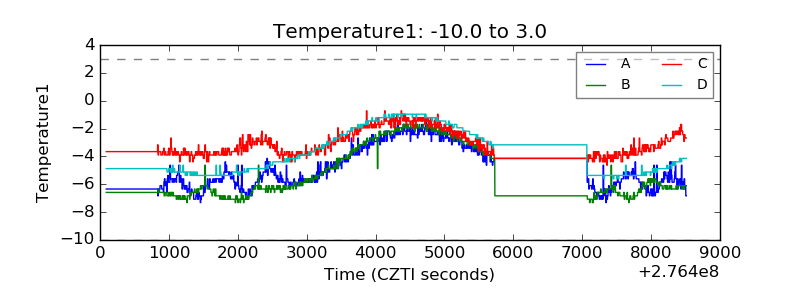 |
| Veto HV Monitor | 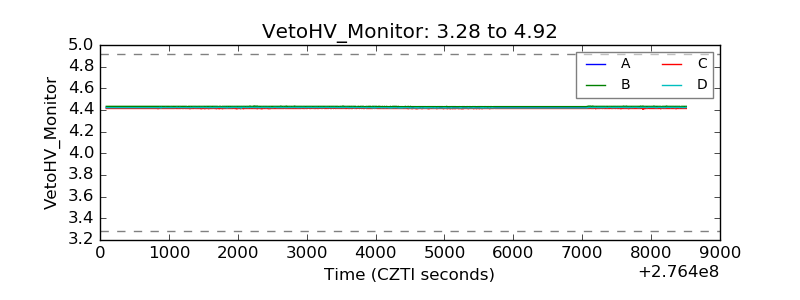 |
| Veto LLD | 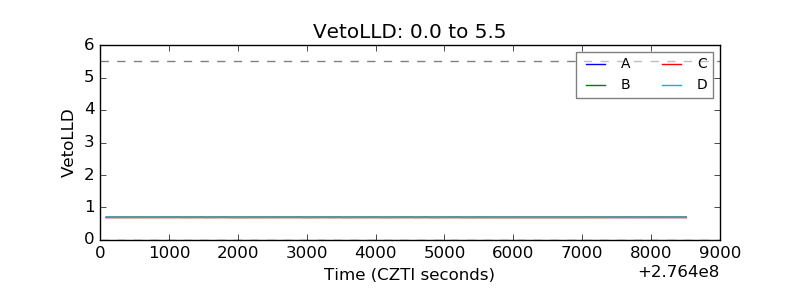 |
| Alpha Counter | 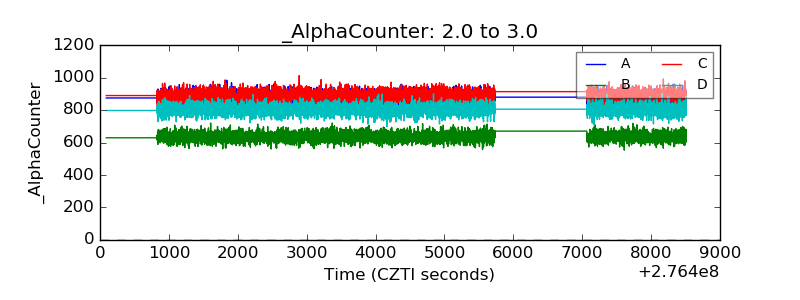 |
| _CPM_Rate | 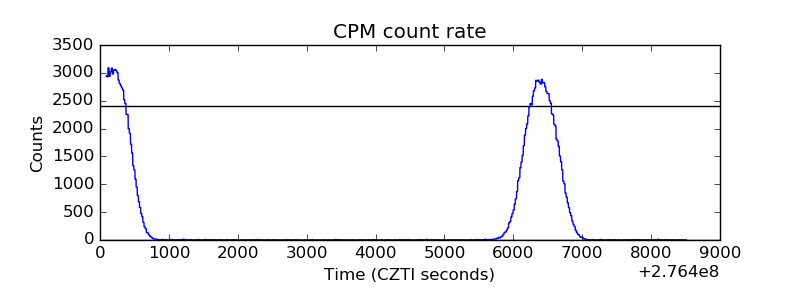 |
| CZT Counter | 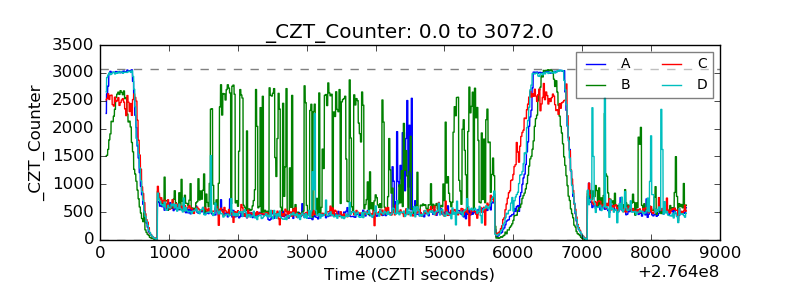 |
| +2.5 Volts monitor |  |
| +5 Volts monitor |  |
| _ROLL_ROT | 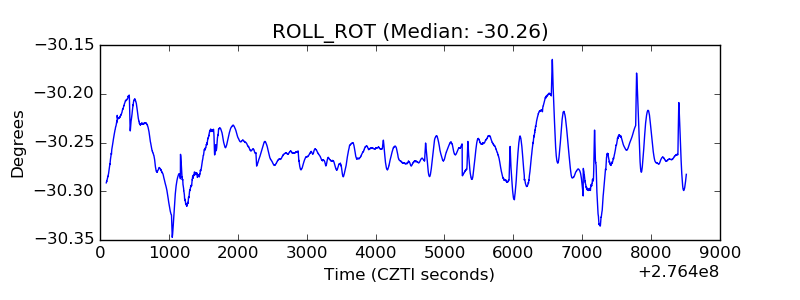 |
| _Roll_DEC | 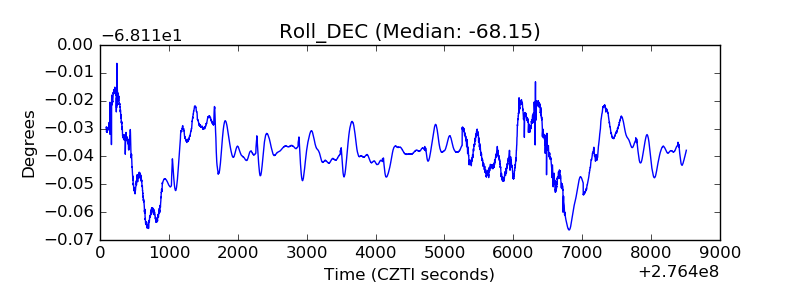 |
| _Roll_RA |  |
| Veto Counter | 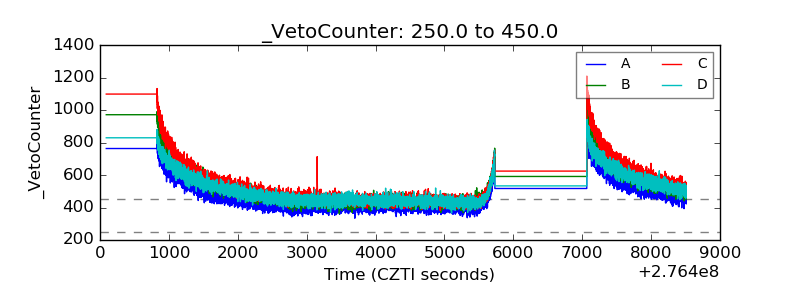 |