| Param | Original file | Final file |
|---|---|---|
| Filename | modeM0/AS1A05_096T04_9000002406_16327cztM0_level2.evt | modeM0/AS1A05_096T04_9000002406_16327cztM0_level2_quad_clean.evt |
| Size (bytes) | 449,971,200 | 104,696,640 |
| Size | 429.1 MB | 99.8 MB |
| Events in quadrant A | 3,141,148 | 688,719 |
| Events in quadrant B | 3,997,286 | 702,717 |
| Events in quadrant C | 3,037,246 | 697,006 |
| Events in quadrant D | 3,059,450 | 678,692 |
| Mode M0 | |||
|---|---|---|---|
| Quadrant | BADHDUFLAG | Total packets | Discarded packets |
| A | 0 | 12785 | 2 |
| B | 0 | 15599 | 1 |
| C | 0 | 12301 | 1 |
| D | 0 | 12558 | 1 |
| Mode SS | |||
|---|---|---|---|
| Quadrant | BADHDUFLAG | Total packets | Discarded packets |
| A | 0 | 116 | 0 |
| B | 0 | 116 | 0 |
| C | 0 | 116 | 0 |
| D | 0 | 116 | 0 |
| Mode M9 | |||
|---|---|---|---|
| Quadrant | BADHDUFLAG | Total packets | Discarded packets |
| A | 0 | 14 | 0 |
| B | 0 | 14 | 0 |
| C | 0 | 14 | 0 |
| D | 0 | 14 | 0 |
| Quadrant | Total seconds | Saturated seconds | Saturation percentage |
|---|---|---|---|
| A | 5781 | 100 | 1.729805% |
| B | 5781 | 244 | 4.220723% |
| C | 5781 | 77 | 1.331949% |
| D | 5781 | 59 | 1.020585% |
Noise dominated data is calculated using 1-second bins in cleaned event files. If a bin has >2000 counts, and if more than 50% of those come from <1% of pixels, then it is considered to be noise-dominated and hence unusable.
| Quadrant | # 1 sec bins | Bins with >0 counts | Bins with >2000 counts | High rate bins dominated by noise | Noise dominated (total time) | Noise dominated (detector-on time) | Marked lightcurve |
|---|---|---|---|---|---|---|---|
| A | 7142 | 5783 | 44 | 44 | 0.62% | 0.76% | 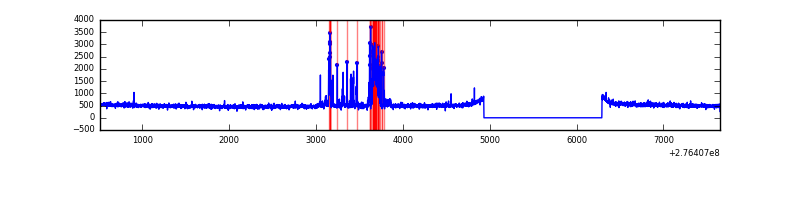 |
| B | 7142 | 5783 | 79 | 79 | 1.11% | 1.37% |  |
| C | 7142 | 5783 | 0 | 0 | 0.00% | 0.00% | 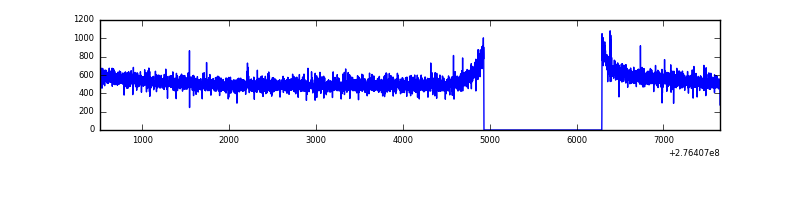 |
| D | 7142 | 5783 | 27 | 27 | 0.38% | 0.47% | 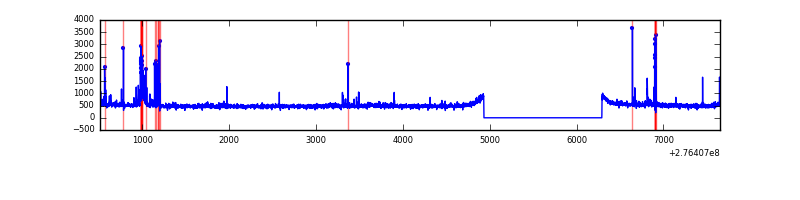 |
Top three noisy pixels from each quadrant. If the there are fewer than three noisy pixels in the level2.evt file, extra rows are filled as -1
| Pixel properties | Quadrant properties | ||||||
|---|---|---|---|---|---|---|---|
| Quadrant | DetID | PixID | Counts | Sigma | Mean | Median | Sigma |
| A | 15 | 174 | 285838 | 1928.43 | 742 | 728 | 147.8 |
| A | 0 | 226 | 6388 | 38.28 | 742 | 728 | 147.8 |
| A | 12 | 194 | 5485 | 32.18 | 742 | 728 | 147.8 |
| B | 3 | 112 | 831343 | 6122.31 | 741 | 724 | 135.7 |
| B | 0 | 189 | 97455 | 712.98 | 741 | 724 | 135.7 |
| B | 10 | 16 | 49220 | 357.45 | 741 | 724 | 135.7 |
| C | 14 | 238 | 115615 | 673.42 | 741 | 750 | 170.6 |
| C | 3 | 233 | 17803 | 99.98 | 741 | 750 | 170.6 |
| C | 0 | 207 | 13296 | 73.55 | 741 | 750 | 170.6 |
| D | 2 | 14 | 111101 | 619.5 | 745 | 726 | 178.2 |
| D | 1 | 52 | 37954 | 208.95 | 745 | 726 | 178.2 |
| D | 2 | 122 | 36985 | 203.51 | 745 | 726 | 178.2 |
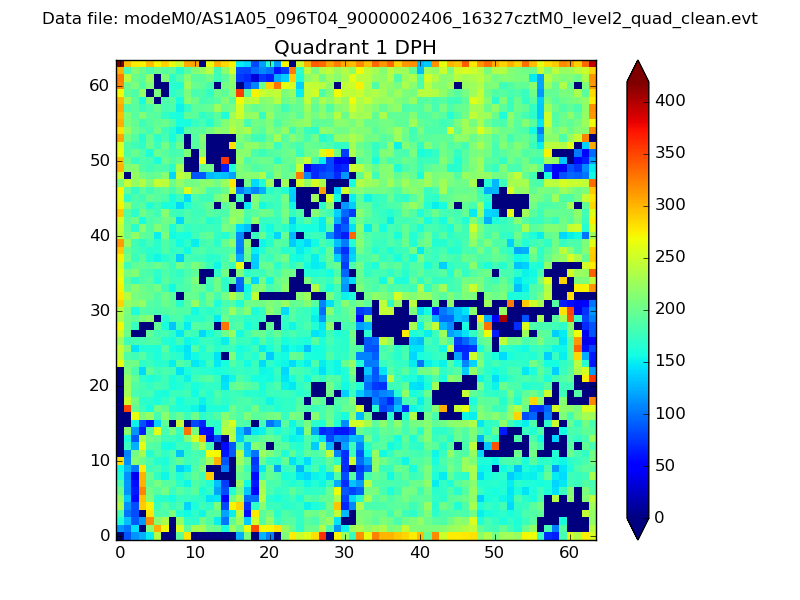
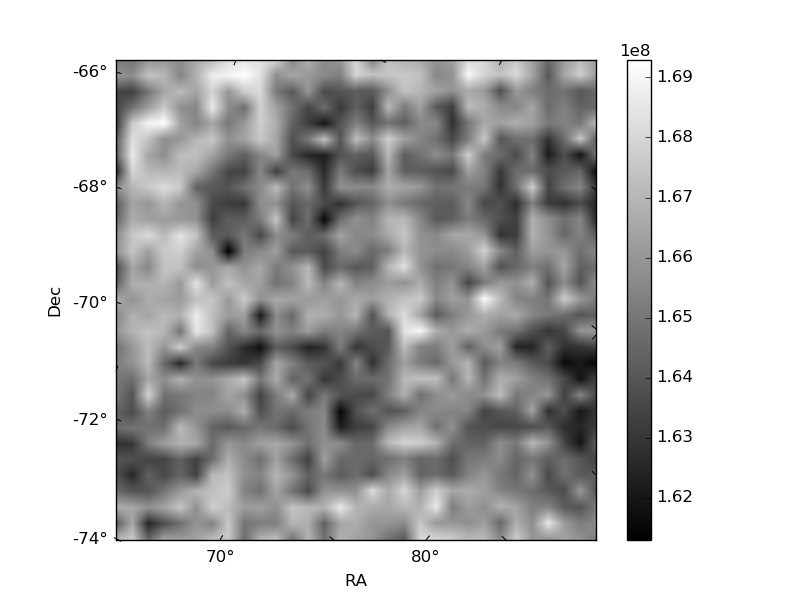
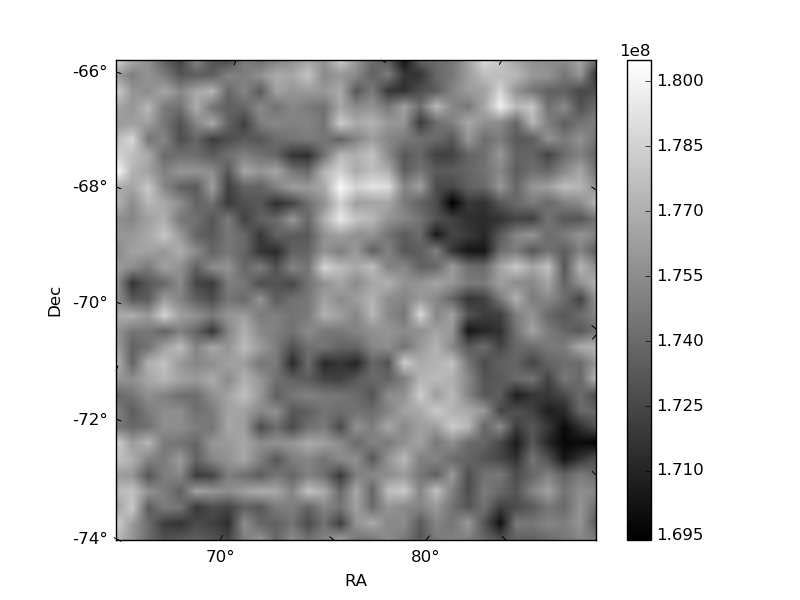
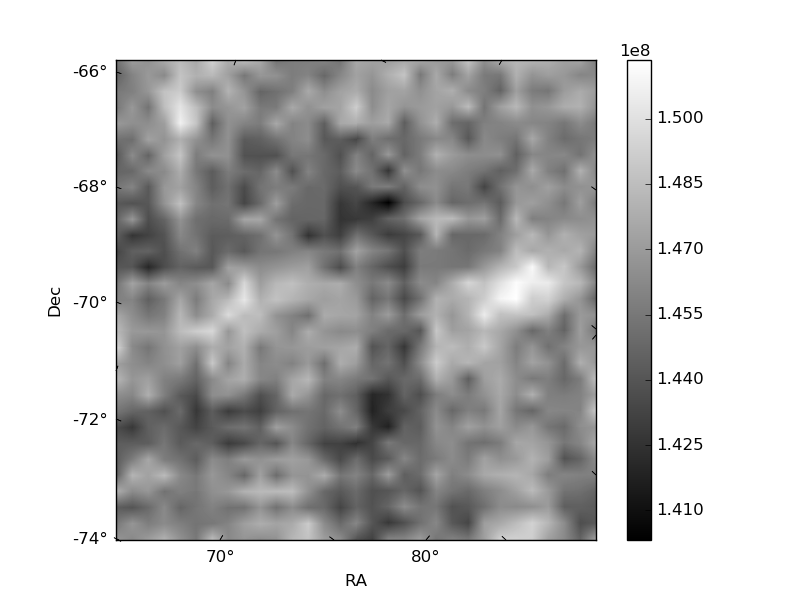
Histogram calculated using DETX and DETY for each event in the final _common_clean file
| Quadrant A |  |
 |
Quadrant B |
|---|---|---|---|
| Quadrant D |  |
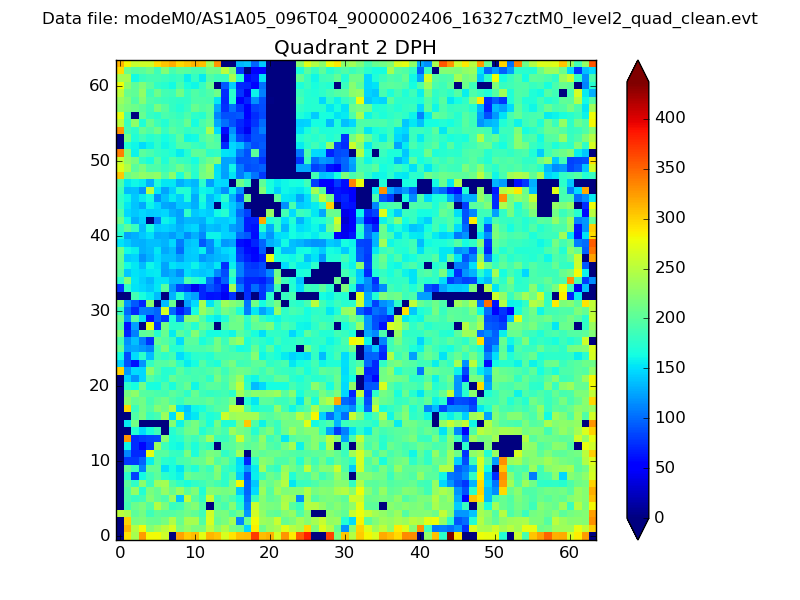 |
Quadrant C |
| Plot type | Count rate plots | Images |
|---|---|---|
| Comparison with Poisson distribution Blue bars denote a histogram of data divided into 1 sec bins. Red curve is a Poisson curve with rate = median count rate of data. |
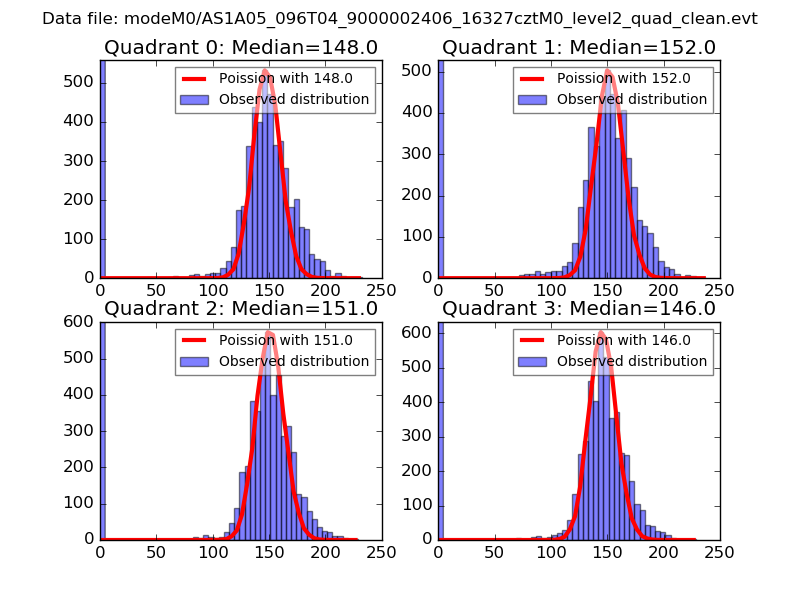 |
 |
| Quadrant-wise count rates Data is divided into 100 sec bins |
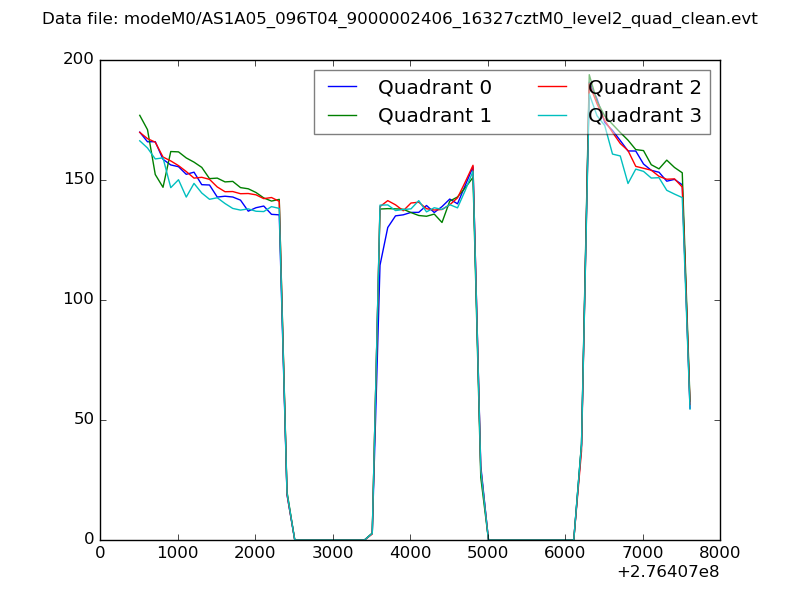 |
|
| Module-wise count rates for Quadrant A Data is divided into 100 sec bins |
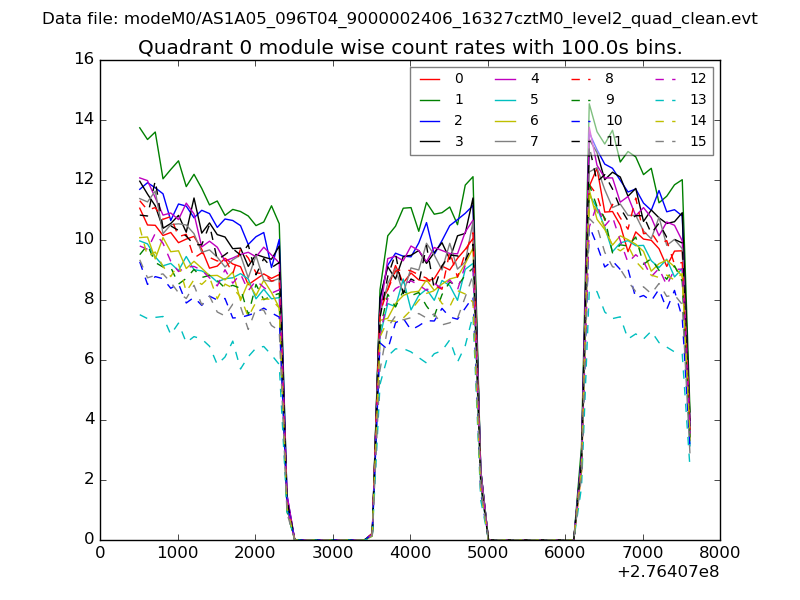 |
 |
| Module-wise count rates for Quadrant B Data is divided into 100 sec bins |
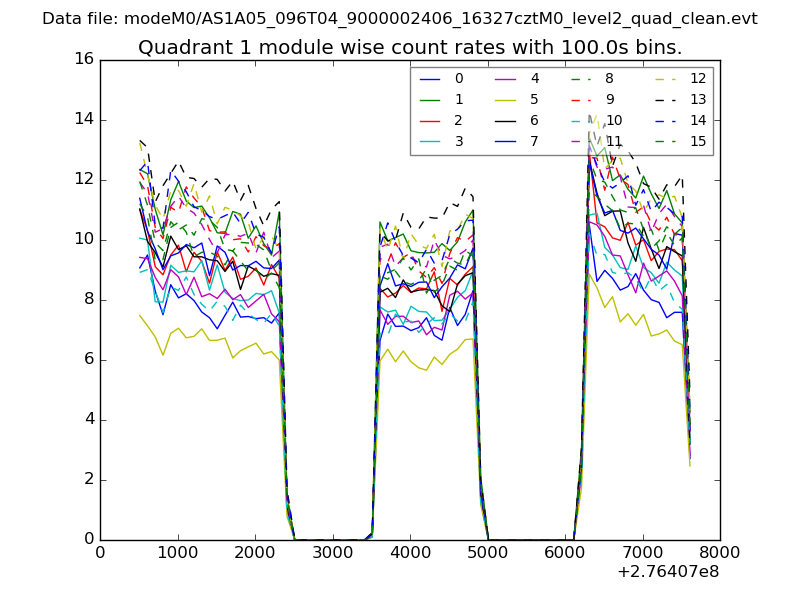 |
 |
| Module-wise count rates for Quadrant C Data is divided into 100 sec bins |
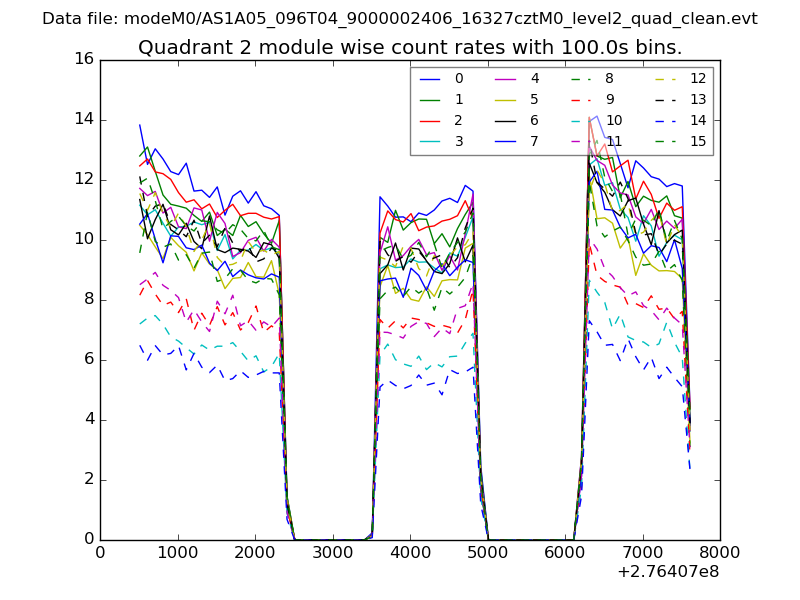 |
 |
| Module-wise count rates for Quadrant D Data is divided into 100 sec bins |
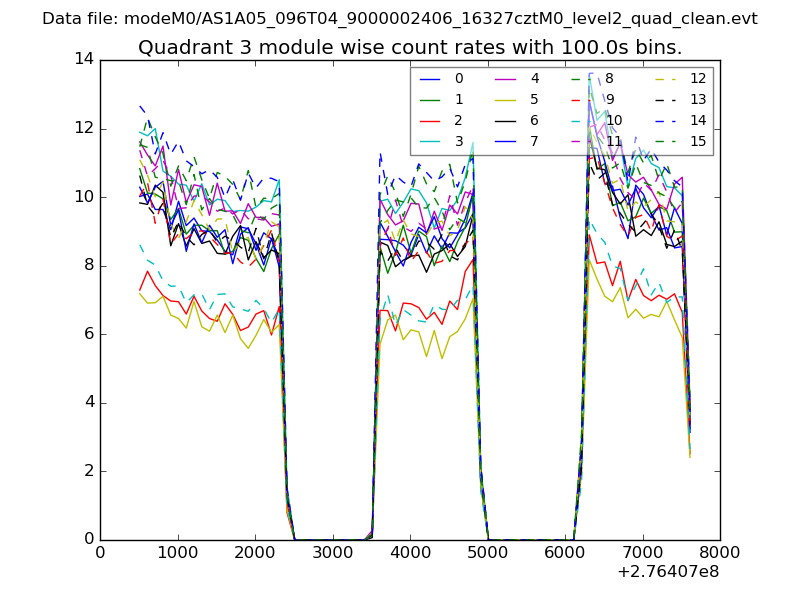 |
 |
| Parameter | Plot |
|---|---|
| CZT HV Monitor | 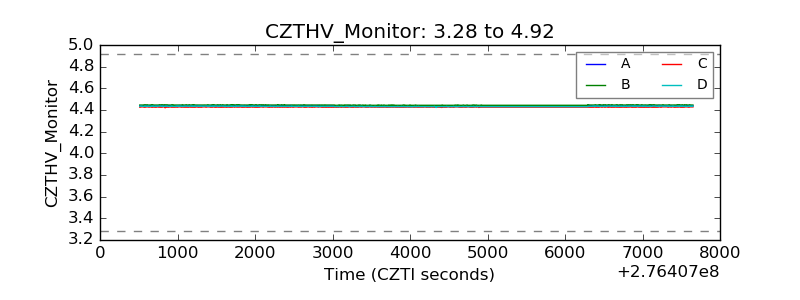 |
| D_VDD | 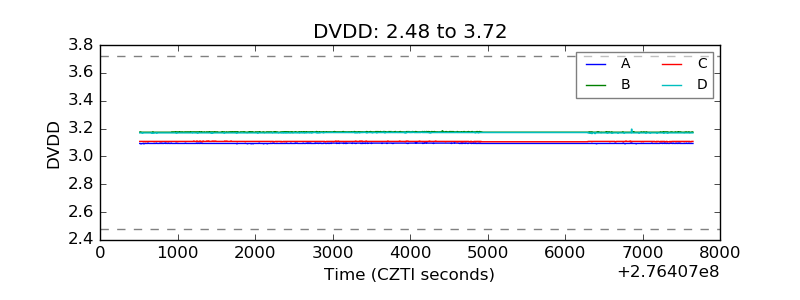 |
| Temperature 1 | 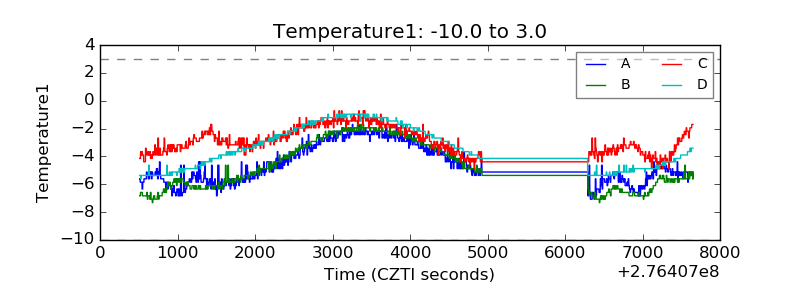 |
| Veto HV Monitor | 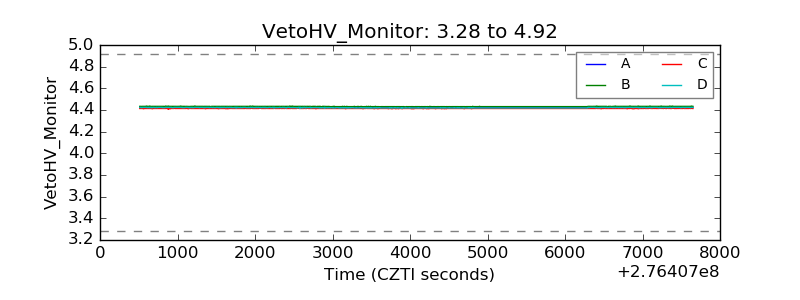 |
| Veto LLD |  |
| Alpha Counter | 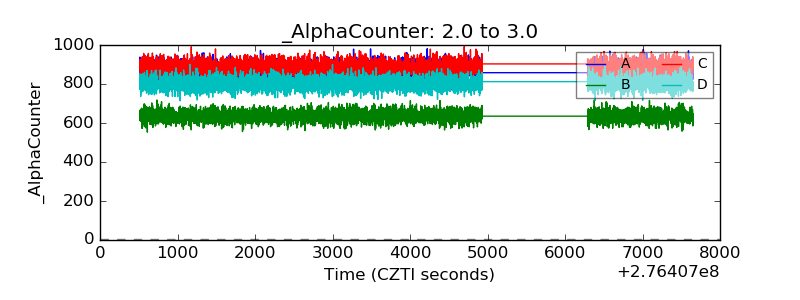 |
| _CPM_Rate | 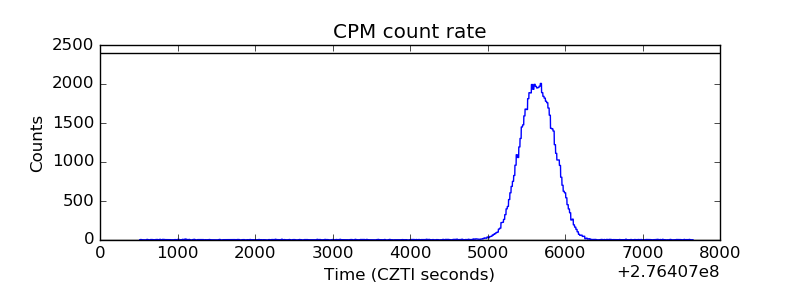 |
| CZT Counter | 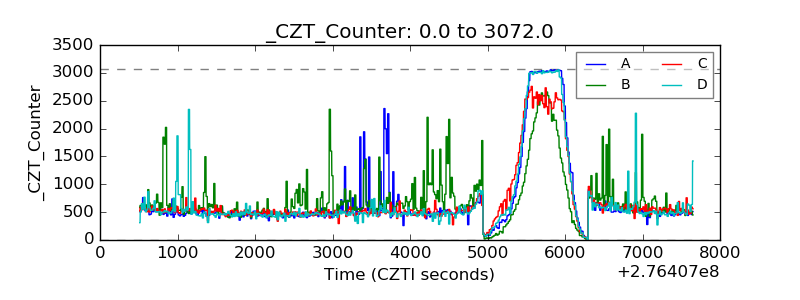 |
| +2.5 Volts monitor |  |
| +5 Volts monitor |  |
| _ROLL_ROT | 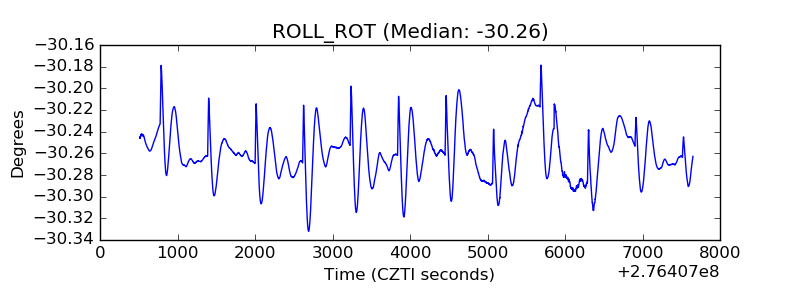 |
| _Roll_DEC | 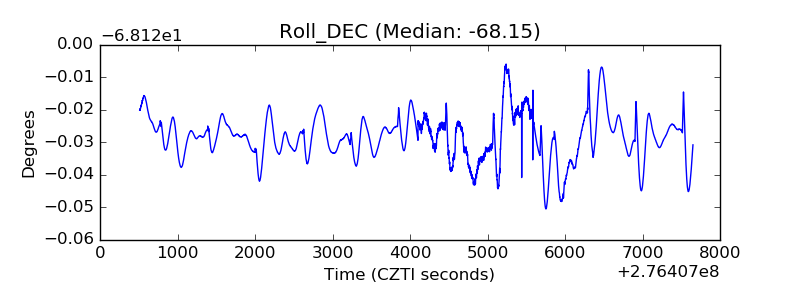 |
| _Roll_RA | 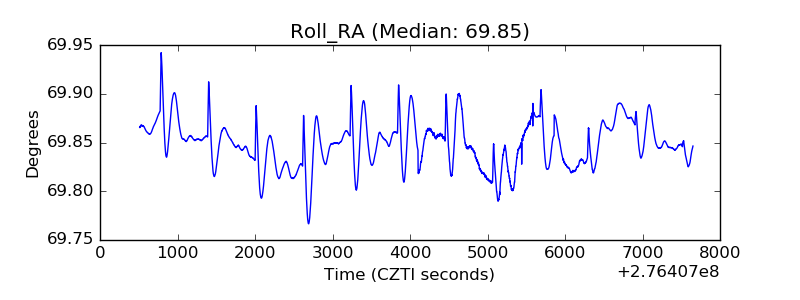 |
| Veto Counter | 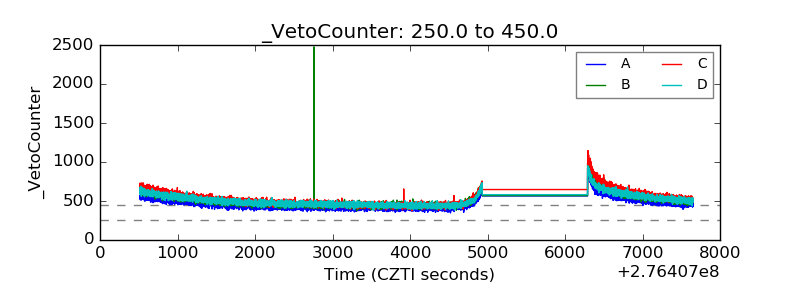 |