| Param | Original file | Final file |
|---|---|---|
| Filename | modeM0/AS1A05_096T04_9000002406_16328cztM0_level2.evt | modeM0/AS1A05_096T04_9000002406_16328cztM0_level2_quad_clean.evt |
| Size (bytes) | 421,427,520 | 103,150,080 |
| Size | 401.9 MB | 98.4 MB |
| Events in quadrant A | 2,941,626 | 677,613 |
| Events in quadrant B | 3,338,801 | 693,867 |
| Events in quadrant C | 3,064,276 | 679,985 |
| Events in quadrant D | 3,019,876 | 663,087 |
| Mode M0 | |||
|---|---|---|---|
| Quadrant | BADHDUFLAG | Total packets | Discarded packets |
| A | 0 | 12278 | 2 |
| B | 0 | 13466 | 1 |
| C | 0 | 12389 | 1 |
| D | 0 | 12564 | 1 |
| Mode SS | |||
|---|---|---|---|
| Quadrant | BADHDUFLAG | Total packets | Discarded packets |
| A | 0 | 120 | 0 |
| B | 0 | 120 | 0 |
| C | 0 | 120 | 0 |
| D | 0 | 120 | 0 |
| Mode M9 | |||
|---|---|---|---|
| Quadrant | BADHDUFLAG | Total packets | Discarded packets |
| A | 0 | 13 | 0 |
| B | 0 | 13 | 0 |
| C | 0 | 13 | 0 |
| D | 0 | 13 | 0 |
| Quadrant | Total seconds | Saturated seconds | Saturation percentage |
|---|---|---|---|
| A | 5857 | 51 | 0.870753% |
| B | 5857 | 62 | 1.058562% |
| C | 5857 | 111 | 1.895168% |
| D | 5857 | 59 | 1.007342% |
Noise dominated data is calculated using 1-second bins in cleaned event files. If a bin has >2000 counts, and if more than 50% of those come from <1% of pixels, then it is considered to be noise-dominated and hence unusable.
| Quadrant | # 1 sec bins | Bins with >0 counts | Bins with >2000 counts | High rate bins dominated by noise | Noise dominated (total time) | Noise dominated (detector-on time) | Marked lightcurve |
|---|---|---|---|---|---|---|---|
| A | 7143 | 5859 | 7 | 7 | 0.10% | 0.12% | 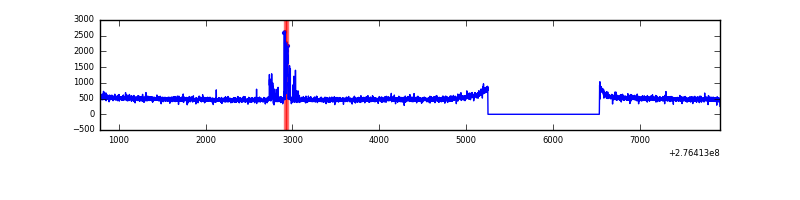 |
| B | 7143 | 5859 | 14 | 14 | 0.20% | 0.24% | 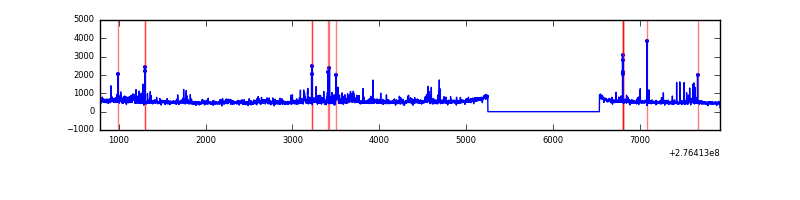 |
| C | 7143 | 5859 | 0 | 0 | 0.00% | 0.00% | 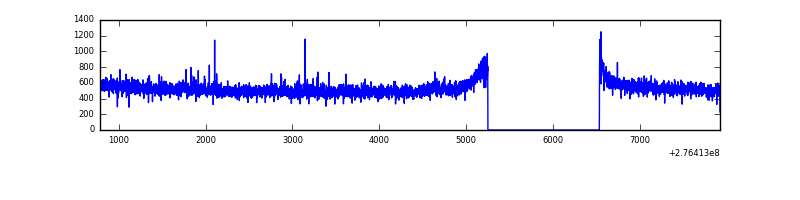 |
| D | 7143 | 5859 | 18 | 18 | 0.25% | 0.31% |  |
Top three noisy pixels from each quadrant. If the there are fewer than three noisy pixels in the level2.evt file, extra rows are filled as -1
| Pixel properties | Quadrant properties | ||||||
|---|---|---|---|---|---|---|---|
| Quadrant | DetID | PixID | Counts | Sigma | Mean | Median | Sigma |
| A | 15 | 174 | 82807 | 557.14 | 743 | 728 | 147.3 |
| A | 0 | 226 | 6565 | 39.62 | 743 | 728 | 147.3 |
| A | 12 | 194 | 5585 | 32.97 | 743 | 728 | 147.3 |
| B | 3 | 112 | 288815 | 2072.47 | 742 | 723 | 139.0 |
| B | 0 | 189 | 37473 | 264.37 | 742 | 723 | 139.0 |
| B | 0 | 198 | 25240 | 176.37 | 742 | 723 | 139.0 |
| C | 14 | 238 | 114440 | 675.42 | 733 | 737 | 168.3 |
| C | 3 | 233 | 72879 | 428.54 | 733 | 737 | 168.3 |
| C | 0 | 207 | 19846 | 113.51 | 733 | 737 | 168.3 |
| D | 1 | 52 | 61514 | 342.0 | 741 | 719 | 177.8 |
| D | 2 | 14 | 42705 | 236.19 | 741 | 719 | 177.8 |
| D | 2 | 136 | 35526 | 195.81 | 741 | 719 | 177.8 |
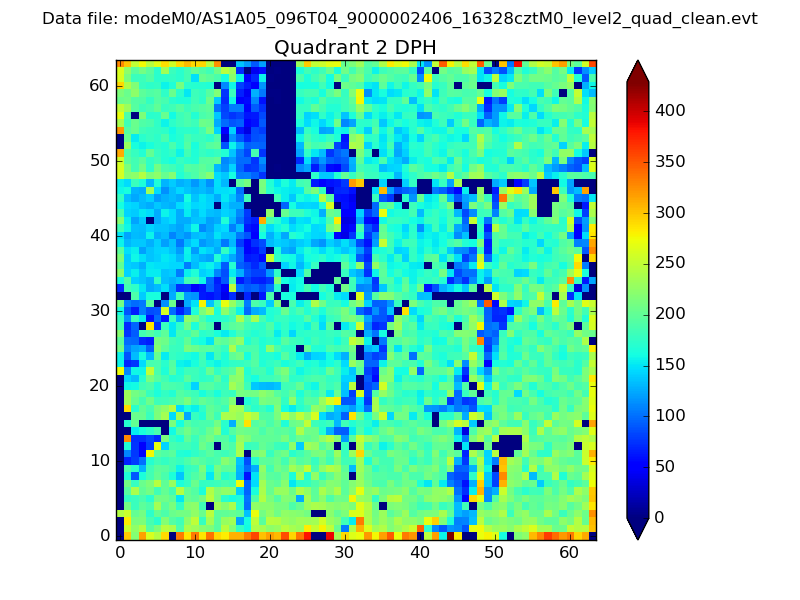
Histogram calculated using DETX and DETY for each event in the final _common_clean file
| Quadrant A | 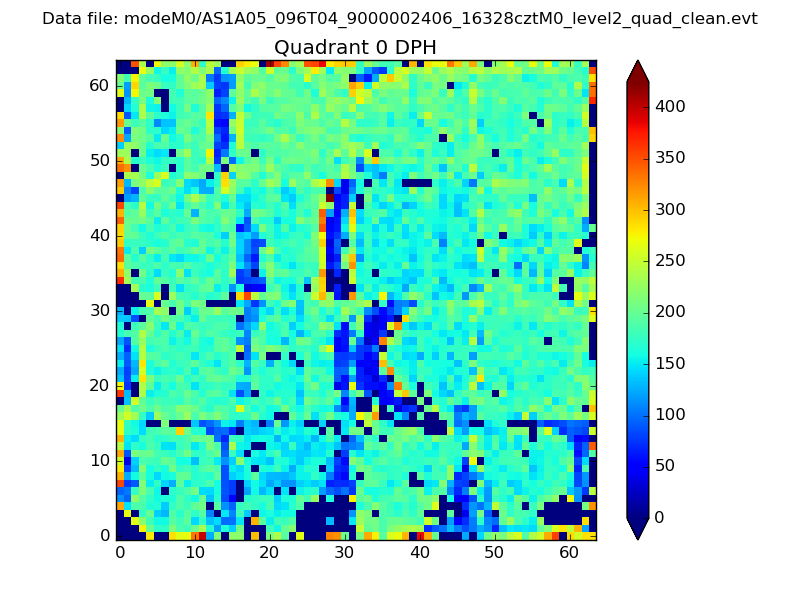 |
 |
Quadrant B |
|---|---|---|---|
| Quadrant D | 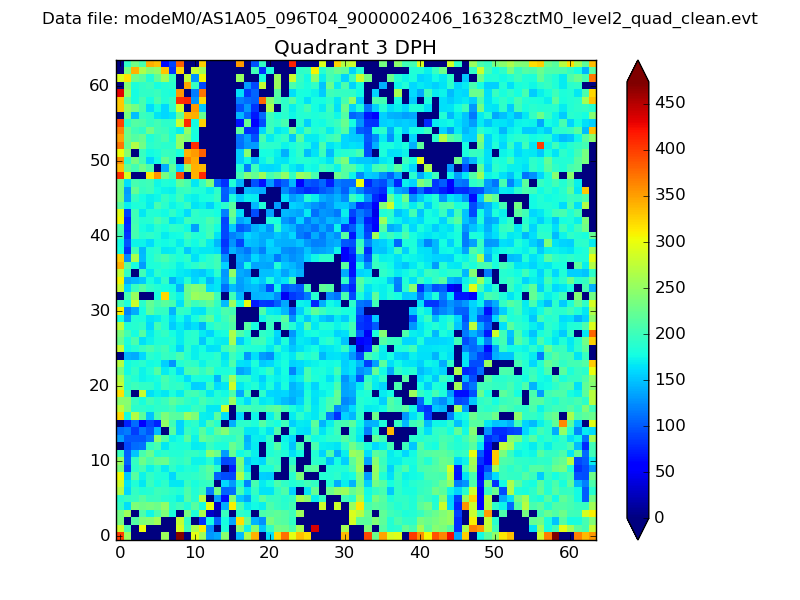 |
 |
Quadrant C |
| Plot type | Count rate plots | Images |
|---|---|---|
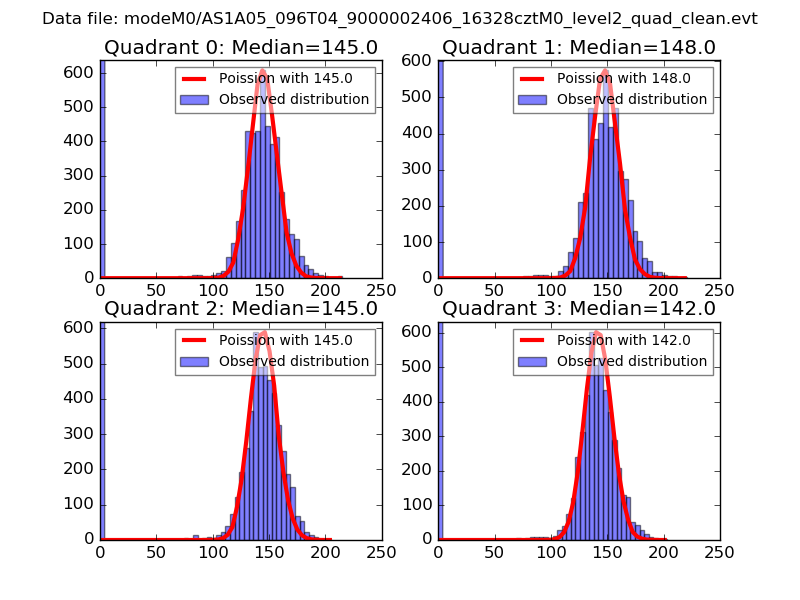
| Comparison with Poisson distribution Blue bars denote a histogram of data divided into 1 sec bins. Red curve is a Poisson curve with rate = median count rate of data. |
 |
 |
| Quadrant-wise count rates Data is divided into 100 sec bins |
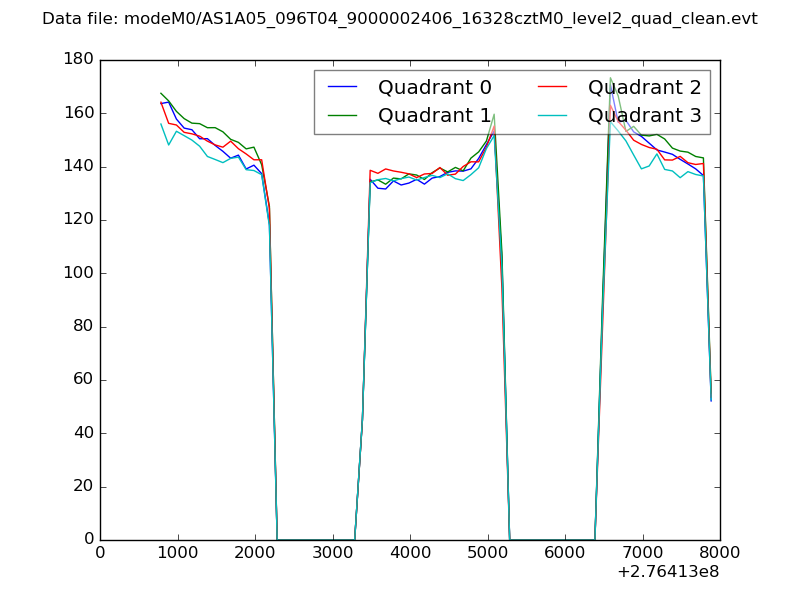 |
|
| Module-wise count rates for Quadrant A Data is divided into 100 sec bins |
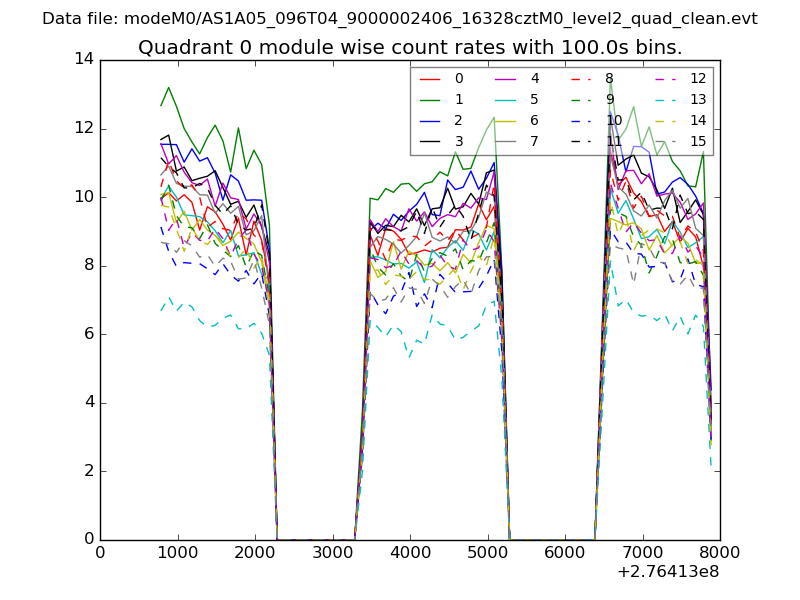 |
 |
| Module-wise count rates for Quadrant B Data is divided into 100 sec bins |
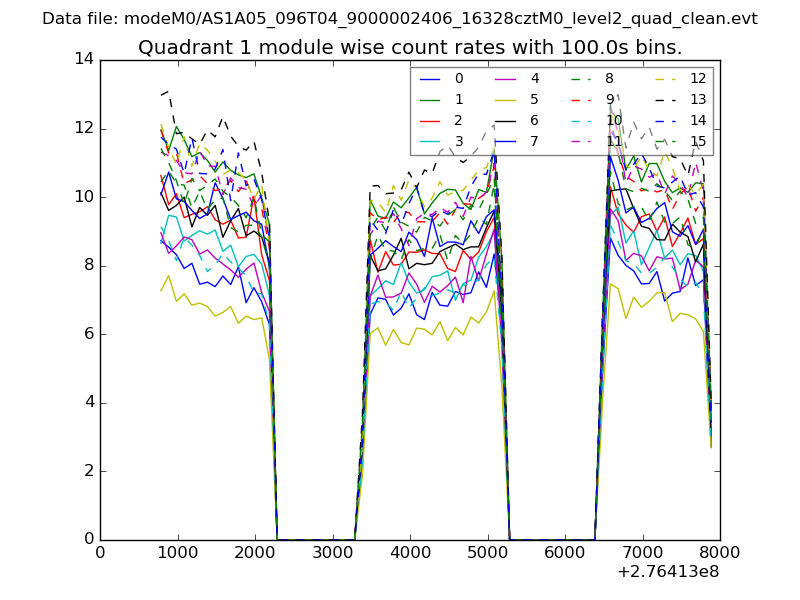 |
 |
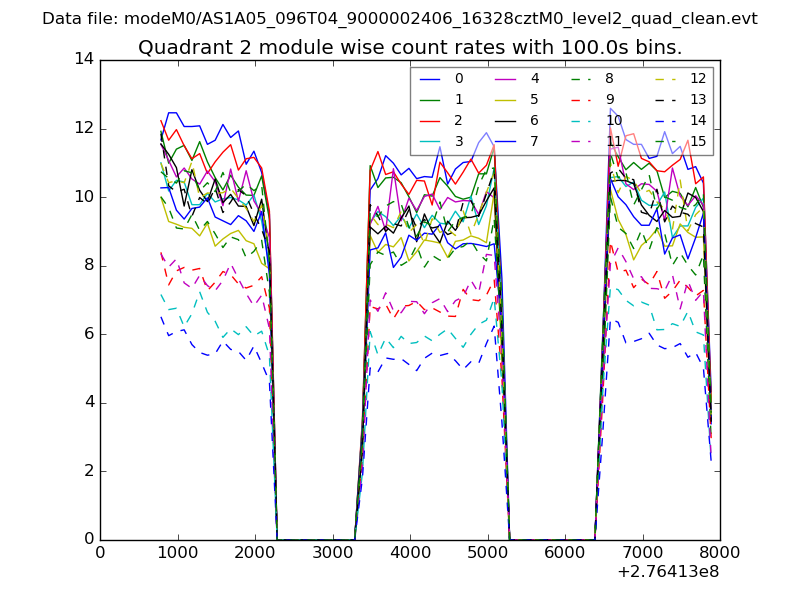
| Module-wise count rates for Quadrant C Data is divided into 100 sec bins |
 |
 |
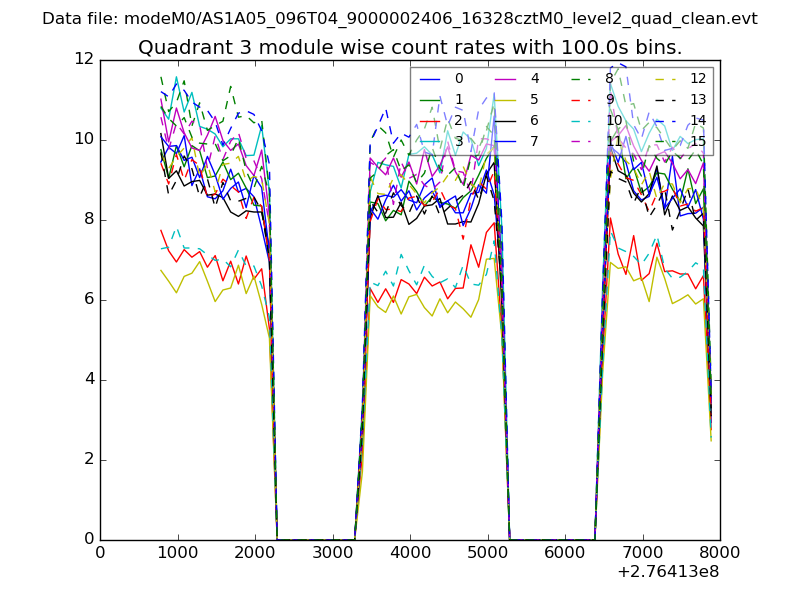
| Module-wise count rates for Quadrant D Data is divided into 100 sec bins |
 |
 |
| Parameter | Plot |
|---|---|
| CZT HV Monitor | 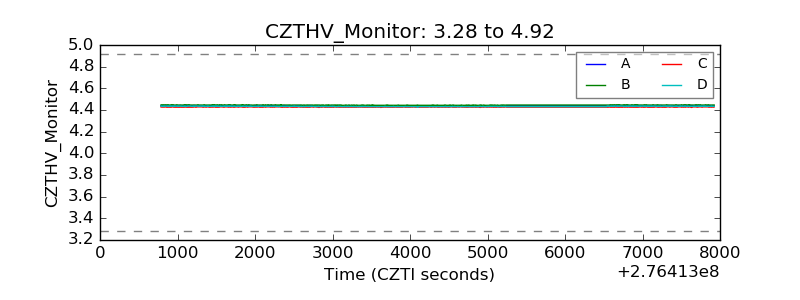 |
| D_VDD | 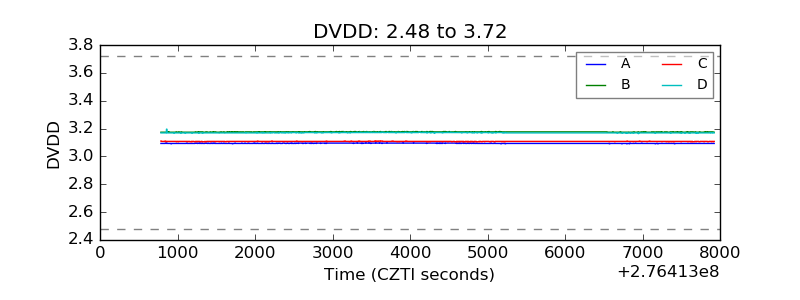 |
| Temperature 1 | 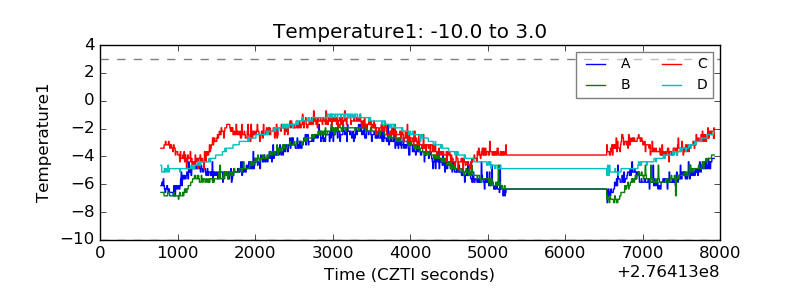 |
| Veto HV Monitor | 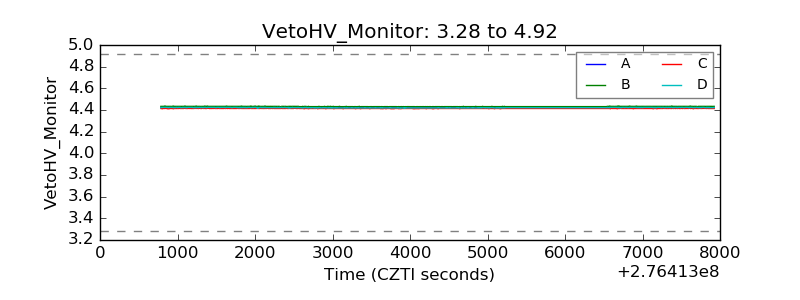 |
| Veto LLD | 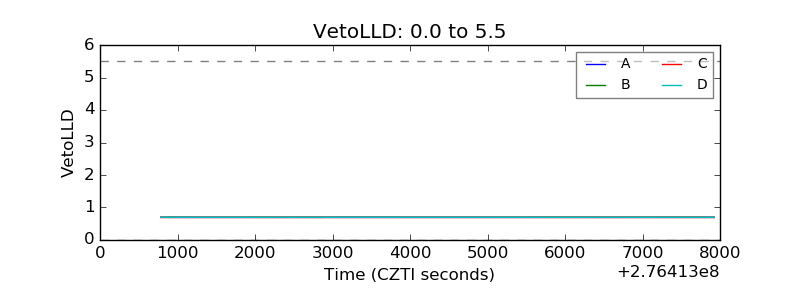 |
| Alpha Counter | 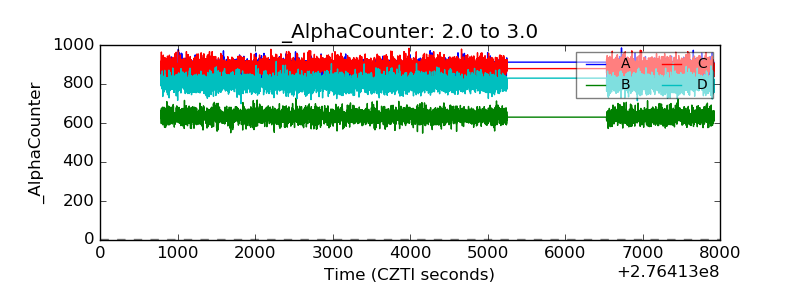 |
| _CPM_Rate | 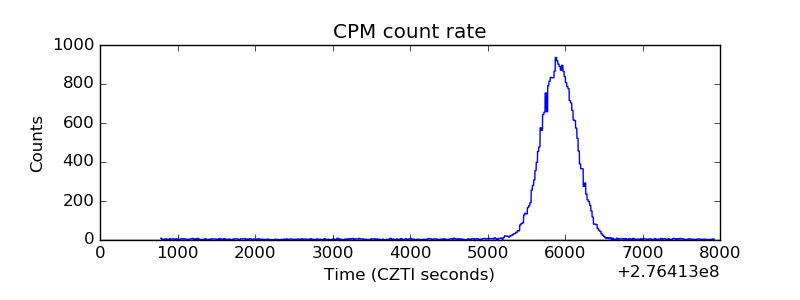 |
| CZT Counter | 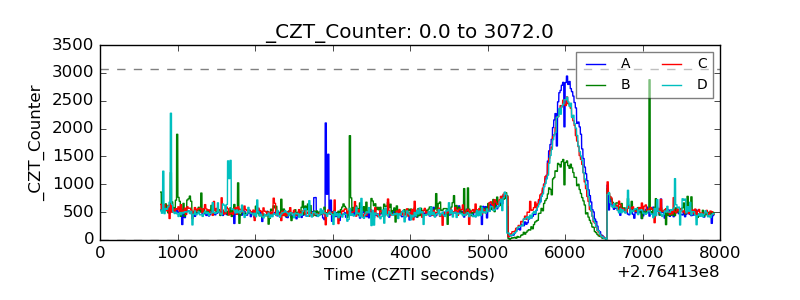 |
| +2.5 Volts monitor |  |
| +5 Volts monitor |  |
| _ROLL_ROT | 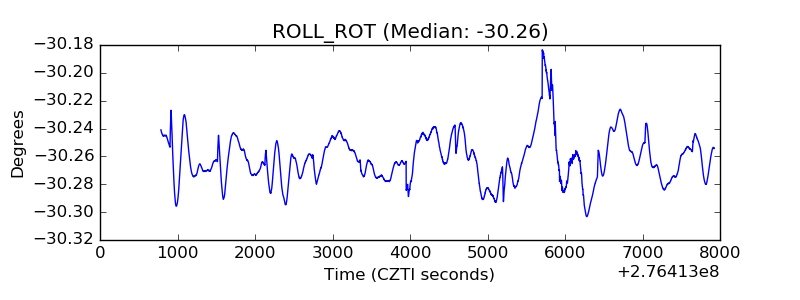 |
| _Roll_DEC | 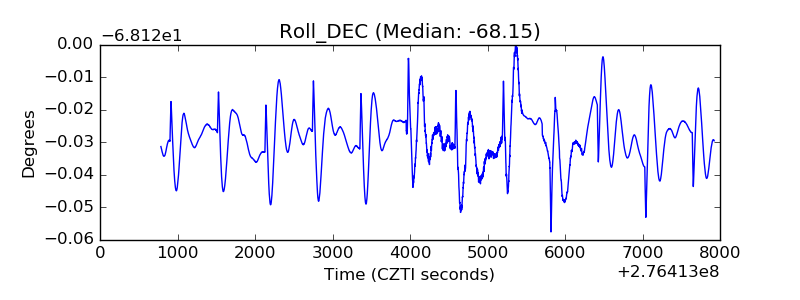 |
| _Roll_RA | 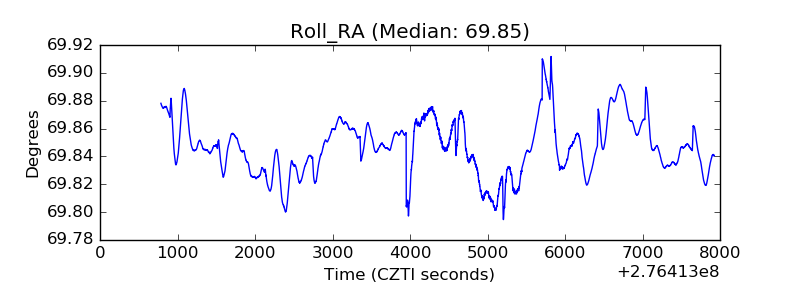 |
| Veto Counter | 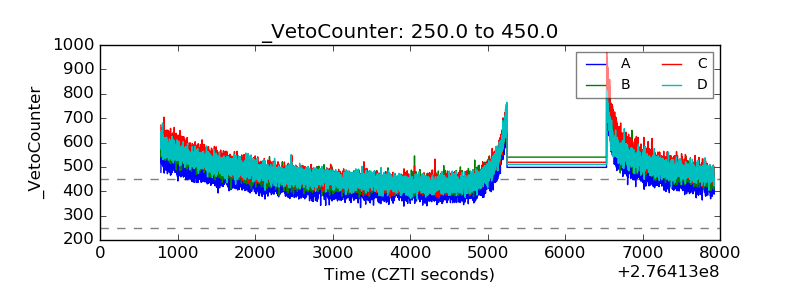 |