| Param | Original file | Final file |
|---|---|---|
| Filename | modeM0/AS1A05_096T04_9000002406_16329cztM0_level2.evt | modeM0/AS1A05_096T04_9000002406_16329cztM0_level2_quad_clean.evt |
| Size (bytes) | 429,984,000 | 96,978,240 |
| Size | 410.1 MB | 92.5 MB |
| Events in quadrant A | 2,908,226 | 629,031 |
| Events in quadrant B | 3,764,693 | 634,352 |
| Events in quadrant C | 3,044,688 | 629,973 |
| Events in quadrant D | 2,894,895 | 622,992 |
| Mode M0 | |||
|---|---|---|---|
| Quadrant | BADHDUFLAG | Total packets | Discarded packets |
| A | 0 | 12489 | 2 |
| B | 0 | 14895 | 1 |
| C | 0 | 12506 | 1 |
| D | 0 | 12530 | 1 |
| Mode SS | |||
|---|---|---|---|
| Quadrant | BADHDUFLAG | Total packets | Discarded packets |
| A | 0 | 122 | 0 |
| B | 0 | 122 | 0 |
| C | 0 | 122 | 0 |
| D | 0 | 122 | 0 |
| Mode M9 | |||
|---|---|---|---|
| Quadrant | BADHDUFLAG | Total packets | Discarded packets |
| A | 0 | 10 | 0 |
| B | 0 | 10 | 0 |
| C | 0 | 10 | 0 |
| D | 0 | 10 | 0 |
| Quadrant | Total seconds | Saturated seconds | Saturation percentage |
|---|---|---|---|
| A | 6023 | 107 | 1.776523% |
| B | 6023 | 255 | 4.233771% |
| C | 6023 | 133 | 2.208202% |
| D | 6023 | 86 | 1.427860% |
Noise dominated data is calculated using 1-second bins in cleaned event files. If a bin has >2000 counts, and if more than 50% of those come from <1% of pixels, then it is considered to be noise-dominated and hence unusable.
| Quadrant | # 1 sec bins | Bins with >0 counts | Bins with >2000 counts | High rate bins dominated by noise | Noise dominated (total time) | Noise dominated (detector-on time) | Marked lightcurve |
|---|---|---|---|---|---|---|---|
| A | 7019 | 6025 | 7 | 7 | 0.10% | 0.12% | 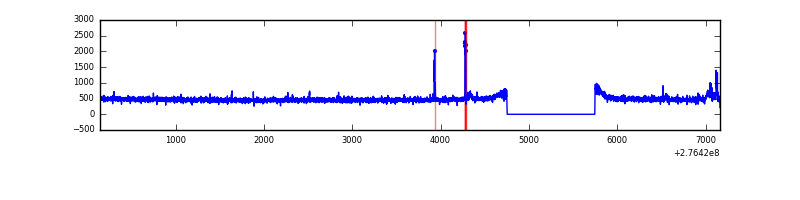 |
| B | 7019 | 6025 | 100 | 100 | 1.42% | 1.66% | 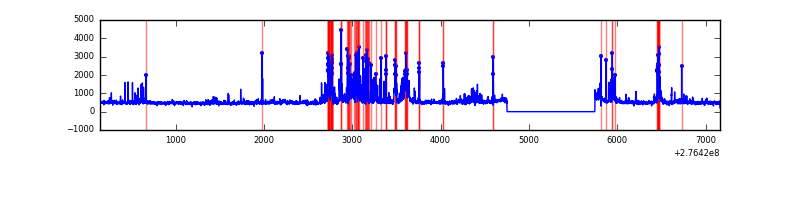 |
| C | 7019 | 6025 | 0 | 0 | 0.00% | 0.00% | 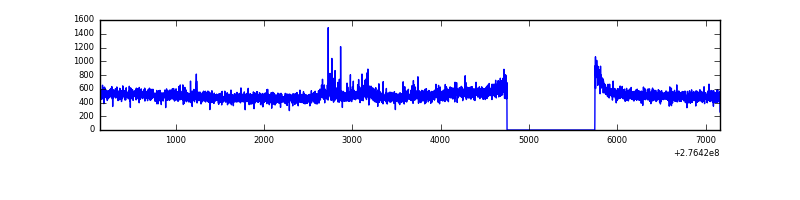 |
| D | 7019 | 6025 | 6 | 6 | 0.09% | 0.10% | 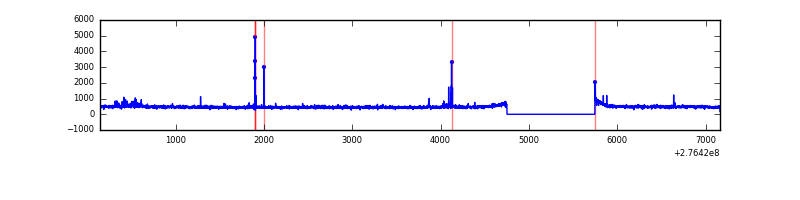 |
Top three noisy pixels from each quadrant. If the there are fewer than three noisy pixels in the level2.evt file, extra rows are filled as -1
| Pixel properties | Quadrant properties | ||||||
|---|---|---|---|---|---|---|---|
| Quadrant | DetID | PixID | Counts | Sigma | Mean | Median | Sigma |
| A | 15 | 174 | 70393 | 474.87 | 736 | 720 | 146.7 |
| A | 0 | 226 | 6588 | 39.99 | 736 | 720 | 146.7 |
| A | 12 | 194 | 5429 | 32.09 | 736 | 720 | 146.7 |
| B | 3 | 112 | 629694 | 4594.85 | 728 | 710 | 136.9 |
| B | 4 | 173 | 109248 | 792.89 | 728 | 710 | 136.9 |
| B | 0 | 189 | 50729 | 365.4 | 728 | 710 | 136.9 |
| C | 14 | 238 | 112117 | 670.17 | 720 | 724 | 166.2 |
| C | 3 | 233 | 103815 | 620.23 | 720 | 724 | 166.2 |
| C | 0 | 207 | 22273 | 129.65 | 720 | 724 | 166.2 |
| D | 1 | 52 | 35822 | 200.48 | 732 | 713 | 175.1 |
| D | 2 | 136 | 26060 | 144.74 | 732 | 713 | 175.1 |
| D | 2 | 234 | 25465 | 141.34 | 732 | 713 | 175.1 |
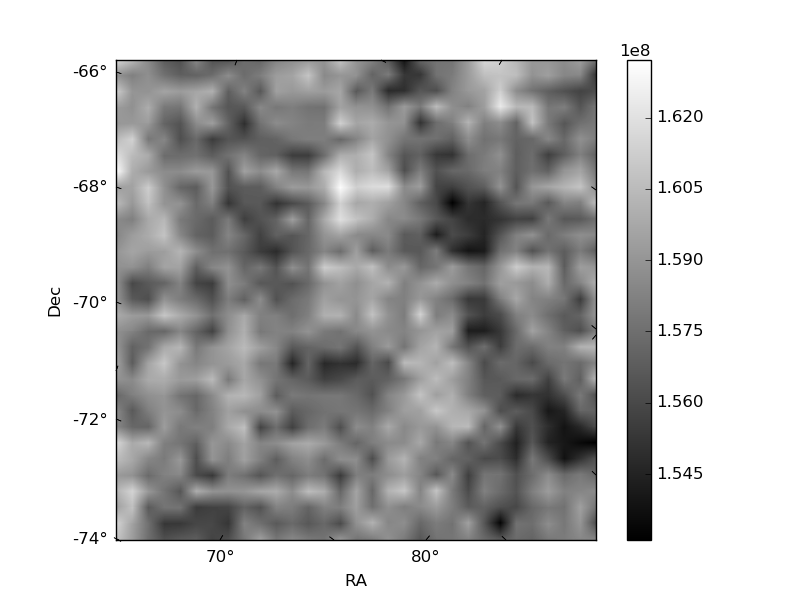
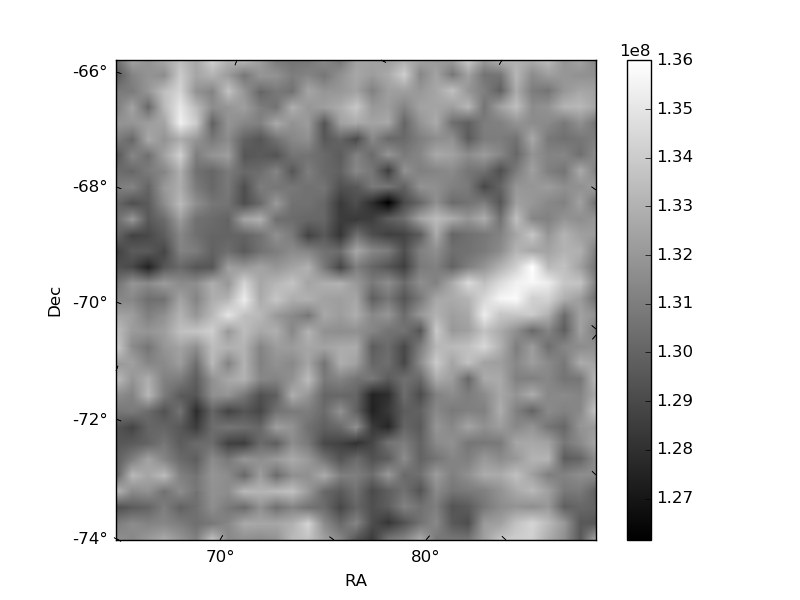
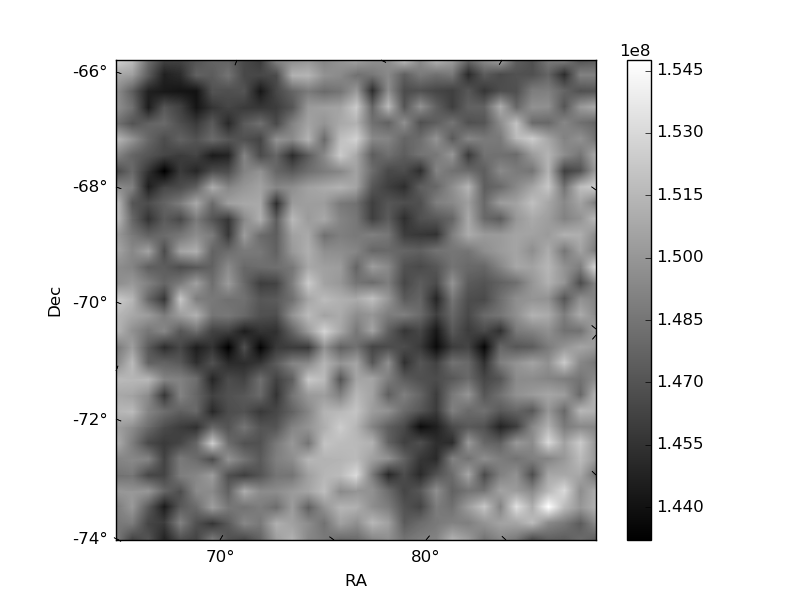
Histogram calculated using DETX and DETY for each event in the final _common_clean file
| Quadrant A | 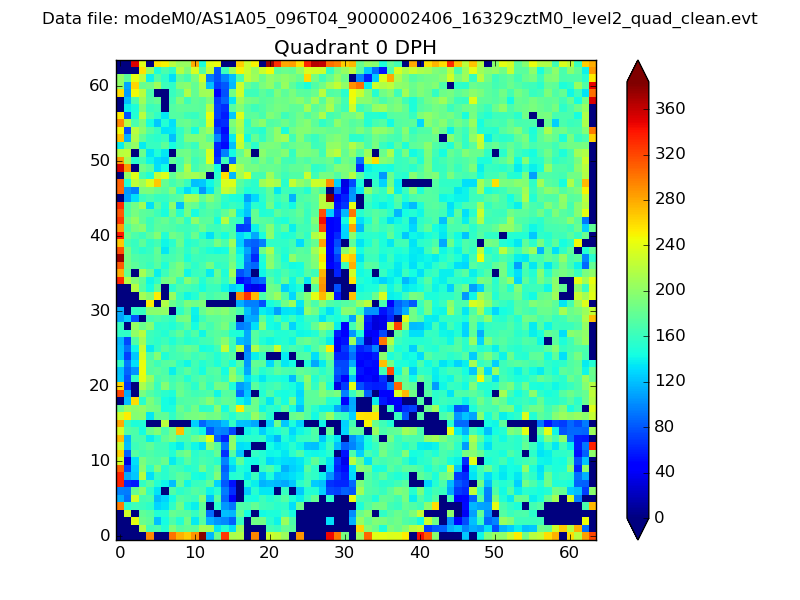 |
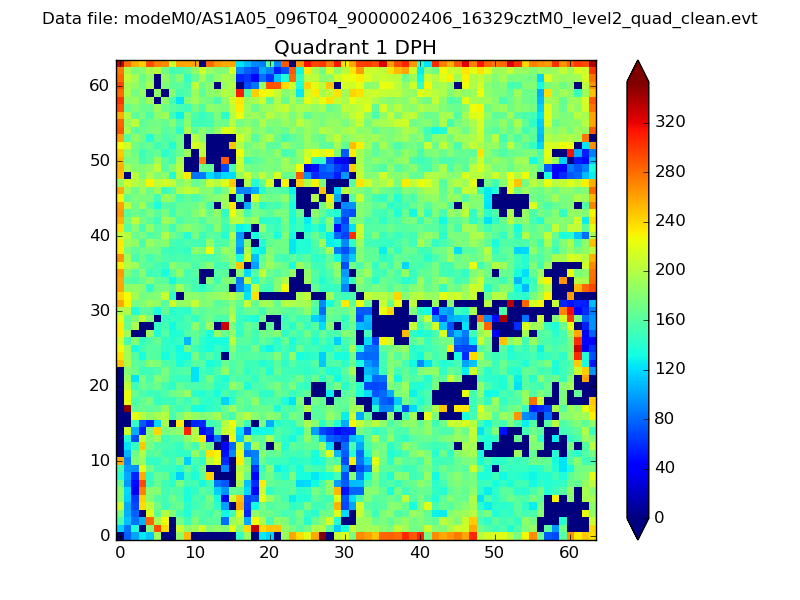 |
Quadrant B |
|---|---|---|---|
| Quadrant D | 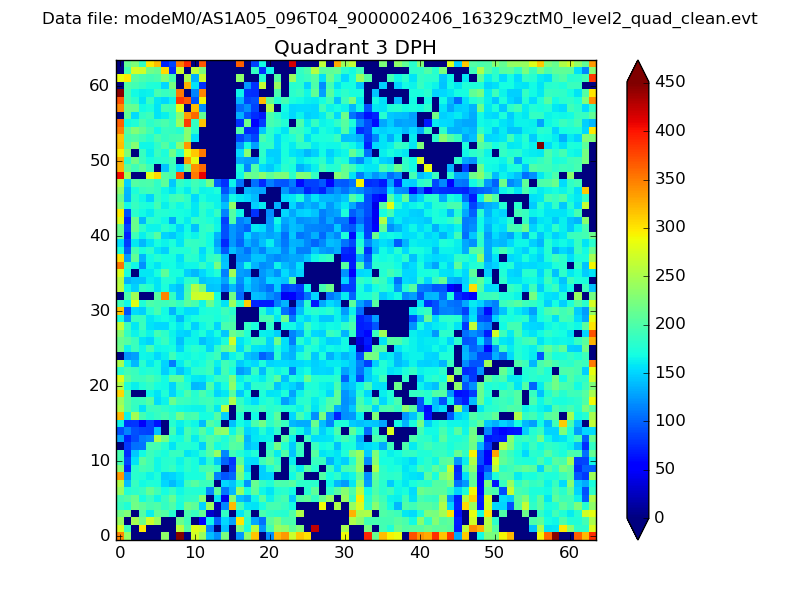 |
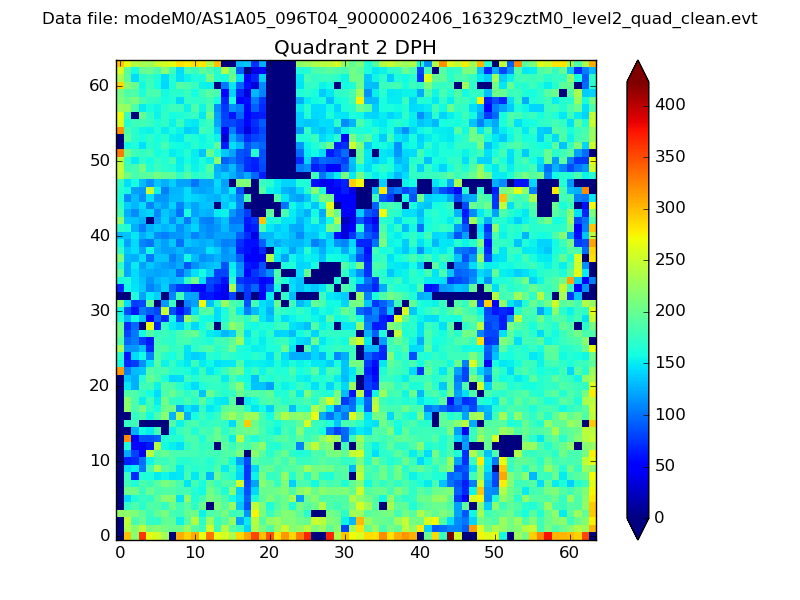 |
Quadrant C |
| Plot type | Count rate plots | Images |
|---|---|---|
| Comparison with Poisson distribution Blue bars denote a histogram of data divided into 1 sec bins. Red curve is a Poisson curve with rate = median count rate of data. |
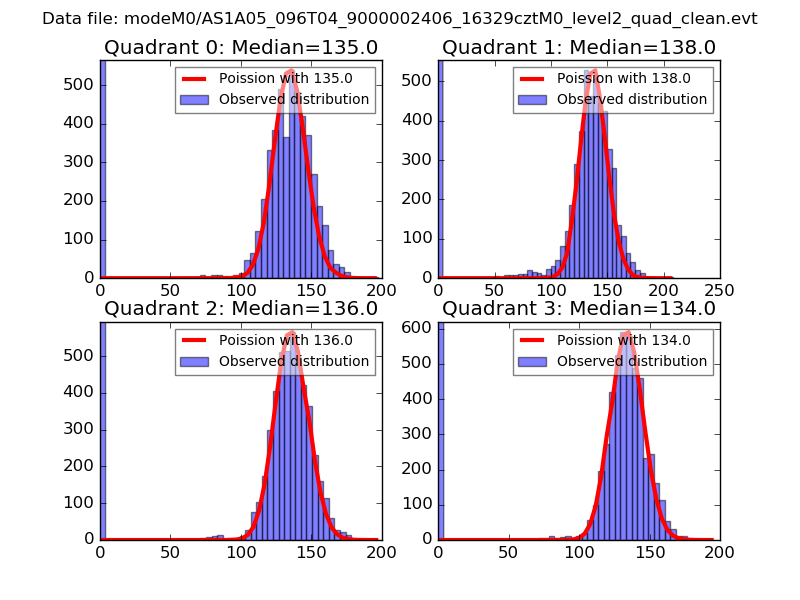 |
 |
| Quadrant-wise count rates Data is divided into 100 sec bins |
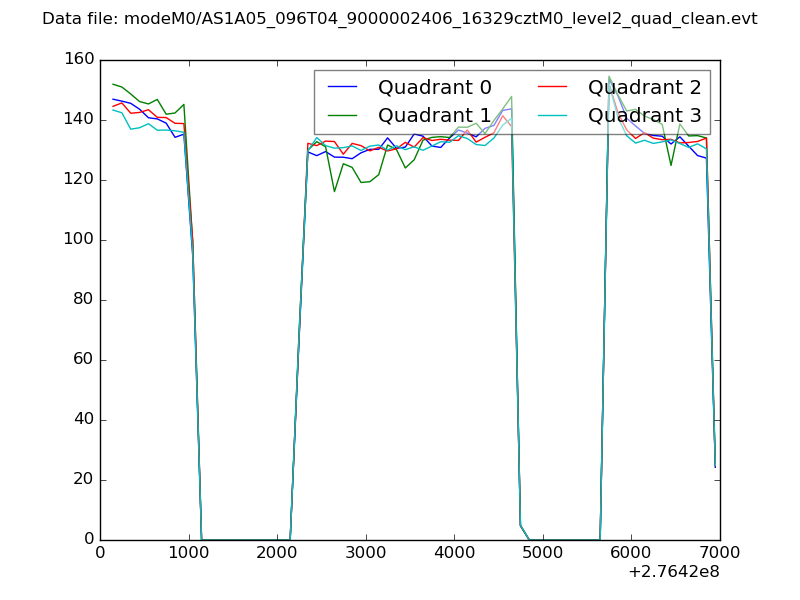 |
|
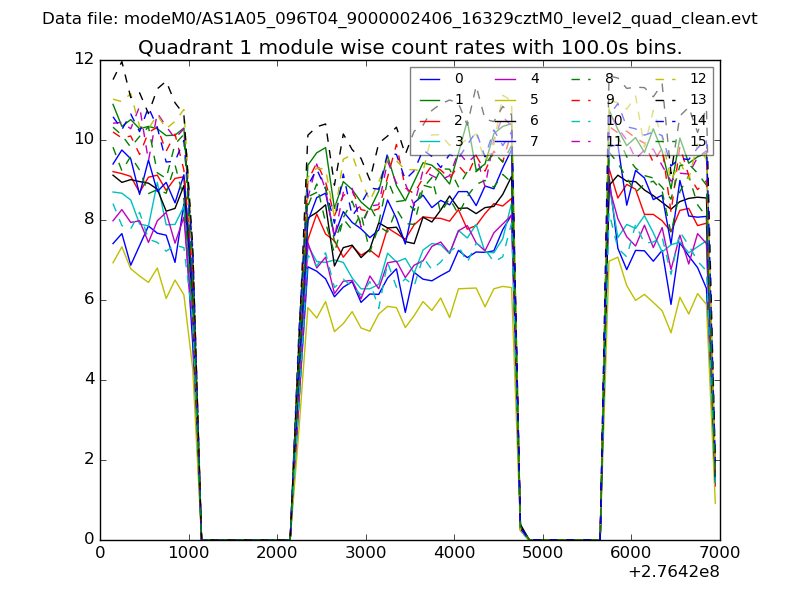
| Module-wise count rates for Quadrant A Data is divided into 100 sec bins |
 |
 |
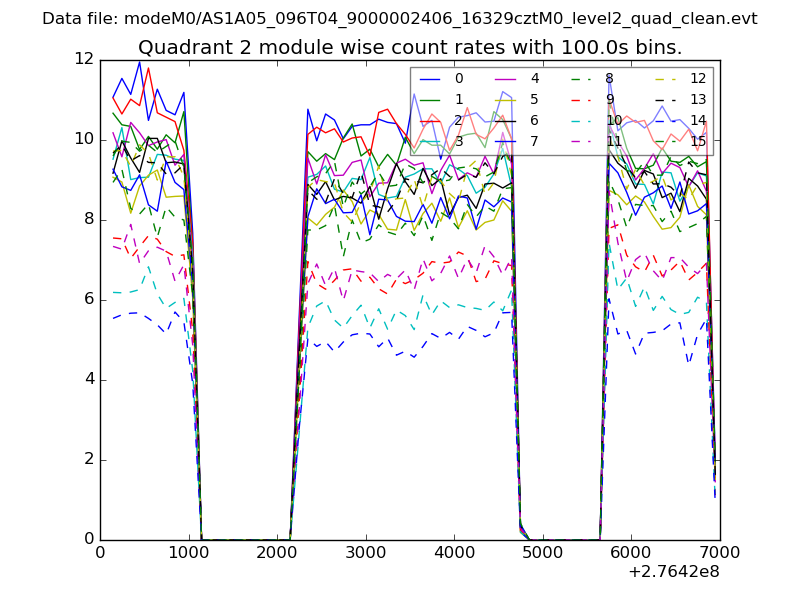
| Module-wise count rates for Quadrant B Data is divided into 100 sec bins |
 |
 |
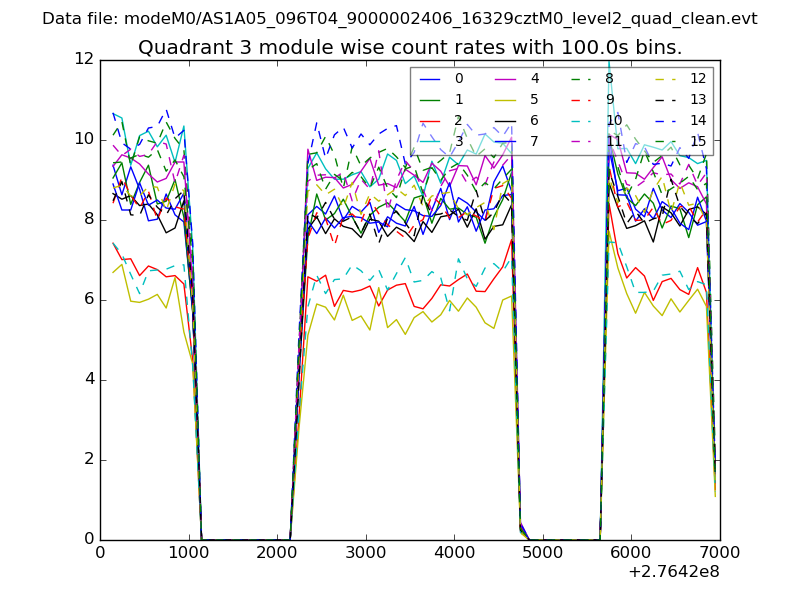
| Module-wise count rates for Quadrant C Data is divided into 100 sec bins |
 |
 |
| Module-wise count rates for Quadrant D Data is divided into 100 sec bins |
 |
 |
| Parameter | Plot |
|---|---|
| CZT HV Monitor | 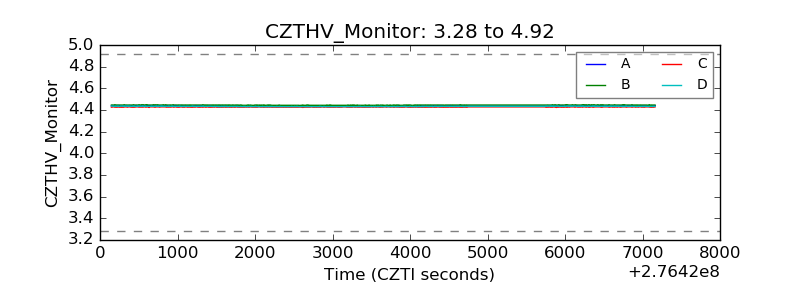 |
| D_VDD | 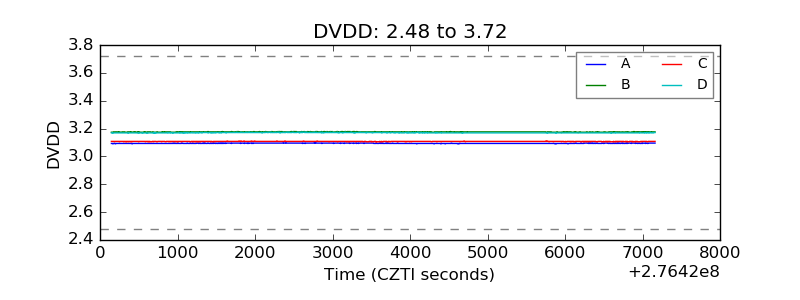 |
| Temperature 1 | 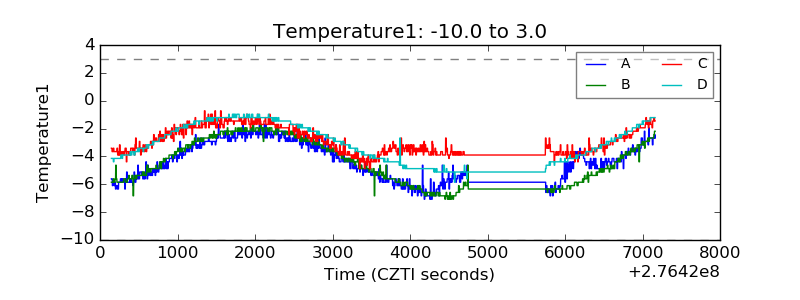 |
| Veto HV Monitor | 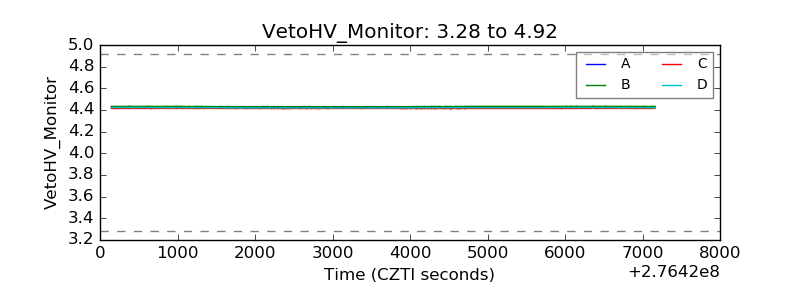 |
| Veto LLD | 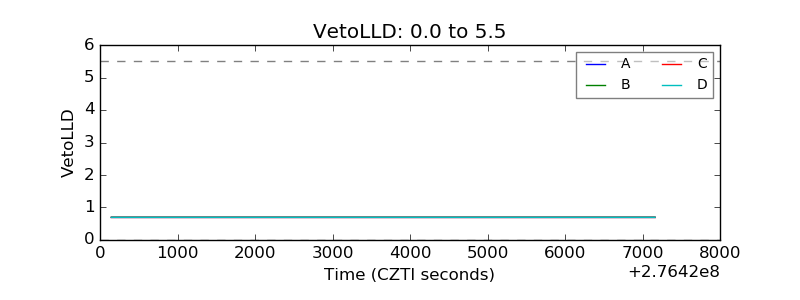 |
| Alpha Counter | 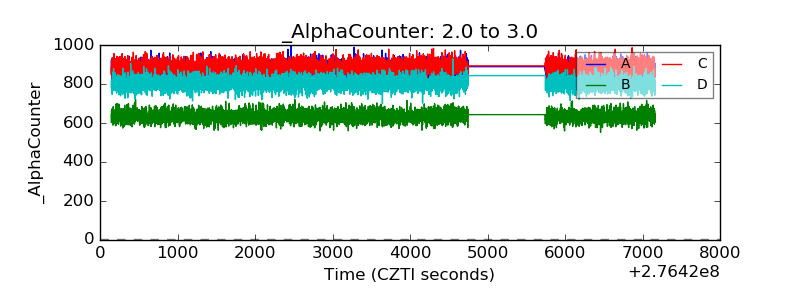 |
| _CPM_Rate | 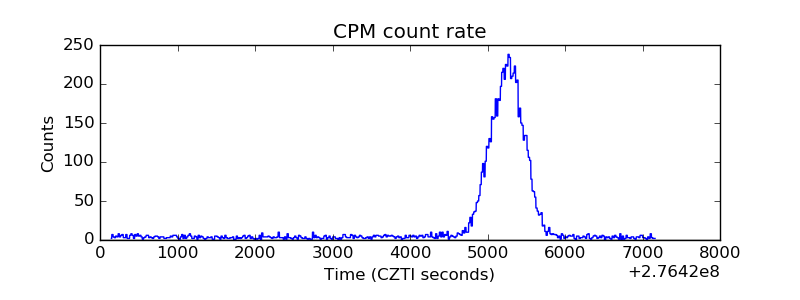 |
| CZT Counter | 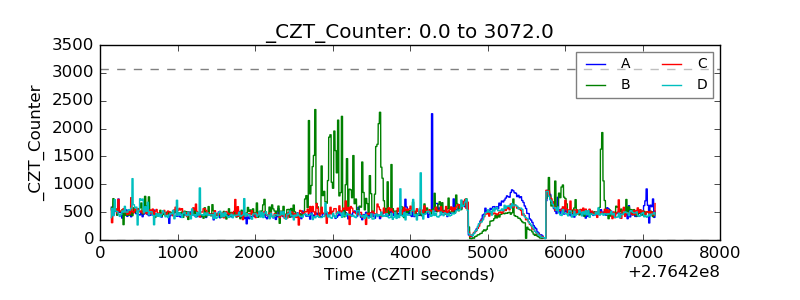 |
| +2.5 Volts monitor |  |
| +5 Volts monitor |  |
| _ROLL_ROT | 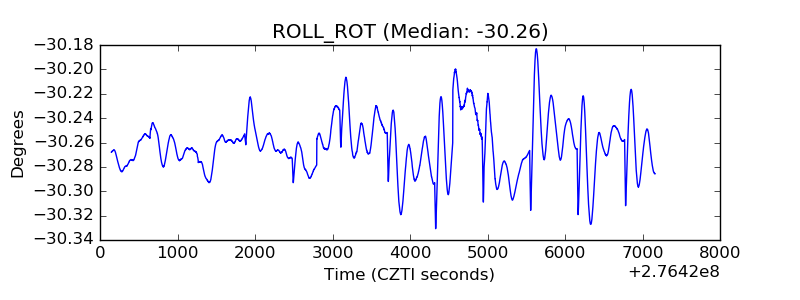 |
| _Roll_DEC | 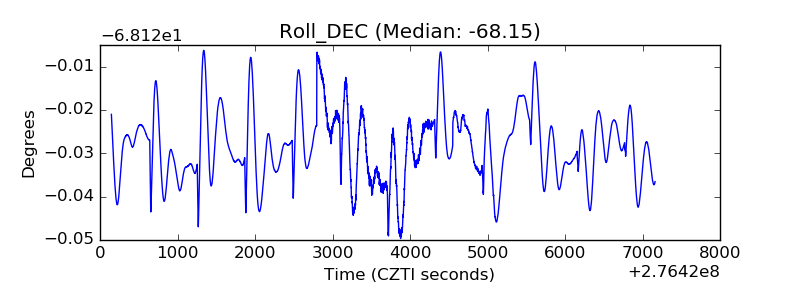 |
| _Roll_RA | 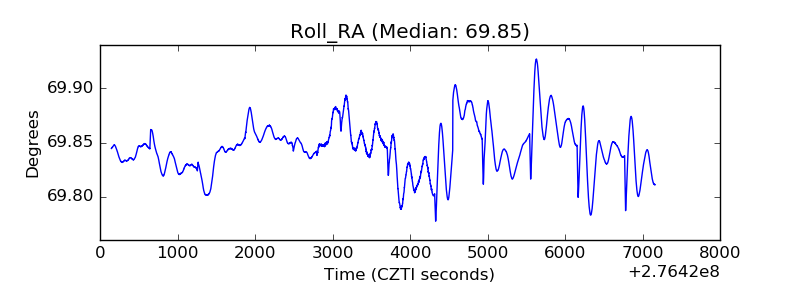 |
| Veto Counter | 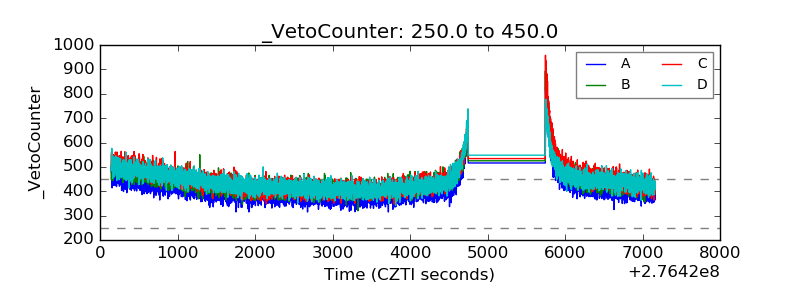 |