| Param | Original file | Final file |
|---|---|---|
| Filename | modeM0/AS1A05_096T04_9000002406_16330cztM0_level2.evt | modeM0/AS1A05_096T04_9000002406_16330cztM0_level2_quad_clean.evt |
| Size (bytes) | 246,306,240 | 49,173,120 |
| Size | 234.9 MB | 46.9 MB |
| Events in quadrant A | 1,764,451 | 306,623 |
| Events in quadrant B | 1,955,766 | 312,629 |
| Events in quadrant C | 1,650,340 | 311,240 |
| Events in quadrant D | 1,844,156 | 304,969 |
| Mode M0 | |||
|---|---|---|---|
| Quadrant | BADHDUFLAG | Total packets | Discarded packets |
| A | 0 | 7593 | 0 |
| B | 0 | 7995 | 0 |
| C | 0 | 7179 | 0 |
| D | 0 | 7870 | 0 |
| Mode SS | |||
|---|---|---|---|
| Quadrant | BADHDUFLAG | Total packets | Discarded packets |
| A | 0 | 72 | 0 |
| B | 0 | 72 | 0 |
| C | 0 | 72 | 0 |
| D | 0 | 72 | 0 |
| Quadrant | Total seconds | Saturated seconds | Saturation percentage |
|---|---|---|---|
| A | 3574 | 17 | 0.475658% |
| B | 3574 | 71 | 1.986570% |
| C | 3574 | 9 | 0.251819% |
| D | 3574 | 33 | 0.923335% |
Noise dominated data is calculated using 1-second bins in cleaned event files. If a bin has >2000 counts, and if more than 50% of those come from <1% of pixels, then it is considered to be noise-dominated and hence unusable.
| Quadrant | # 1 sec bins | Bins with >0 counts | Bins with >2000 counts | High rate bins dominated by noise | Noise dominated (total time) | Noise dominated (detector-on time) | Marked lightcurve |
|---|---|---|---|---|---|---|---|
| A | 3575 | 3575 | 7 | 7 | 0.20% | 0.20% |  |
| B | 3575 | 3575 | 40 | 40 | 1.12% | 1.12% | 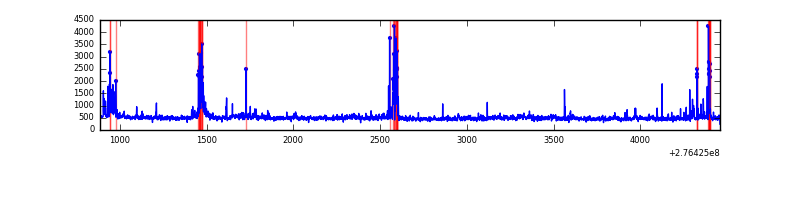 |
| C | 3575 | 3575 | 0 | 0 | 0.00% | 0.00% | 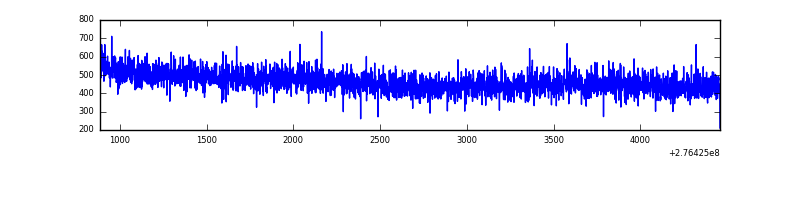 |
| D | 3575 | 3575 | 27 | 27 | 0.76% | 0.76% | 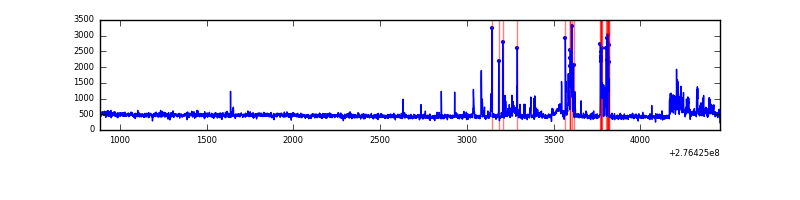 |
Top three noisy pixels from each quadrant. If the there are fewer than three noisy pixels in the level2.evt file, extra rows are filled as -1
| Pixel properties | Quadrant properties | ||||||
|---|---|---|---|---|---|---|---|
| Quadrant | DetID | PixID | Counts | Sigma | Mean | Median | Sigma |
| A | 15 | 174 | 164930 | 1981.63 | 413 | 405 | 83.0 |
| A | 13 | 210 | 5113 | 56.71 | 413 | 405 | 83.0 |
| A | 3 | 1 | 3821 | 41.14 | 413 | 405 | 83.0 |
| B | 3 | 112 | 104091 | 1321.29 | 409 | 400 | 78.5 |
| B | 4 | 173 | 102805 | 1304.9 | 409 | 400 | 78.5 |
| B | 0 | 189 | 40200 | 507.15 | 409 | 400 | 78.5 |
| C | 14 | 238 | 63310 | 667.83 | 402 | 404 | 94.2 |
| C | 3 | 233 | 20431 | 212.61 | 402 | 404 | 94.2 |
| C | 13 | 61 | 2823 | 25.68 | 402 | 404 | 94.2 |
| D | 10 | 70 | 115592 | 1164.2 | 409 | 399 | 98.9 |
| D | 1 | 52 | 88237 | 887.73 | 409 | 399 | 98.9 |
| D | 12 | 144 | 79975 | 804.23 | 409 | 399 | 98.9 |
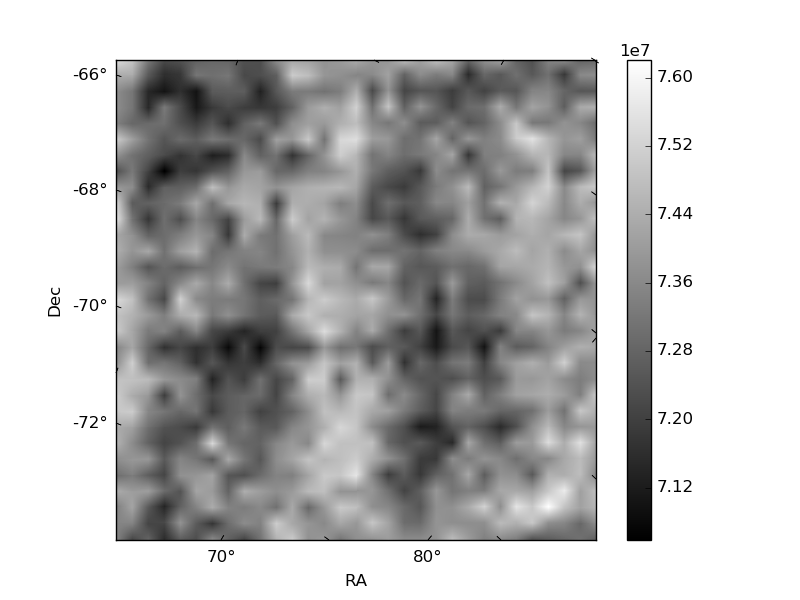
Histogram calculated using DETX and DETY for each event in the final _common_clean file
| Quadrant A | 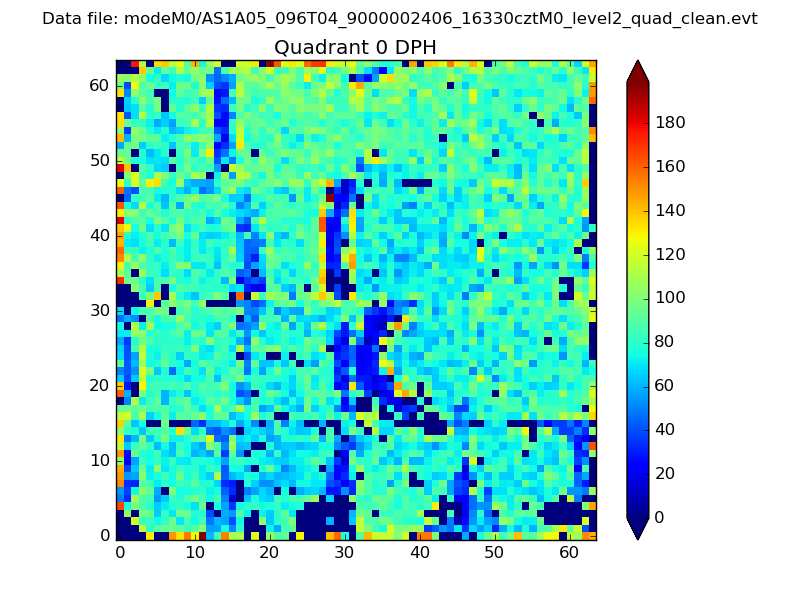 |
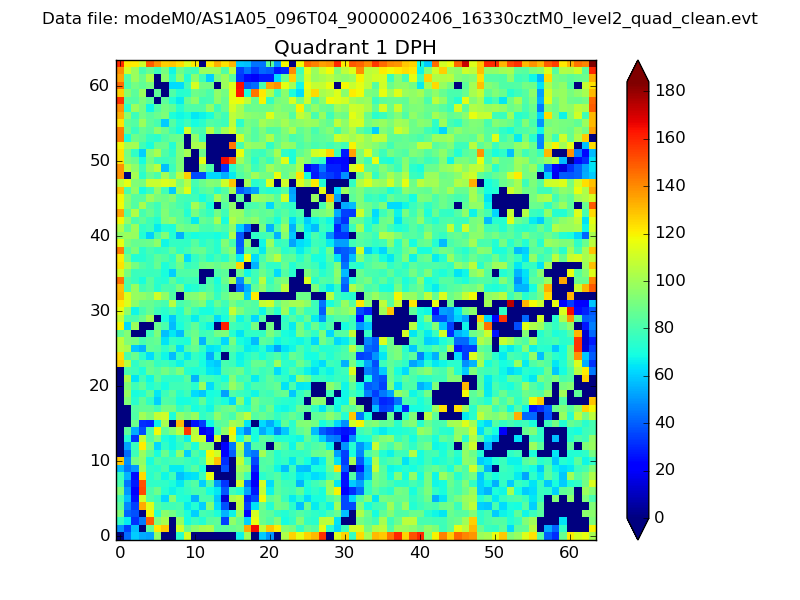 |
Quadrant B |
|---|---|---|---|
| Quadrant D | 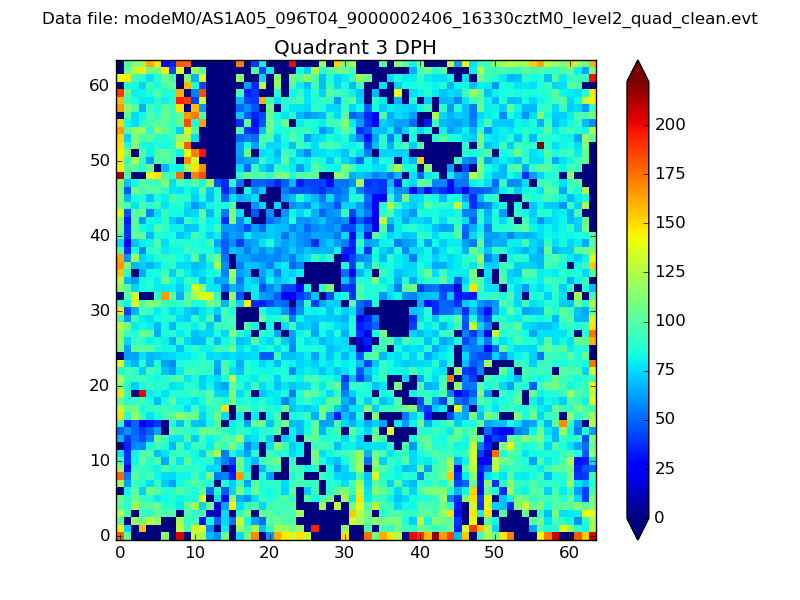 |
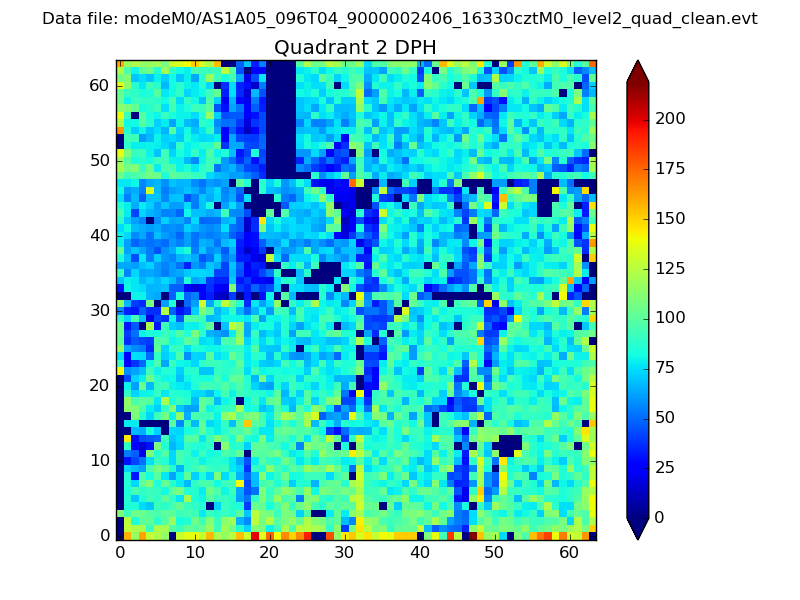 |
Quadrant C |
| Plot type | Count rate plots | Images |
|---|---|---|
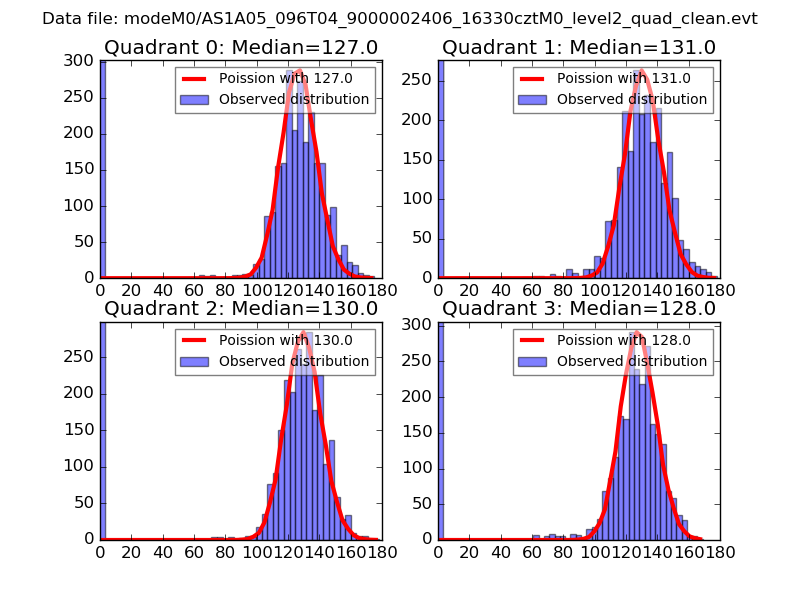
| Comparison with Poisson distribution Blue bars denote a histogram of data divided into 1 sec bins. Red curve is a Poisson curve with rate = median count rate of data. |
 |
 |
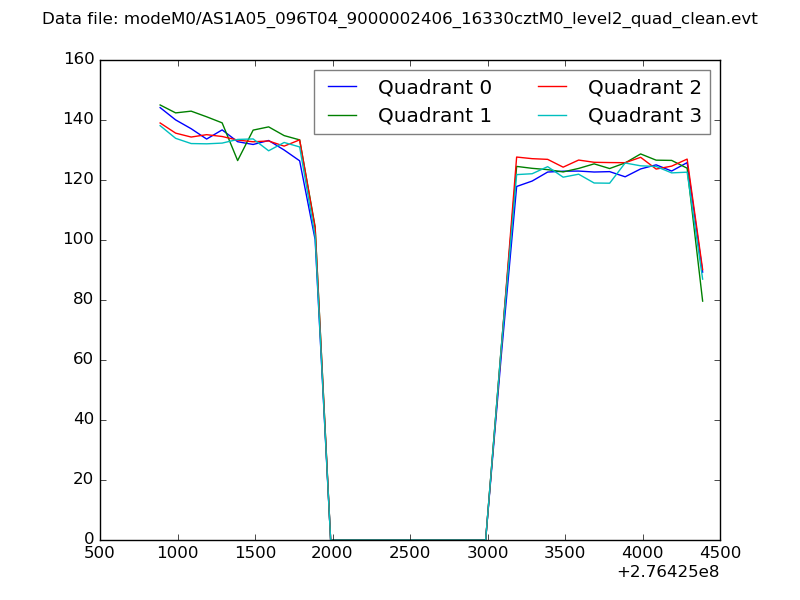
| Quadrant-wise count rates Data is divided into 100 sec bins |
 |
|
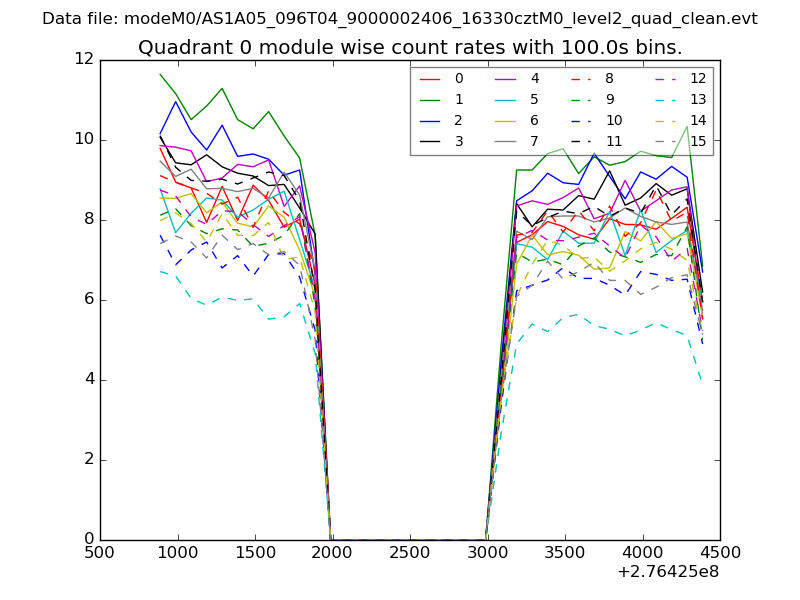
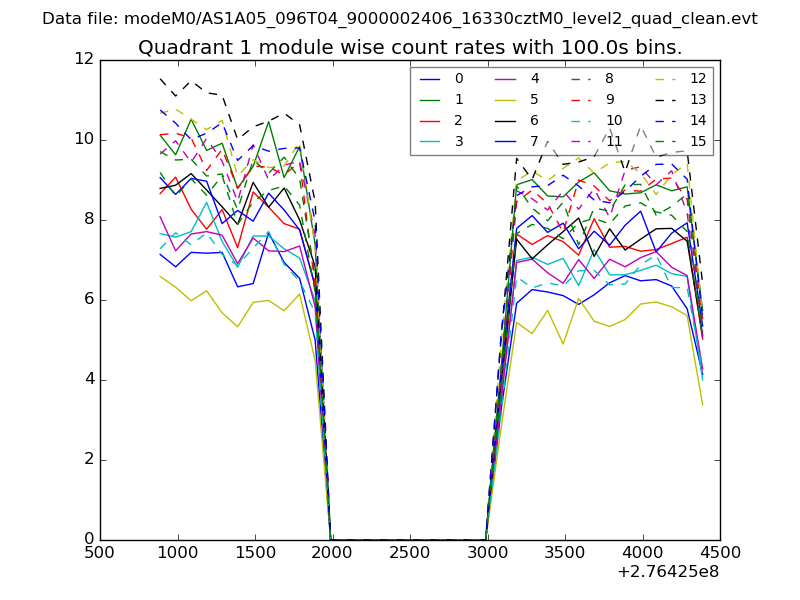
| Module-wise count rates for Quadrant A Data is divided into 100 sec bins |
 |
 |
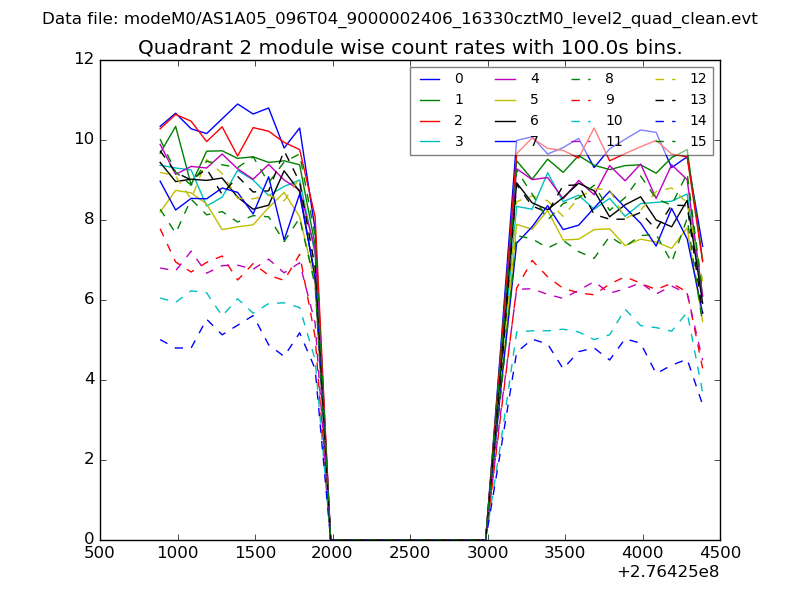
| Module-wise count rates for Quadrant B Data is divided into 100 sec bins |
 |
 |
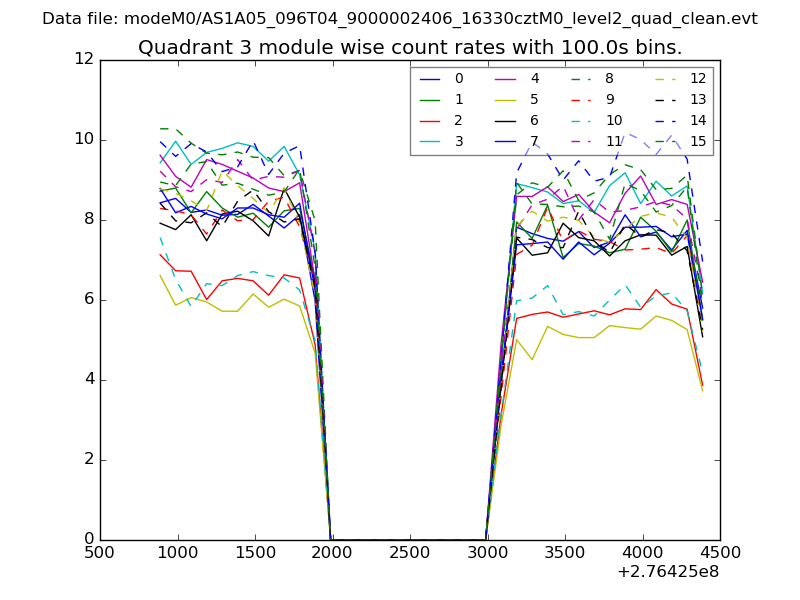
| Module-wise count rates for Quadrant C Data is divided into 100 sec bins |
 |
 |
| Module-wise count rates for Quadrant D Data is divided into 100 sec bins |
 |
 |
| Parameter | Plot |
|---|---|
| CZT HV Monitor | 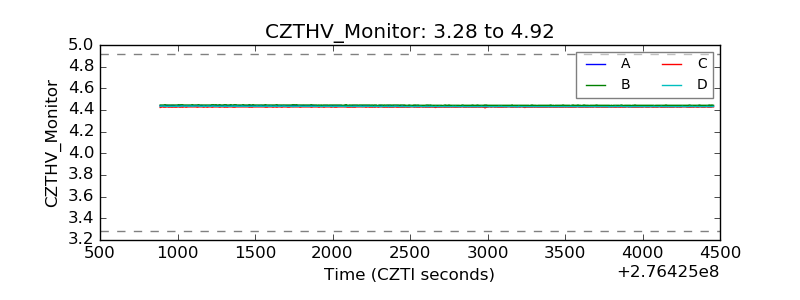 |
| D_VDD |  |
| Temperature 1 | 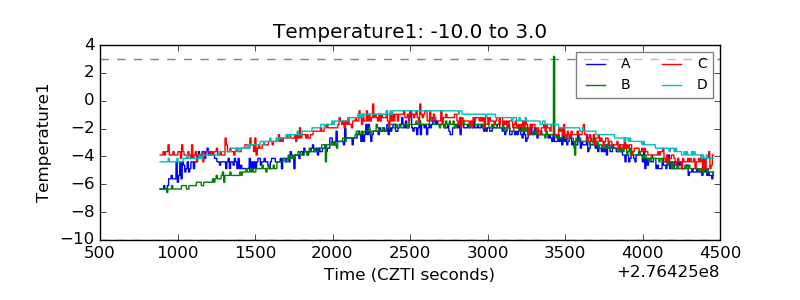 |
| Veto HV Monitor | 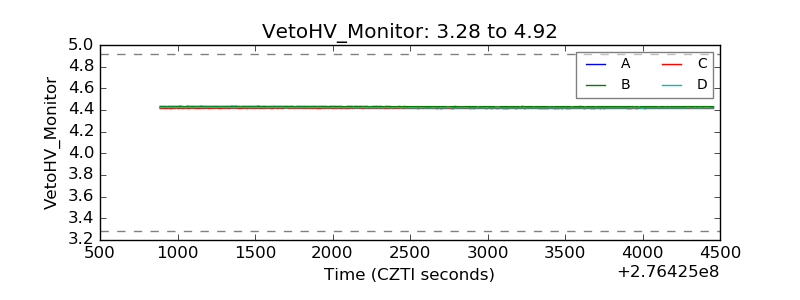 |
| Veto LLD | 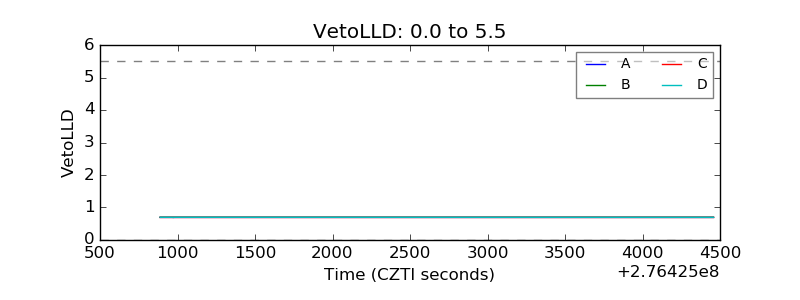 |
| Alpha Counter | 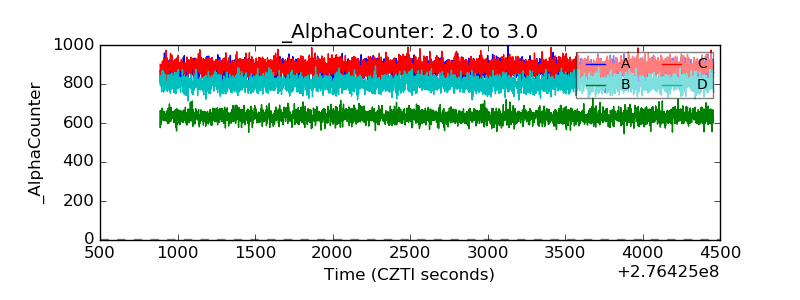 |
| _CPM_Rate | 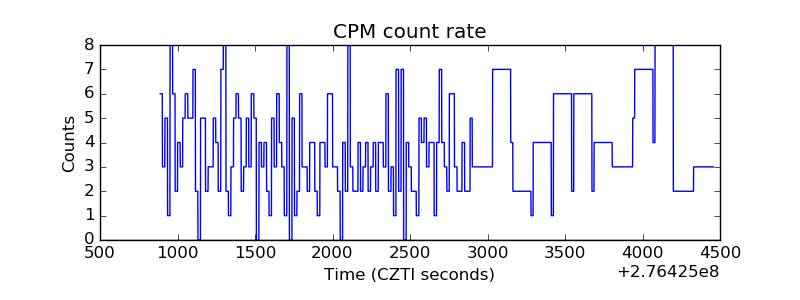 |
| CZT Counter | 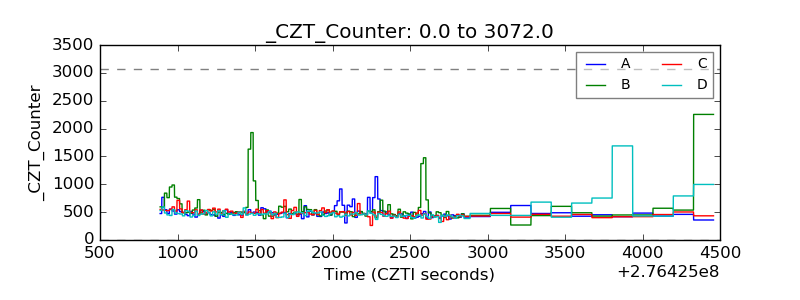 |
| +2.5 Volts monitor |  |
| +5 Volts monitor |  |
| _ROLL_ROT | 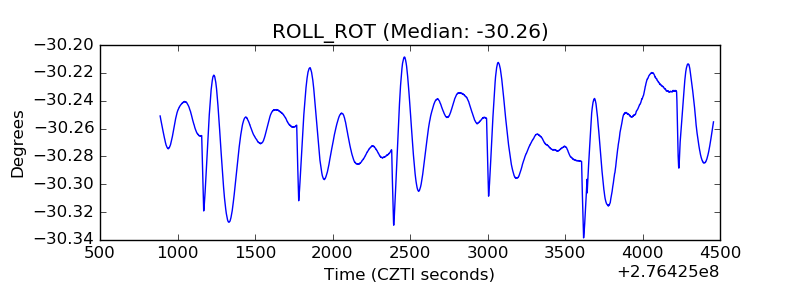 |
| _Roll_DEC | 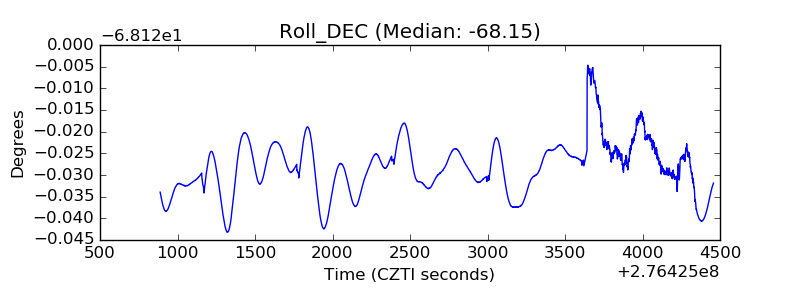 |
| _Roll_RA | 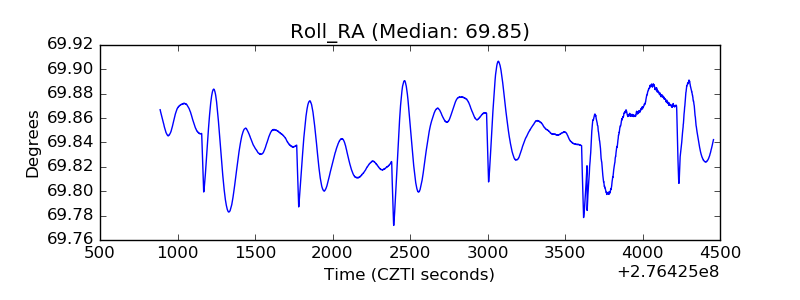 |
| Veto Counter | 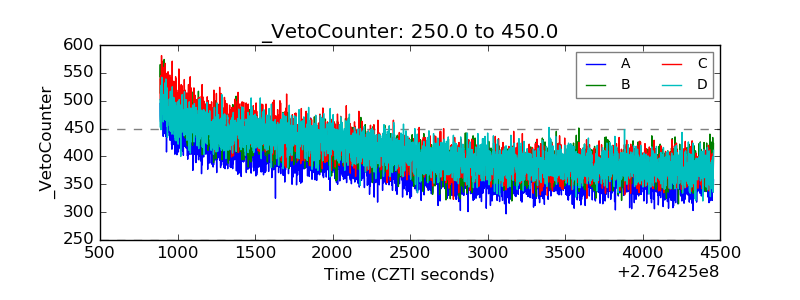 |