| Param | Original file | Final file |
|---|---|---|
| Filename | modeM0/AS1A05_101T01_9000002412_16339cztM0_level2.evt | modeM0/AS1A05_101T01_9000002412_16339cztM0_level2_quad_clean.evt |
| Size (bytes) | 465,647,040 | 91,676,160 |
| Size | 444.1 MB | 87.4 MB |
| Events in quadrant A | 3,367,099 | 575,785 |
| Events in quadrant B | 3,986,654 | 590,328 |
| Events in quadrant C | 3,267,849 | 587,292 |
| Events in quadrant D | 3,038,705 | 569,357 |
| Mode SS | |||
|---|---|---|---|
| Quadrant | BADHDUFLAG | Total packets | Discarded packets |
| A | 0 | 132 | 0 |
| B | 0 | 132 | 0 |
| C | 0 | 132 | 0 |
| D | 0 | 132 | 0 |
| Mode M0 | |||
|---|---|---|---|
| Quadrant | BADHDUFLAG | Total packets | Discarded packets |
| A | 0 | 14266 | 3 |
| B | 0 | 16018 | 2 |
| C | 0 | 13595 | 2 |
| D | 0 | 13392 | 2 |
| Mode M9 | |||
|---|---|---|---|
| Quadrant | BADHDUFLAG | Total packets | Discarded packets |
| A | 0 | 19 | 0 |
| B | 0 | 19 | 0 |
| C | 0 | 19 | 0 |
| D | 0 | 20 | 0 |
| Quadrant | Total seconds | Saturated seconds | Saturation percentage |
|---|---|---|---|
| A | 6502 | 93 | 1.430329% |
| B | 6502 | 194 | 2.983697% |
| C | 6502 | 44 | 0.676715% |
| D | 6502 | 16 | 0.246078% |
Noise dominated data is calculated using 1-second bins in cleaned event files. If a bin has >2000 counts, and if more than 50% of those come from <1% of pixels, then it is considered to be noise-dominated and hence unusable.
| Quadrant | # 1 sec bins | Bins with >0 counts | Bins with >2000 counts | High rate bins dominated by noise | Noise dominated (total time) | Noise dominated (detector-on time) | Marked lightcurve |
|---|---|---|---|---|---|---|---|
| A | 7733 | 6504 | 68 | 68 | 0.88% | 1.05% | 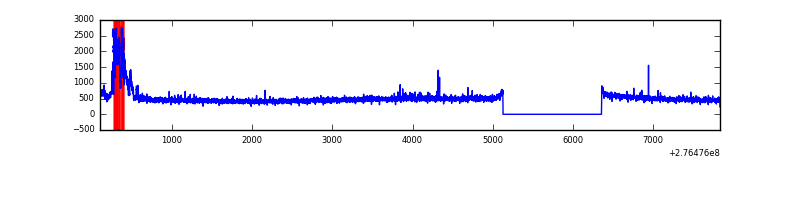 |
| B | 7733 | 6504 | 122 | 122 | 1.58% | 1.88% | 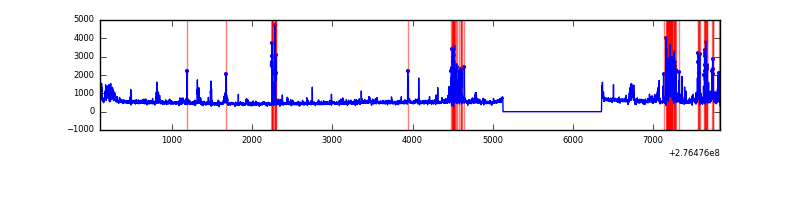 |
| C | 7733 | 6504 | 0 | 0 | 0.00% | 0.00% | 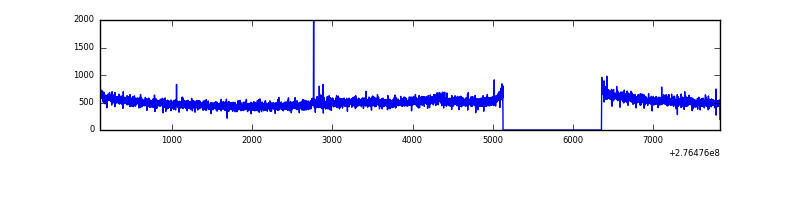 |
| D | 7733 | 6504 | 5 | 5 | 0.06% | 0.08% | 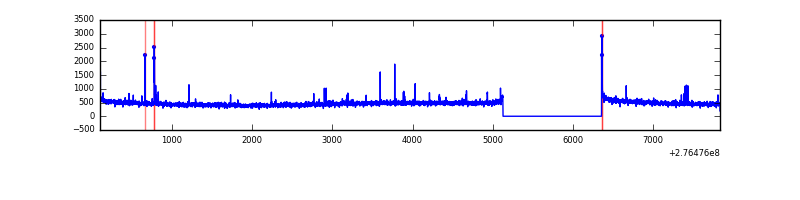 |
Top three noisy pixels from each quadrant. If the there are fewer than three noisy pixels in the level2.evt file, extra rows are filled as -1
| Pixel properties | Quadrant properties | ||||||
|---|---|---|---|---|---|---|---|
| Quadrant | DetID | PixID | Counts | Sigma | Mean | Median | Sigma |
| A | 15 | 174 | 289401 | 1805.0 | 798 | 783 | 159.9 |
| A | 0 | 226 | 6947 | 38.55 | 798 | 783 | 159.9 |
| A | 12 | 194 | 5862 | 31.76 | 798 | 783 | 159.9 |
| B | 3 | 112 | 408186 | 2733.43 | 803 | 783 | 149.0 |
| B | 4 | 173 | 154700 | 1032.69 | 803 | 783 | 149.0 |
| B | 15 | 35 | 111146 | 740.47 | 803 | 783 | 149.0 |
| C | 14 | 238 | 123738 | 679.99 | 786 | 791 | 180.8 |
| C | 3 | 233 | 77251 | 422.88 | 786 | 791 | 180.8 |
| C | 13 | 61 | 5547 | 26.3 | 786 | 791 | 180.8 |
| D | 10 | 70 | 28802 | 148.92 | 786 | 766 | 188.3 |
| D | 12 | 218 | 27392 | 141.43 | 786 | 766 | 188.3 |
| D | 2 | 234 | 23243 | 119.39 | 786 | 766 | 188.3 |
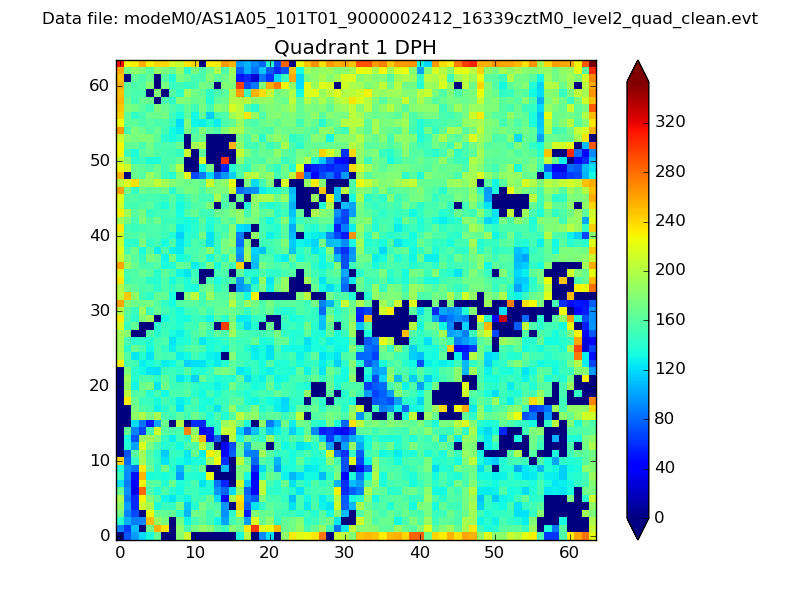
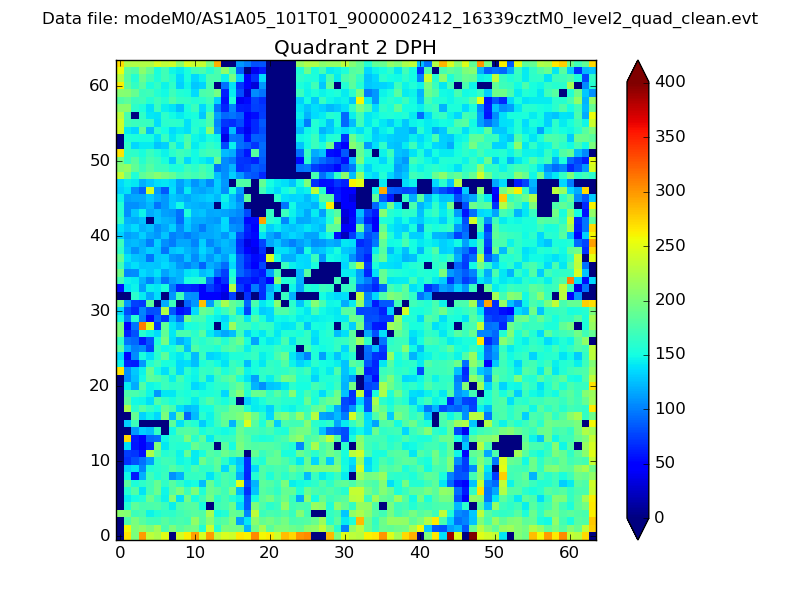
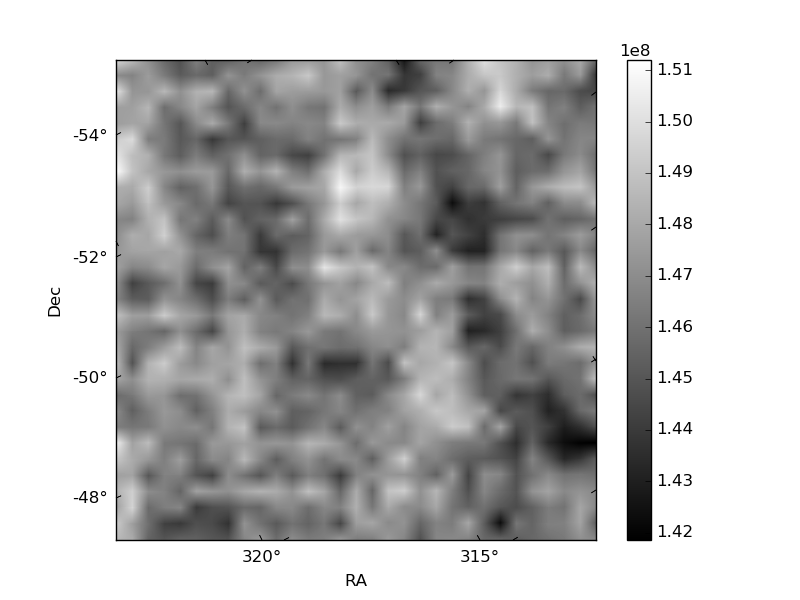
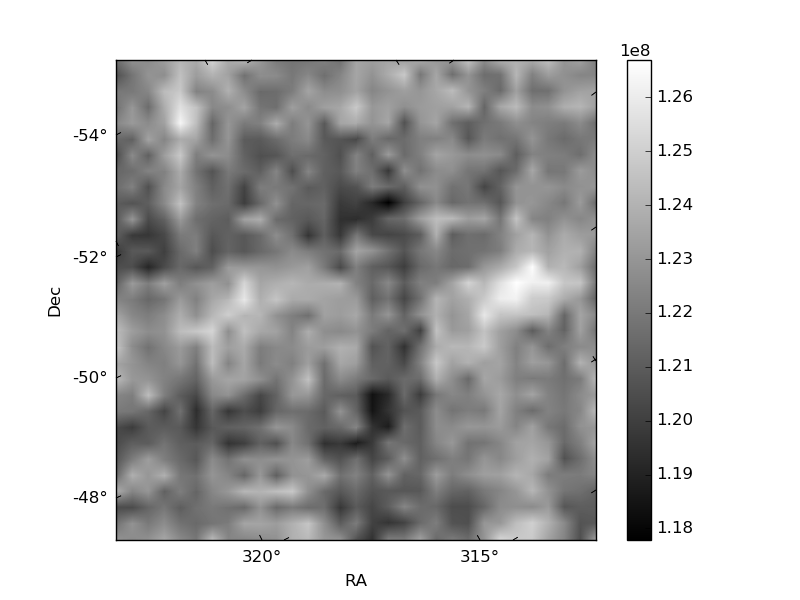
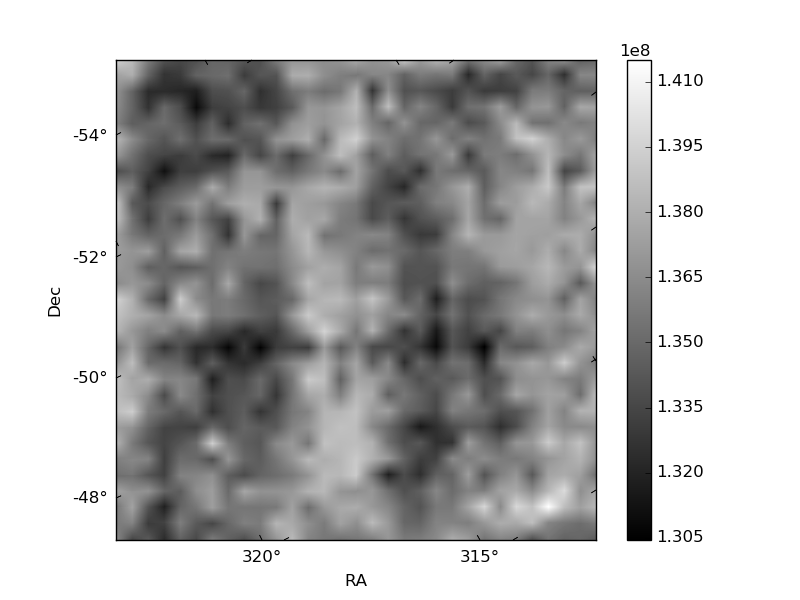
Histogram calculated using DETX and DETY for each event in the final _common_clean file
| Quadrant A |  |
 |
Quadrant B |
|---|---|---|---|
| Quadrant D | 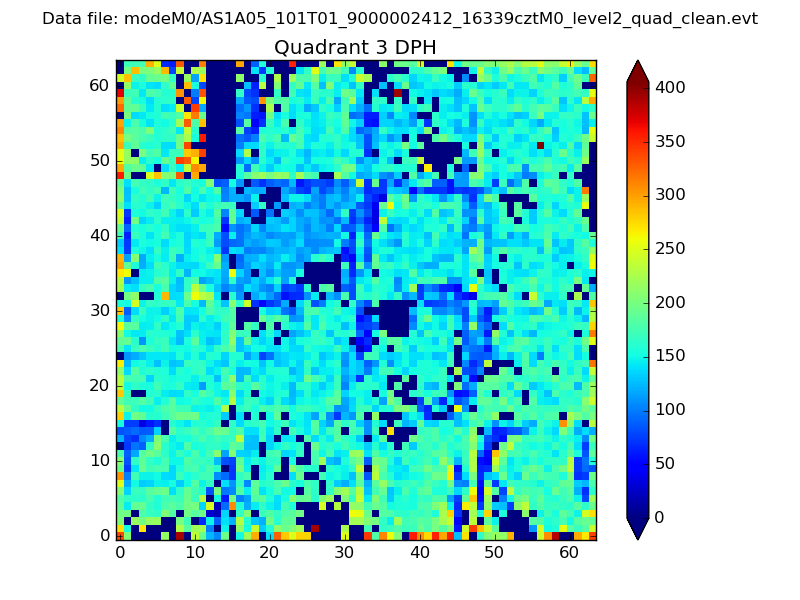 |
 |
Quadrant C |
| Plot type | Count rate plots | Images |
|---|---|---|
| Comparison with Poisson distribution Blue bars denote a histogram of data divided into 1 sec bins. Red curve is a Poisson curve with rate = median count rate of data. |
 |
 |
| Quadrant-wise count rates Data is divided into 100 sec bins |
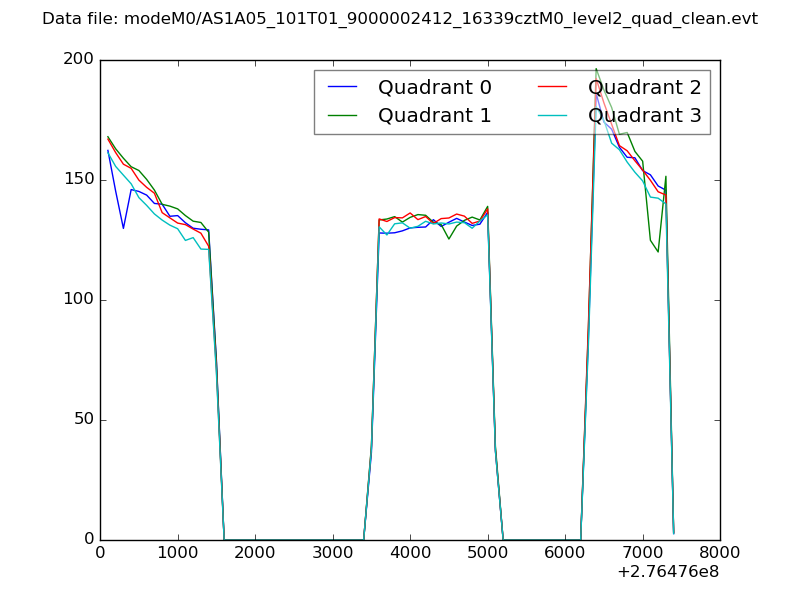 |
|
| Module-wise count rates for Quadrant A Data is divided into 100 sec bins |
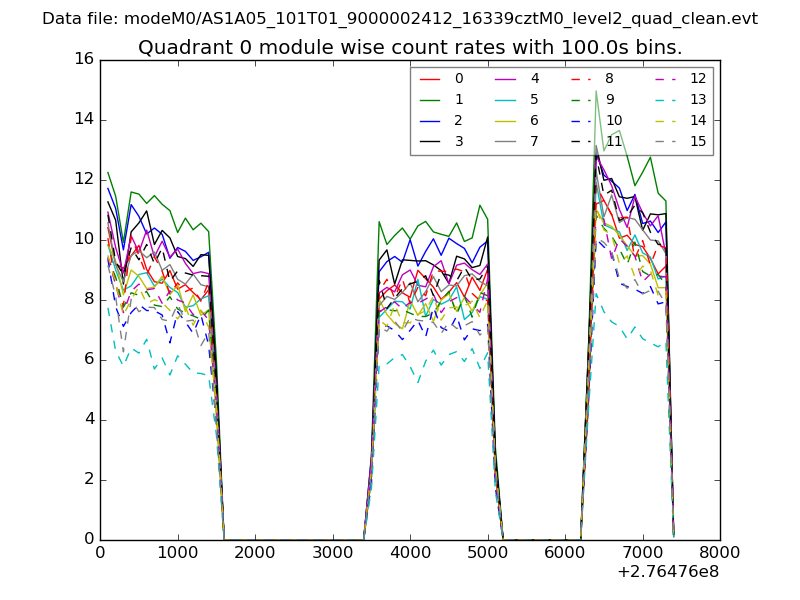 |
 |
| Module-wise count rates for Quadrant B Data is divided into 100 sec bins |
 |
 |
| Module-wise count rates for Quadrant C Data is divided into 100 sec bins |
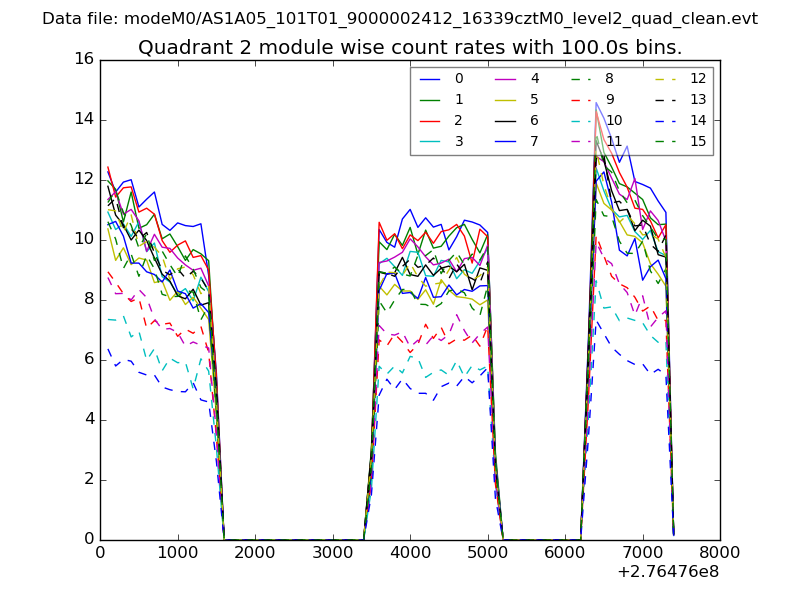 |
 |
| Module-wise count rates for Quadrant D Data is divided into 100 sec bins |
 |
 |
| Parameter | Plot |
|---|---|
| CZT HV Monitor | 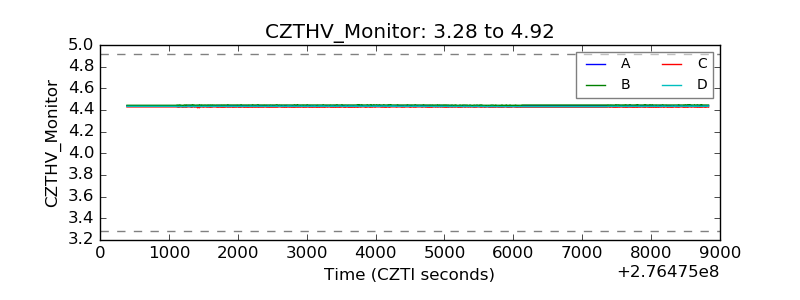 |
| D_VDD | 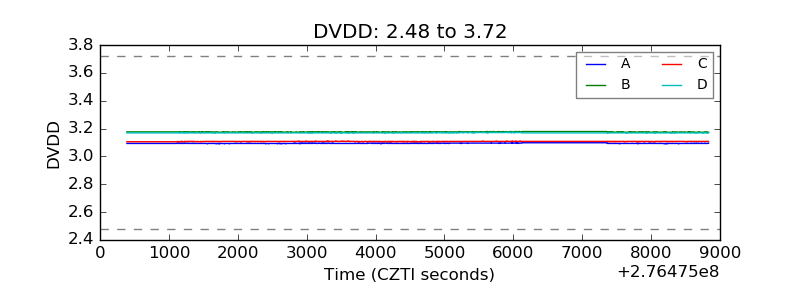 |
| Temperature 1 | 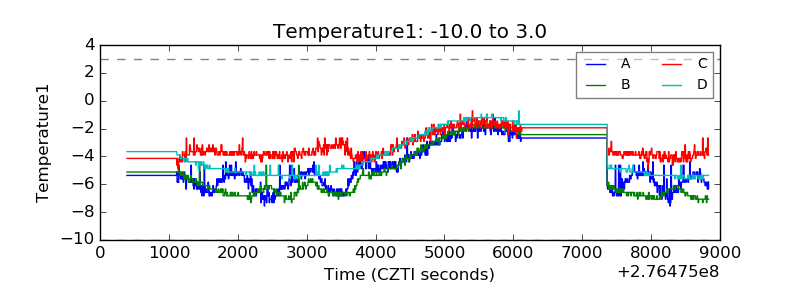 |
| Veto HV Monitor | 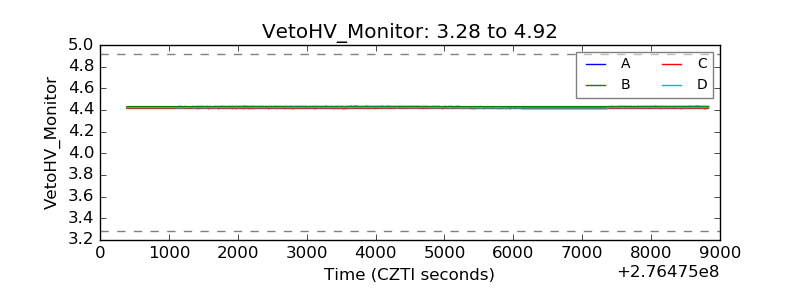 |
| Veto LLD | 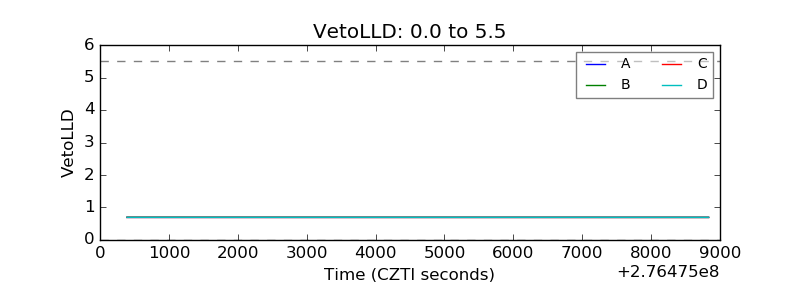 |
| Alpha Counter | 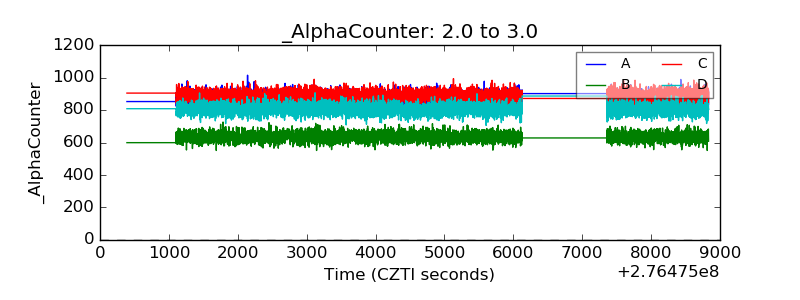 |
| _CPM_Rate | 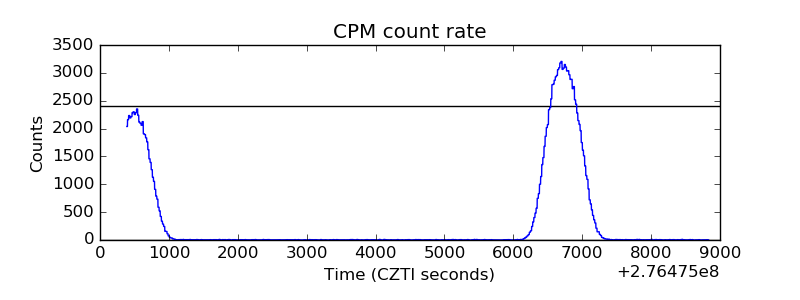 |
| CZT Counter | 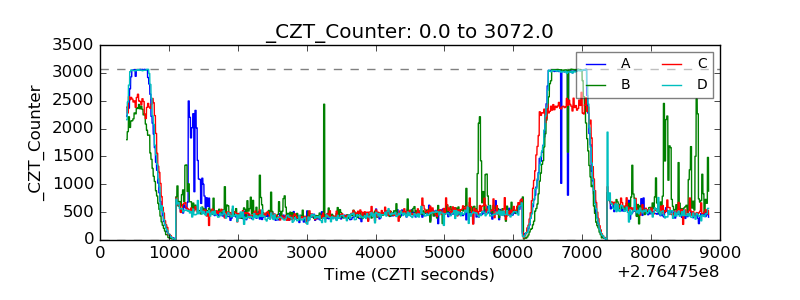 |
| +2.5 Volts monitor |  |
| +5 Volts monitor | 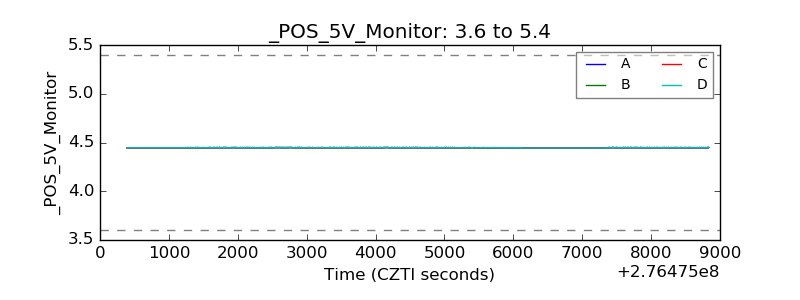 |
| _ROLL_ROT | 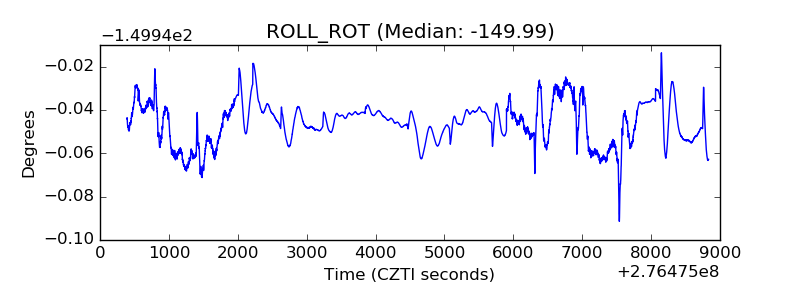 |
| _Roll_DEC | 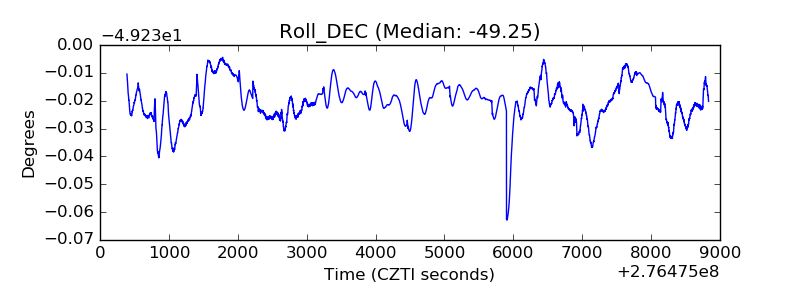 |
| _Roll_RA | 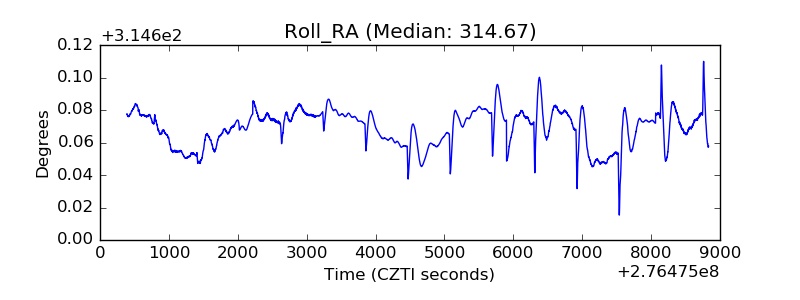 |
| Veto Counter | 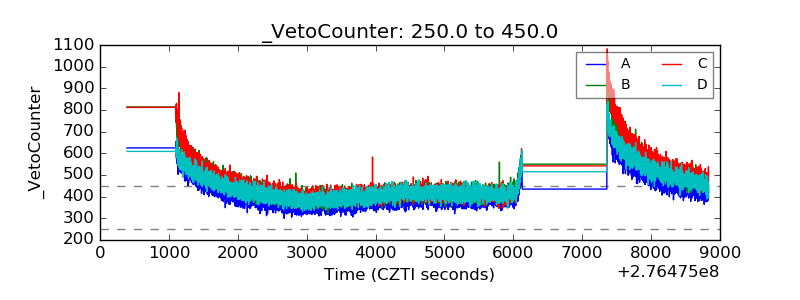 |