| Param | Original file | Final file |
|---|---|---|
| Filename | modeM0/AS1A05_101T01_9000002412_16340cztM0_level2.evt | modeM0/AS1A05_101T01_9000002412_16340cztM0_level2_quad_clean.evt |
| Size (bytes) | 482,699,520 | 86,892,480 |
| Size | 460.3 MB | 82.9 MB |
| Events in quadrant A | 3,209,871 | 543,793 |
| Events in quadrant B | 4,240,590 | 553,260 |
| Events in quadrant C | 3,397,679 | 552,388 |
| Events in quadrant D | 3,333,769 | 533,141 |
| Mode SS | |||
|---|---|---|---|
| Quadrant | BADHDUFLAG | Total packets | Discarded packets |
| A | 0 | 132 | 0 |
| B | 0 | 132 | 0 |
| C | 0 | 132 | 0 |
| D | 0 | 132 | 0 |
| Mode M0 | |||
|---|---|---|---|
| Quadrant | BADHDUFLAG | Total packets | Discarded packets |
| A | 0 | 13409 | 3 |
| B | 0 | 16733 | 2 |
| C | 0 | 13831 | 2 |
| D | 0 | 13928 | 2 |
| Mode M9 | |||
|---|---|---|---|
| Quadrant | BADHDUFLAG | Total packets | Discarded packets |
| A | 0 | 20 | 0 |
| B | 0 | 20 | 0 |
| C | 0 | 20 | 0 |
| D | 0 | 21 | 0 |
| Quadrant | Total seconds | Saturated seconds | Saturation percentage |
|---|---|---|---|
| A | 6427 | 31 | 0.482340% |
| B | 6427 | 232 | 3.609771% |
| C | 6427 | 71 | 1.104714% |
| D | 6427 | 40 | 0.622374% |
Noise dominated data is calculated using 1-second bins in cleaned event files. If a bin has >2000 counts, and if more than 50% of those come from <1% of pixels, then it is considered to be noise-dominated and hence unusable.
| Quadrant | # 1 sec bins | Bins with >0 counts | Bins with >2000 counts | High rate bins dominated by noise | Noise dominated (total time) | Noise dominated (detector-on time) | Marked lightcurve |
|---|---|---|---|---|---|---|---|
| A | 7738 | 6429 | 0 | 0 | 0.00% | 0.00% | 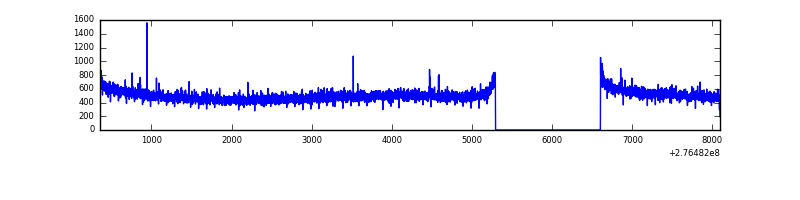 |
| B | 7738 | 6429 | 136 | 136 | 1.76% | 2.12% | 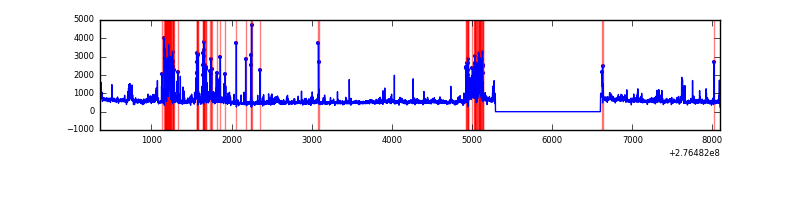 |
| C | 7738 | 6429 | 0 | 0 | 0.00% | 0.00% | 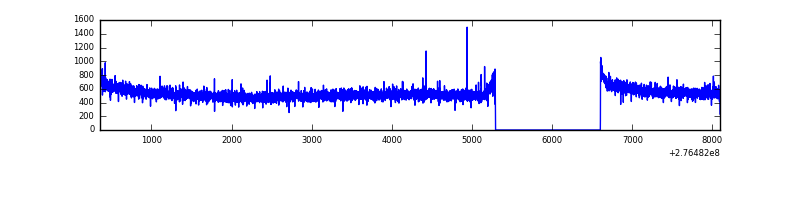 |
| D | 7738 | 6429 | 13 | 13 | 0.17% | 0.20% | 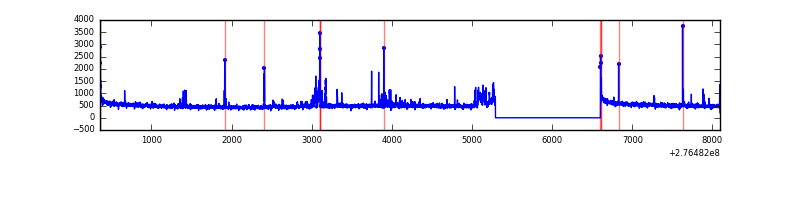 |
Top three noisy pixels from each quadrant. If the there are fewer than three noisy pixels in the level2.evt file, extra rows are filled as -1
| Pixel properties | Quadrant properties | ||||||
|---|---|---|---|---|---|---|---|
| Quadrant | DetID | PixID | Counts | Sigma | Mean | Median | Sigma |
| A | 15 | 174 | 7435 | 40.01 | 832 | 817 | 165.4 |
| A | 0 | 226 | 7420 | 39.92 | 832 | 817 | 165.4 |
| A | 12 | 194 | 6054 | 31.66 | 832 | 817 | 165.4 |
| B | 3 | 112 | 688522 | 4462.68 | 834 | 816 | 154.1 |
| B | 15 | 35 | 118768 | 765.42 | 834 | 816 | 154.1 |
| B | 4 | 173 | 50541 | 322.68 | 834 | 816 | 154.1 |
| C | 14 | 238 | 131417 | 696.64 | 823 | 828 | 187.5 |
| C | 3 | 233 | 50713 | 266.12 | 823 | 828 | 187.5 |
| C | 0 | 207 | 9279 | 45.08 | 823 | 828 | 187.5 |
| D | 12 | 218 | 123881 | 628.98 | 821 | 798 | 195.7 |
| D | 1 | 52 | 65866 | 332.51 | 821 | 798 | 195.7 |
| D | 10 | 70 | 30574 | 152.16 | 821 | 798 | 195.7 |
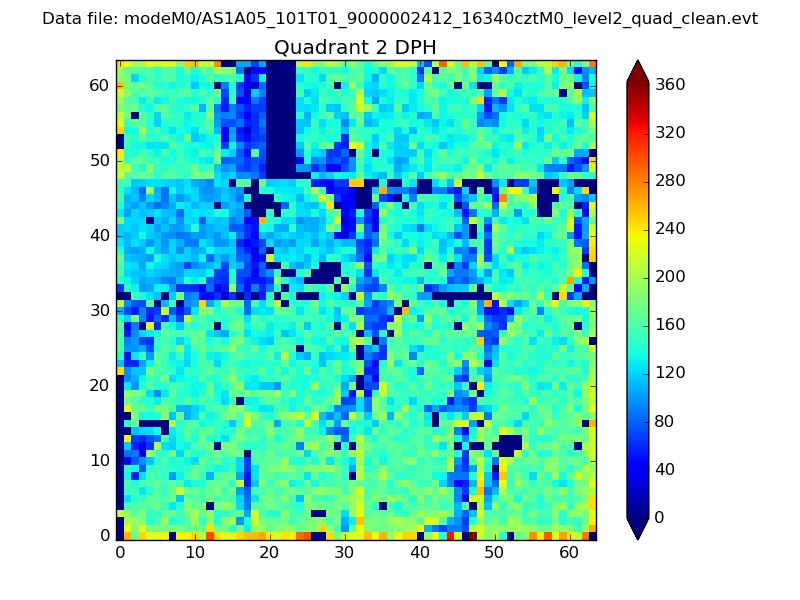
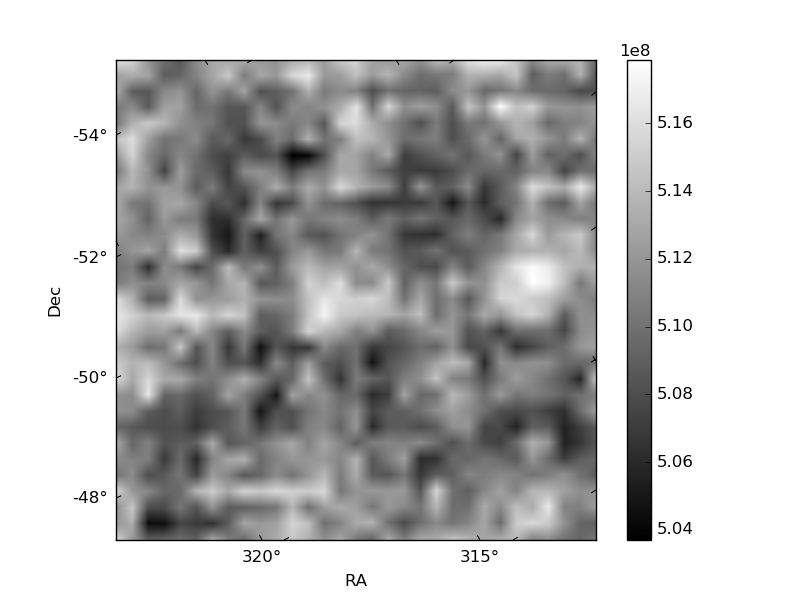
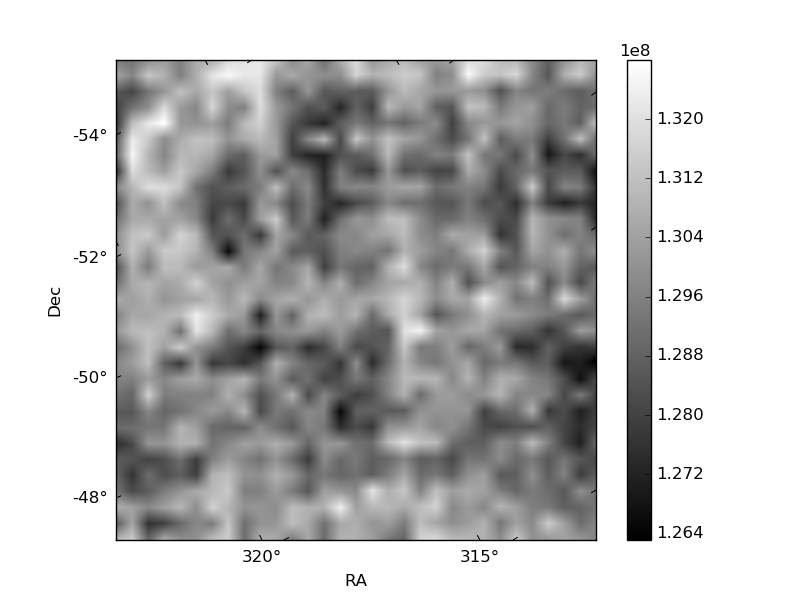
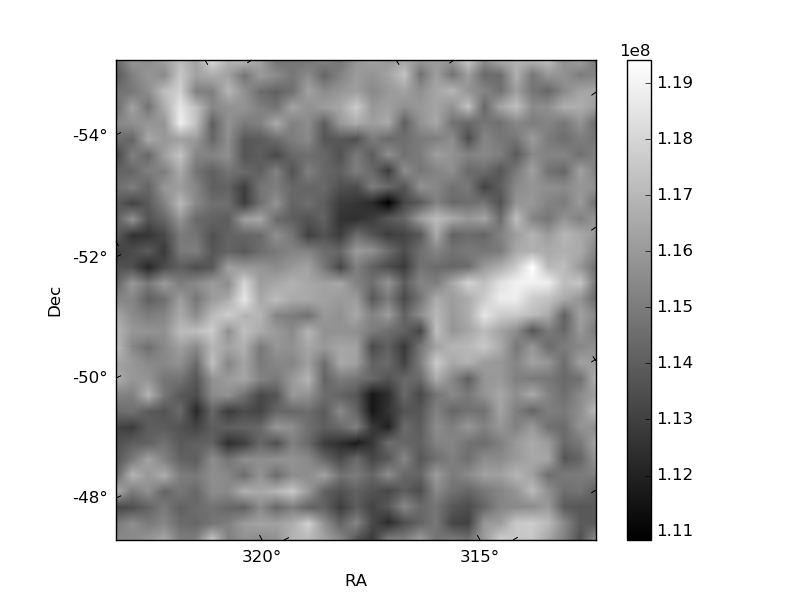
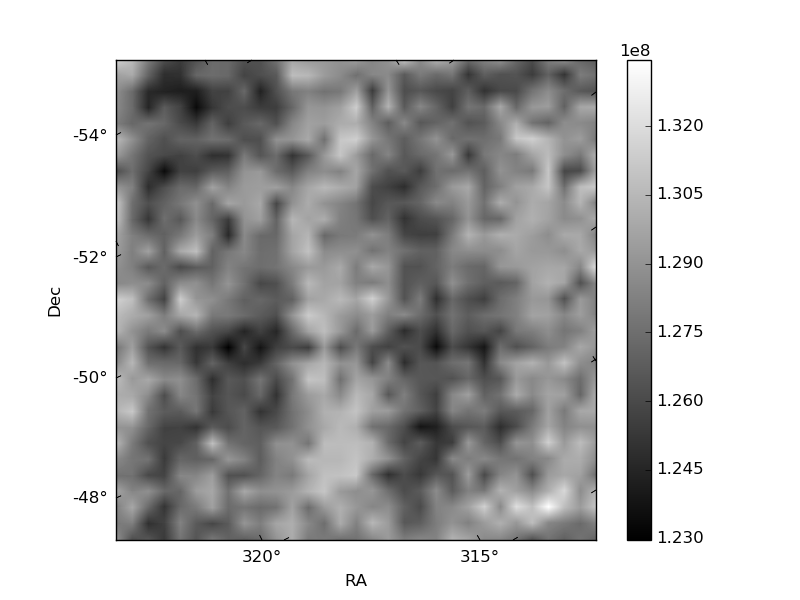
Histogram calculated using DETX and DETY for each event in the final _common_clean file
| Quadrant A | 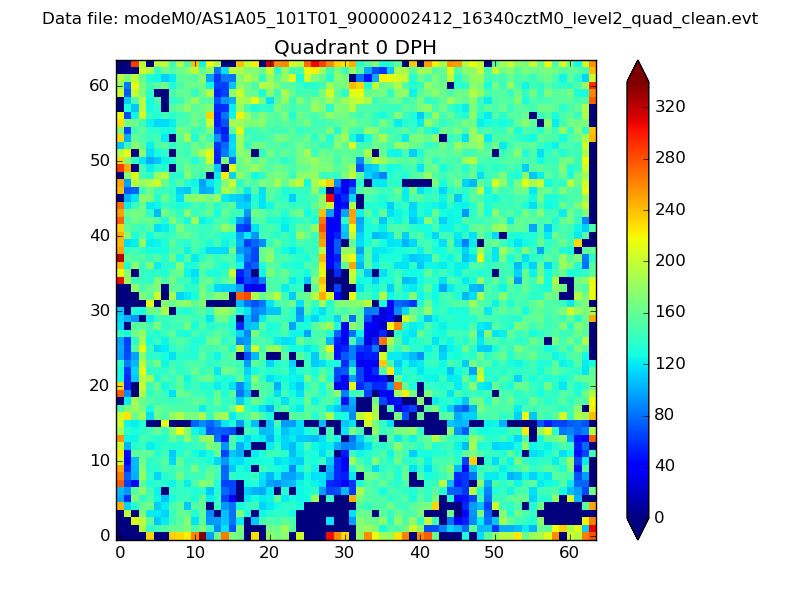 |
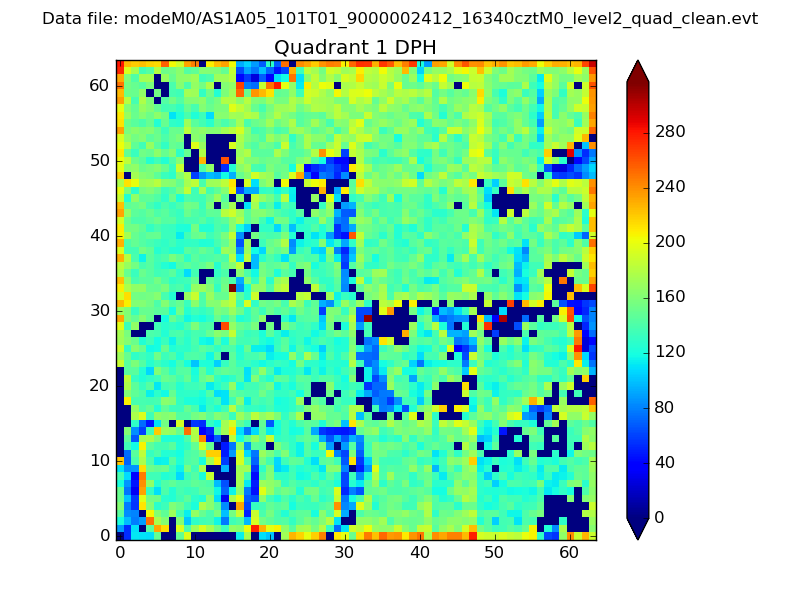 |
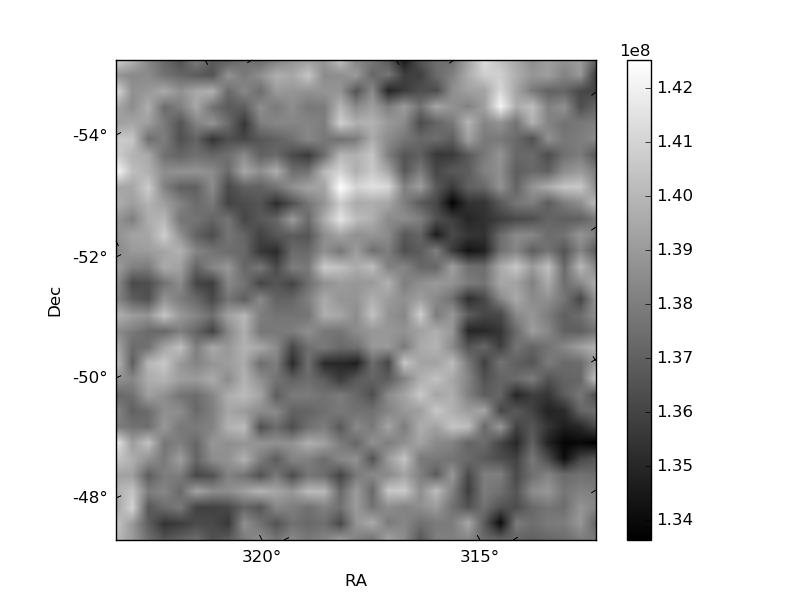
Quadrant B |
|---|---|---|---|
| Quadrant D | 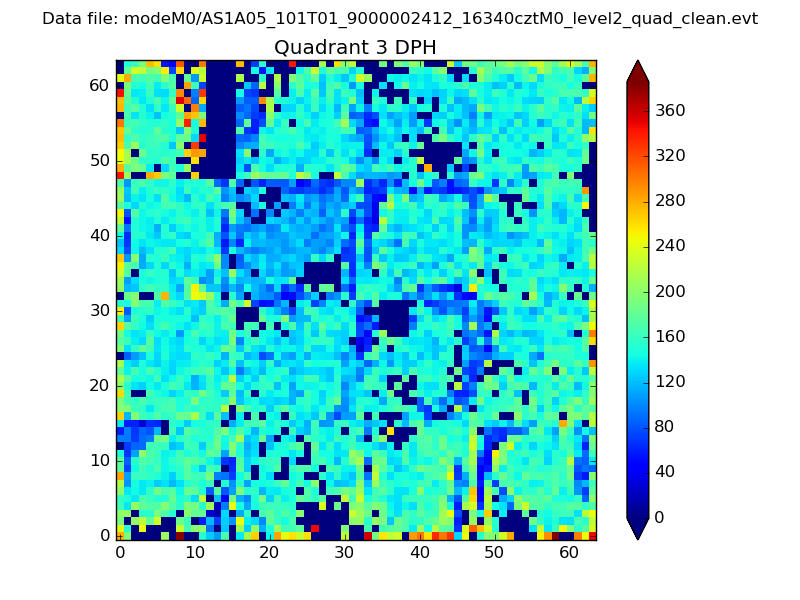 |
 |
Quadrant C |
| Plot type | Count rate plots | Images |
|---|---|---|
| Comparison with Poisson distribution Blue bars denote a histogram of data divided into 1 sec bins. Red curve is a Poisson curve with rate = median count rate of data. |
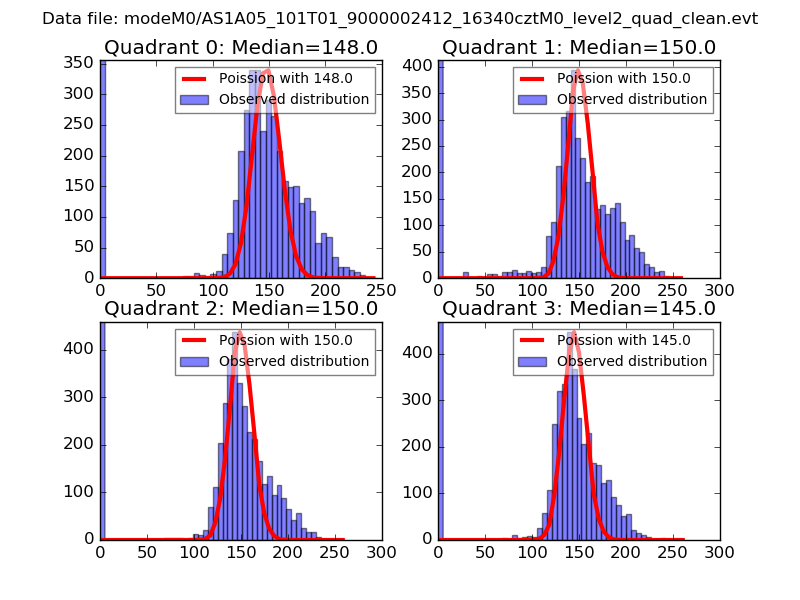 |
 |
| Quadrant-wise count rates Data is divided into 100 sec bins |
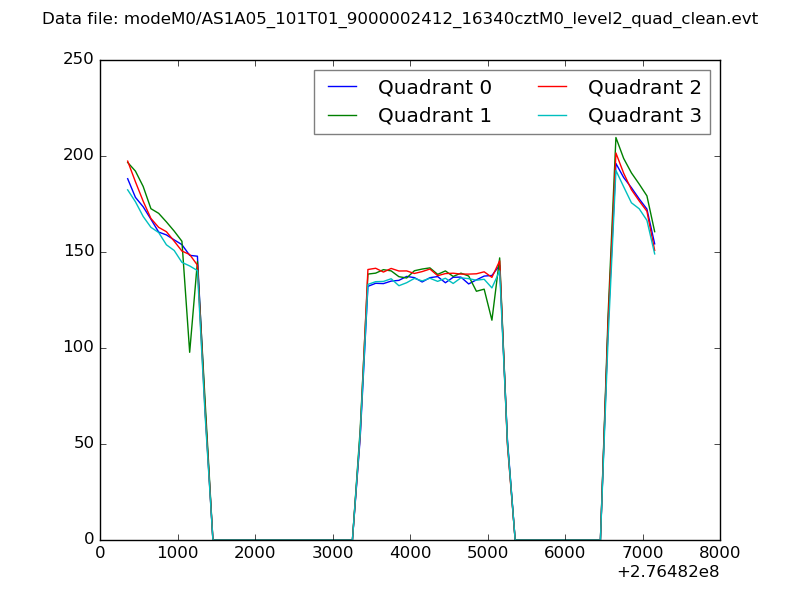 |
|
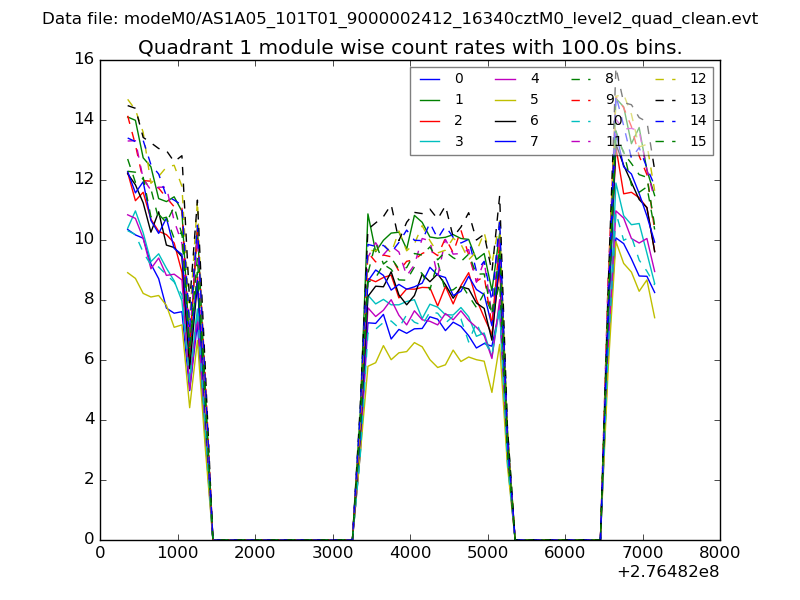
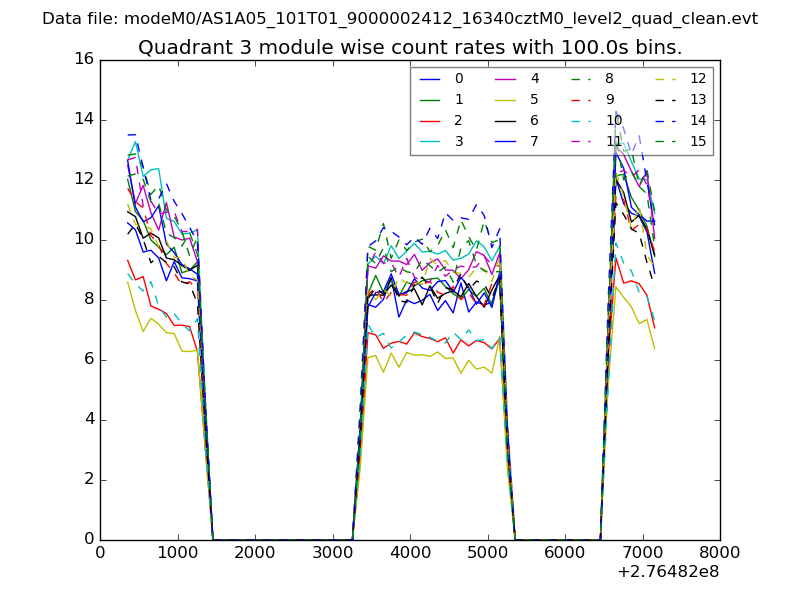
| Module-wise count rates for Quadrant A Data is divided into 100 sec bins |
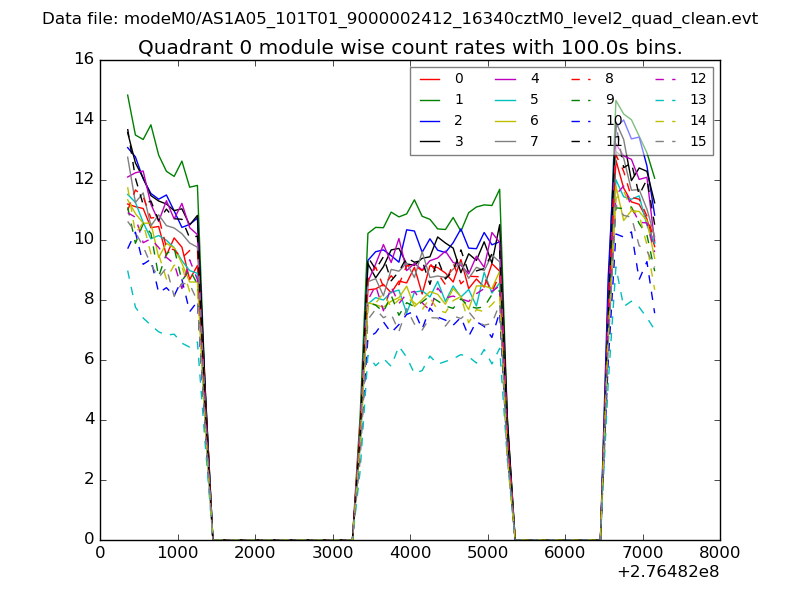 |
 |
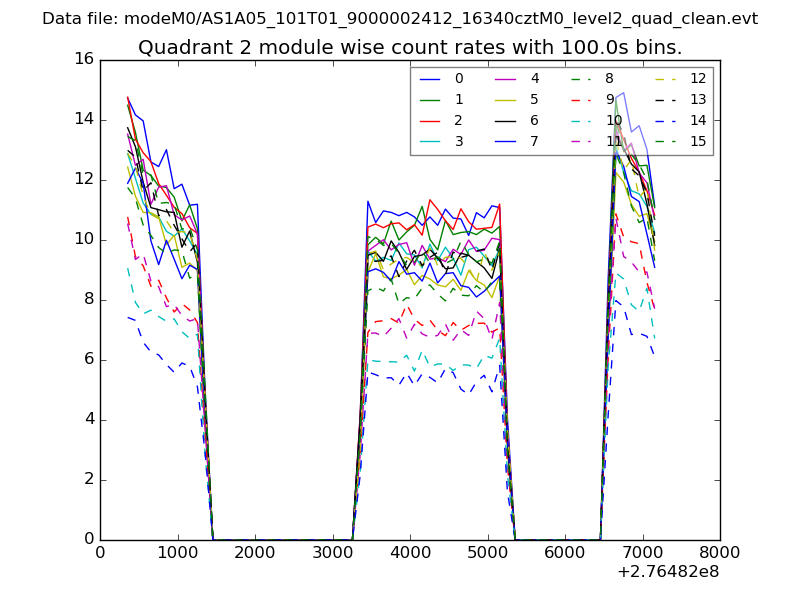
| Module-wise count rates for Quadrant B Data is divided into 100 sec bins |
 |
 |
| Module-wise count rates for Quadrant C Data is divided into 100 sec bins |
 |
 |
| Module-wise count rates for Quadrant D Data is divided into 100 sec bins |
 |
 |
| Parameter | Plot |
|---|---|
| CZT HV Monitor | 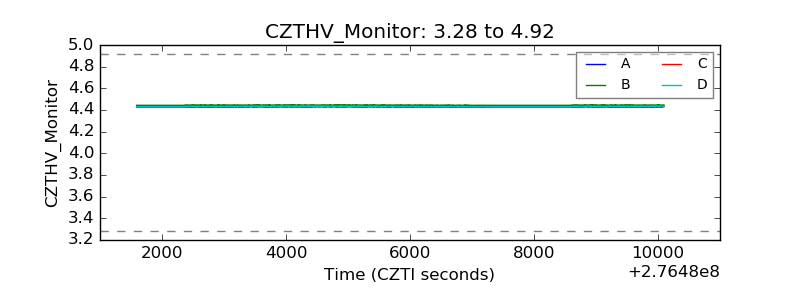 |
| D_VDD | 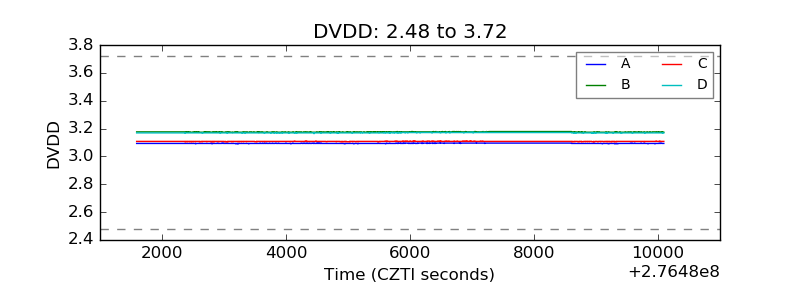 |
| Temperature 1 | 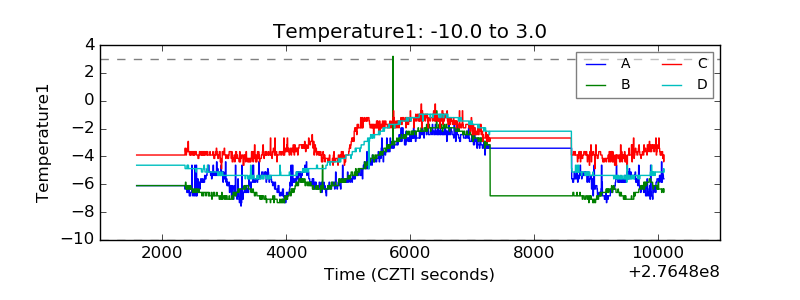 |
| Veto HV Monitor | 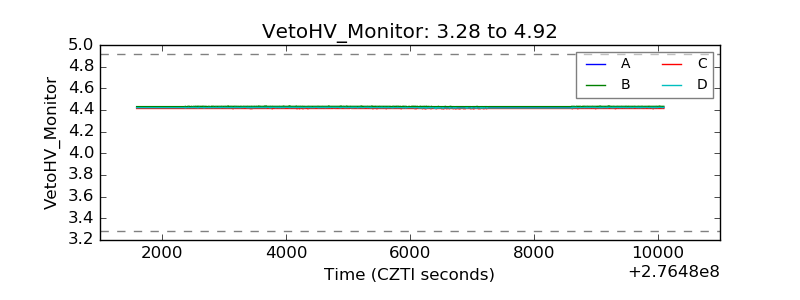 |
| Veto LLD | 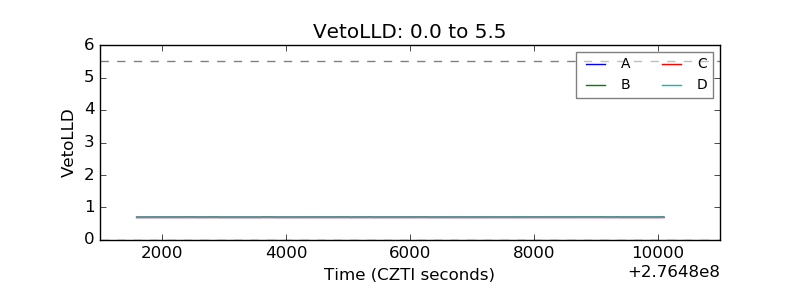 |
| Alpha Counter | 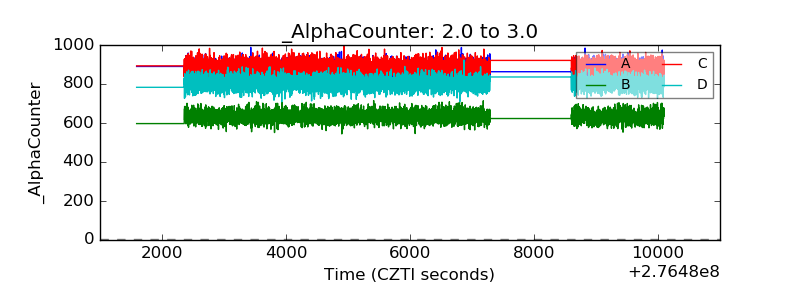 |
| _CPM_Rate | 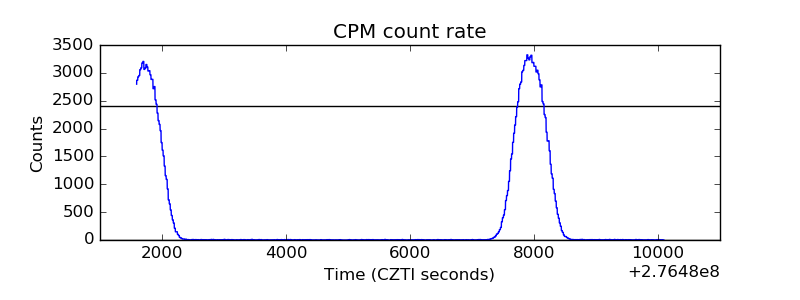 |
| CZT Counter | 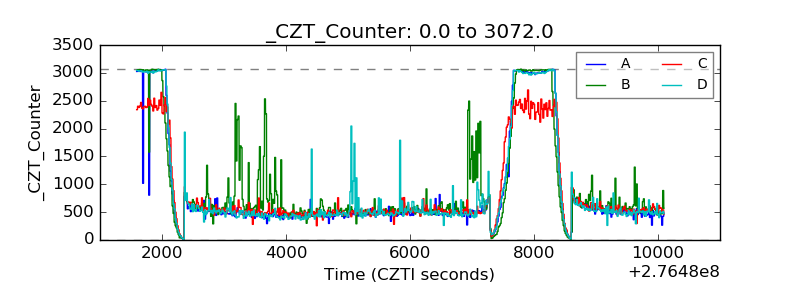 |
| +2.5 Volts monitor | 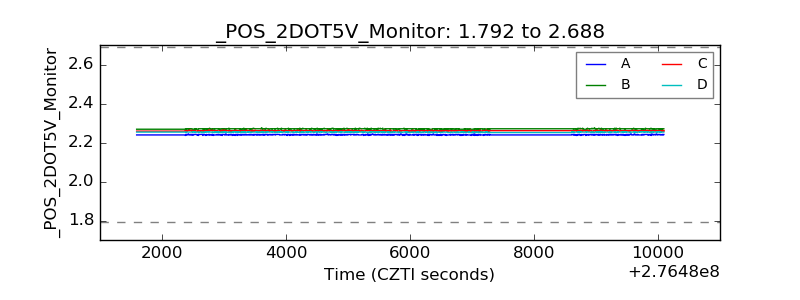 |
| +5 Volts monitor |  |
| _ROLL_ROT | 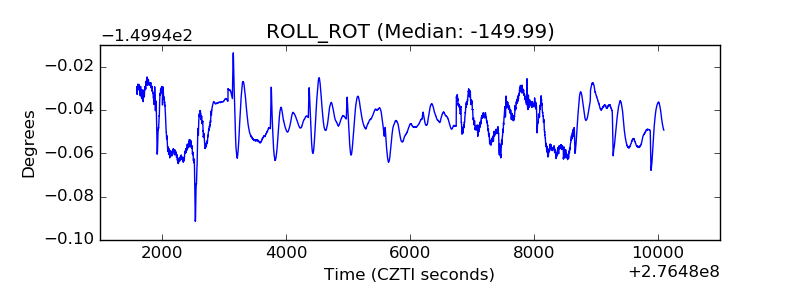 |
| _Roll_DEC | 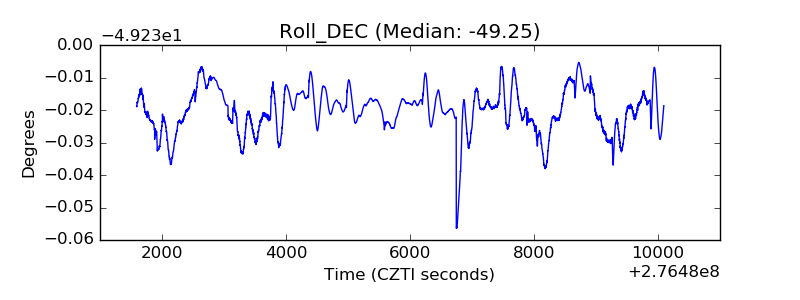 |
| _Roll_RA |  |
| Veto Counter | 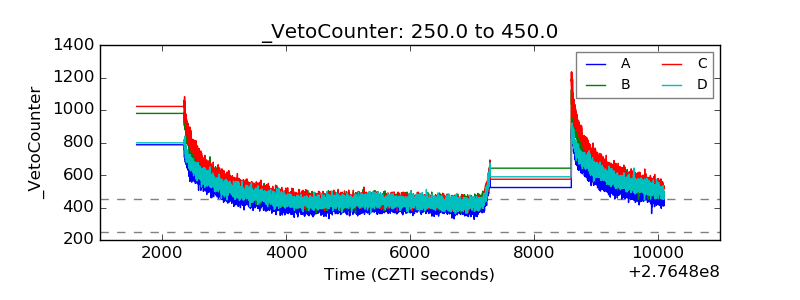 |