| Param | Original file | Final file |
|---|---|---|
| Filename | modeM0/AS1A05_101T01_9000002412_16341cztM0_level2.evt | modeM0/AS1A05_101T01_9000002412_16341cztM0_level2_quad_clean.evt |
| Size (bytes) | 509,397,120 | 77,788,800 |
| Size | 485.8 MB | 74.2 MB |
| Events in quadrant A | 3,307,183 | 477,675 |
| Events in quadrant B | 4,358,778 | 482,646 |
| Events in quadrant C | 3,384,159 | 487,830 |
| Events in quadrant D | 3,953,507 | 471,293 |
| Mode SS | |||
|---|---|---|---|
| Quadrant | BADHDUFLAG | Total packets | Discarded packets |
| A | 0 | 126 | 0 |
| B | 0 | 126 | 0 |
| C | 0 | 126 | 0 |
| D | 0 | 126 | 0 |
| Mode M0 | |||
|---|---|---|---|
| Quadrant | BADHDUFLAG | Total packets | Discarded packets |
| A | 0 | 13425 | 3 |
| B | 0 | 17028 | 2 |
| C | 0 | 13720 | 2 |
| D | 0 | 15526 | 2 |
| Mode M9 | |||
|---|---|---|---|
| Quadrant | BADHDUFLAG | Total packets | Discarded packets |
| A | 0 | 23 | 0 |
| B | 0 | 23 | 0 |
| C | 0 | 23 | 0 |
| D | 0 | 24 | 0 |
| Quadrant | Total seconds | Saturated seconds | Saturation percentage |
|---|---|---|---|
| A | 6249 | 50 | 0.800128% |
| B | 6249 | 243 | 3.888622% |
| C | 6249 | 89 | 1.424228% |
| D | 6249 | 288 | 4.608737% |
Noise dominated data is calculated using 1-second bins in cleaned event files. If a bin has >2000 counts, and if more than 50% of those come from <1% of pixels, then it is considered to be noise-dominated and hence unusable.
| Quadrant | # 1 sec bins | Bins with >0 counts | Bins with >2000 counts | High rate bins dominated by noise | Noise dominated (total time) | Noise dominated (detector-on time) | Marked lightcurve |
|---|---|---|---|---|---|---|---|
| A | 7620 | 6251 | 3 | 3 | 0.04% | 0.05% |  |
| B | 7620 | 6251 | 113 | 113 | 1.48% | 1.81% |  |
| C | 7620 | 6251 | 0 | 0 | 0.00% | 0.00% |  |
| D | 7620 | 6251 | 229 | 229 | 3.01% | 3.66% |  |
Top three noisy pixels from each quadrant. If the there are fewer than three noisy pixels in the level2.evt file, extra rows are filled as -1
| Pixel properties | Quadrant properties | ||||||
|---|---|---|---|---|---|---|---|
| Quadrant | DetID | PixID | Counts | Sigma | Mean | Median | Sigma |
| A | 15 | 174 | 76890 | 454.25 | 841 | 827 | 167.4 |
| A | 0 | 226 | 7423 | 39.39 | 841 | 827 | 167.4 |
| A | 12 | 194 | 6237 | 32.31 | 841 | 827 | 167.4 |
| B | 3 | 112 | 746686 | 4848.46 | 841 | 823 | 153.8 |
| B | 4 | 173 | 160707 | 1039.32 | 841 | 823 | 153.8 |
| B | 15 | 35 | 93671 | 603.56 | 841 | 823 | 153.8 |
| C | 14 | 238 | 131963 | 696.91 | 829 | 836 | 188.2 |
| C | 3 | 233 | 17549 | 88.83 | 829 | 836 | 188.2 |
| C | 13 | 61 | 5851 | 26.65 | 829 | 836 | 188.2 |
| D | 12 | 110 | 732211 | 3768.76 | 815 | 794 | 194.1 |
| D | 12 | 218 | 88821 | 453.57 | 815 | 794 | 194.1 |
| D | 1 | 52 | 28034 | 140.36 | 815 | 794 | 194.1 |
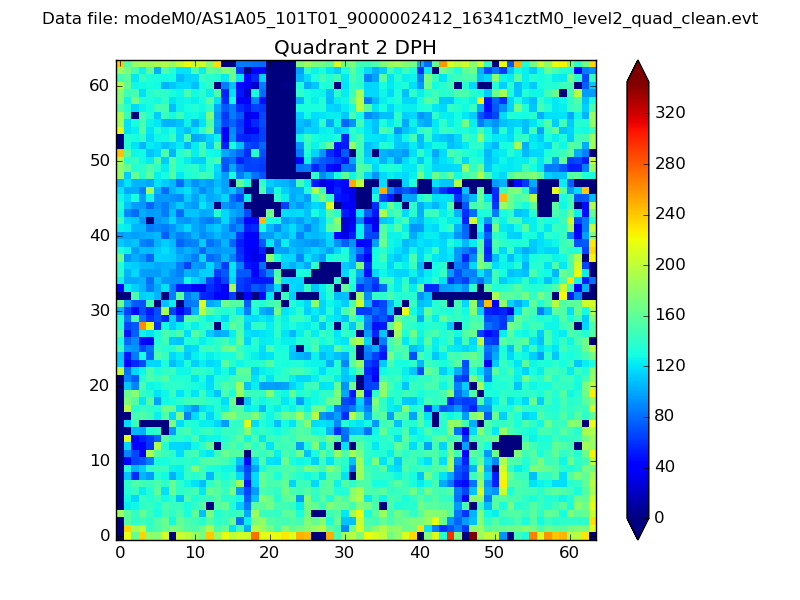
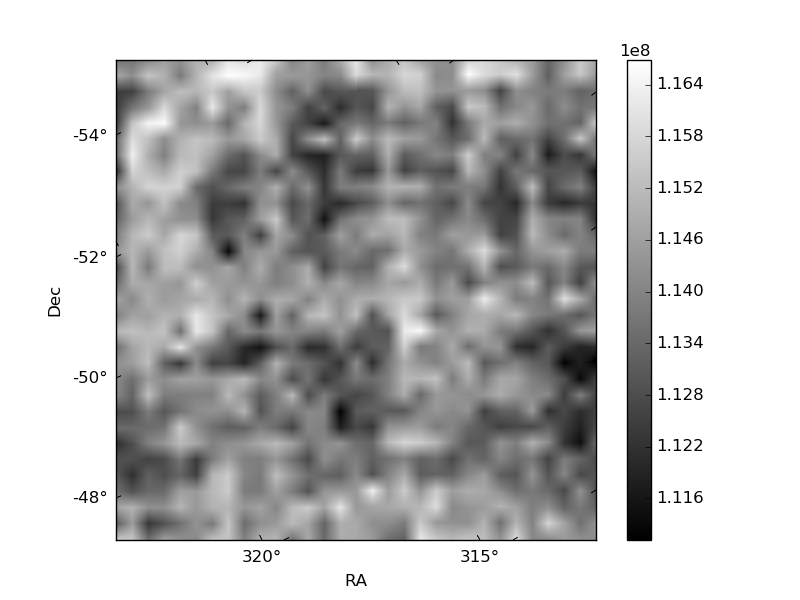
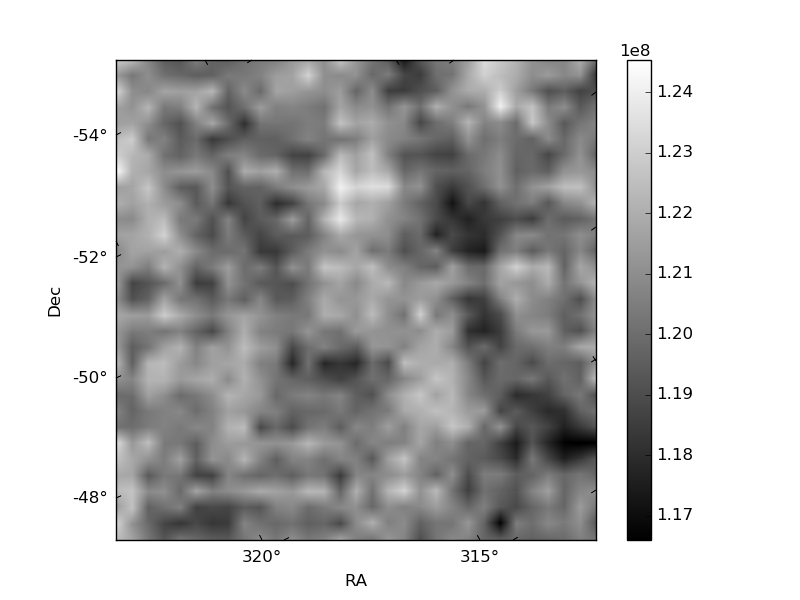
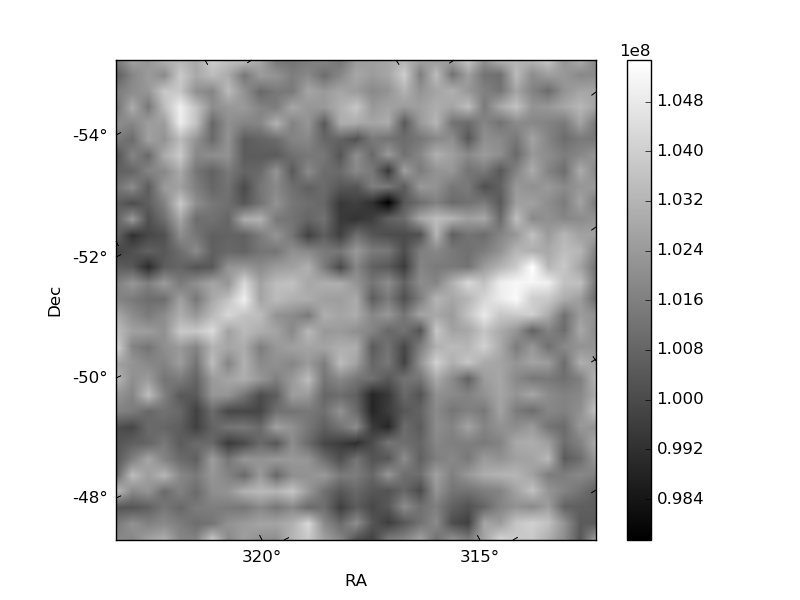
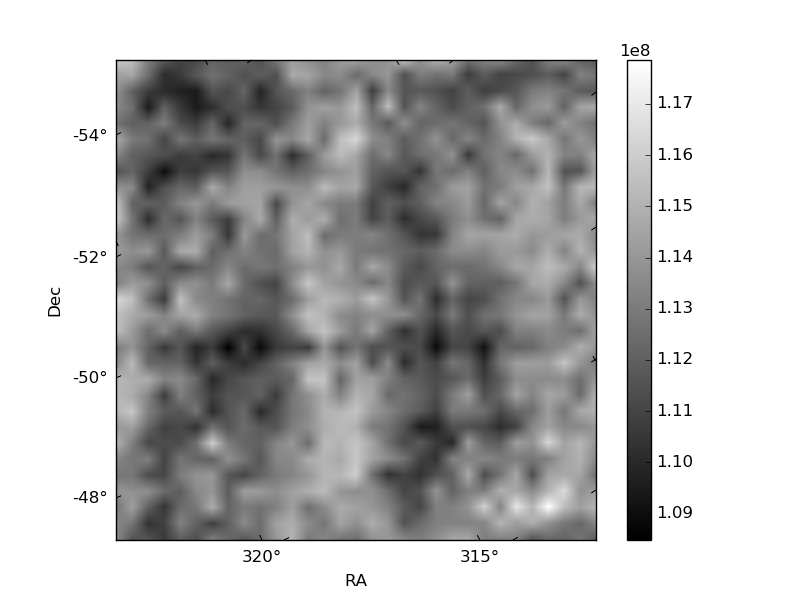
Histogram calculated using DETX and DETY for each event in the final _common_clean file
| Quadrant A | 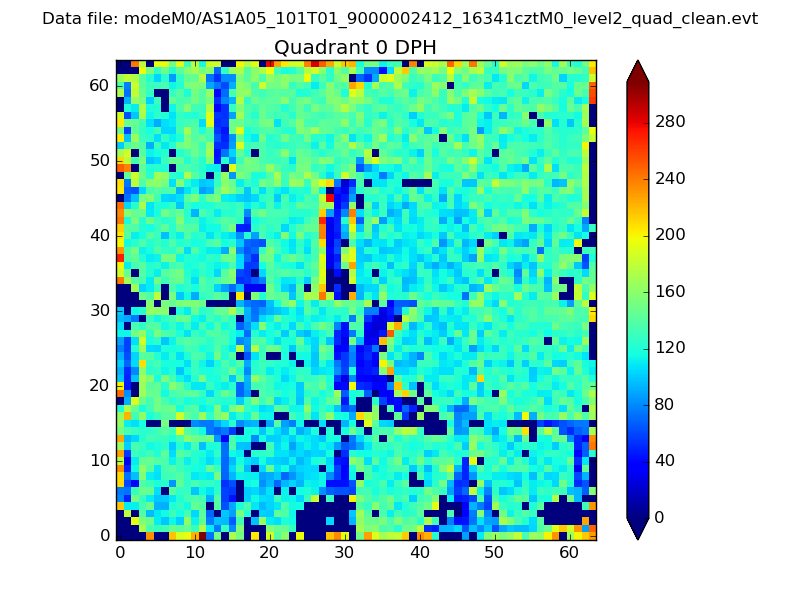 |
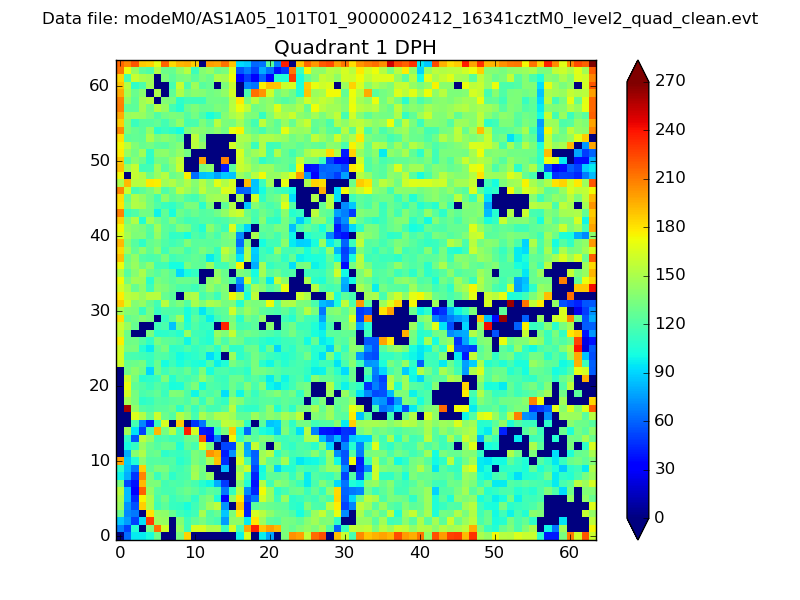 |
Quadrant B |
|---|---|---|---|
| Quadrant D | 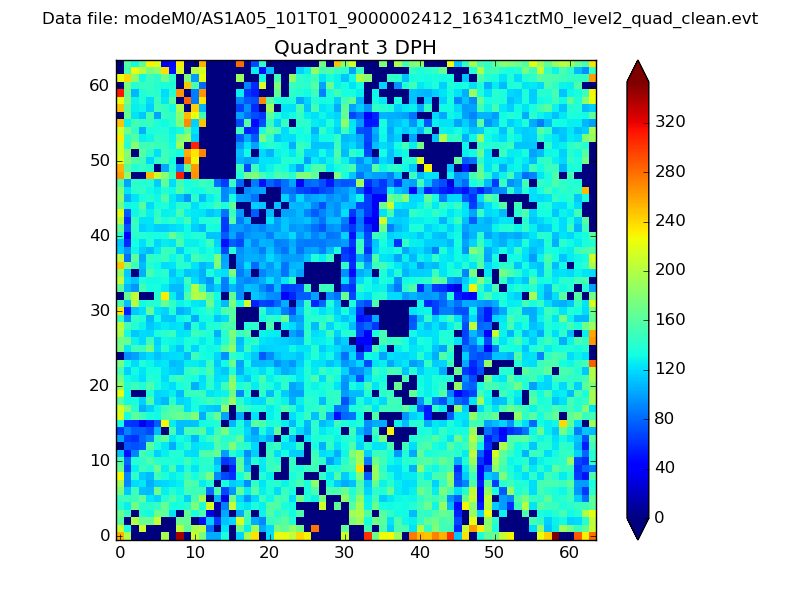 |
 |
Quadrant C |
| Plot type | Count rate plots | Images |
|---|---|---|
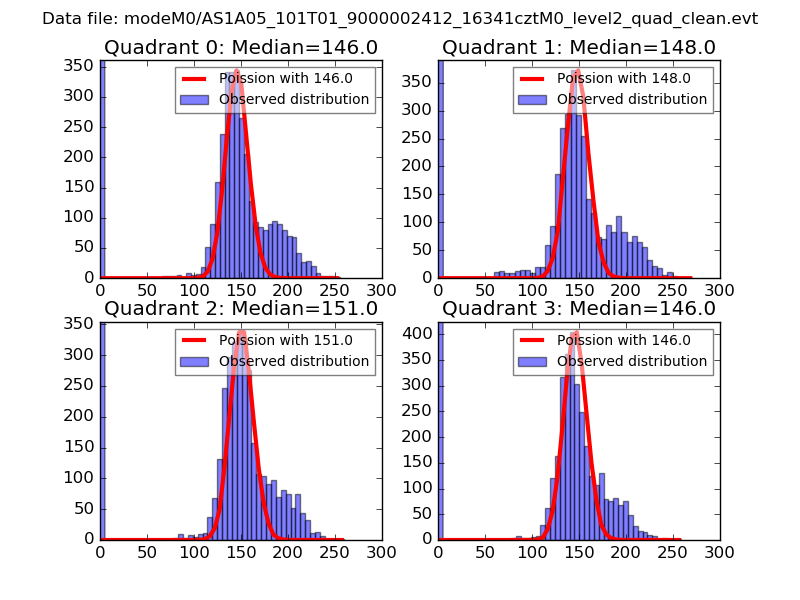
| Comparison with Poisson distribution Blue bars denote a histogram of data divided into 1 sec bins. Red curve is a Poisson curve with rate = median count rate of data. |
 |
 |
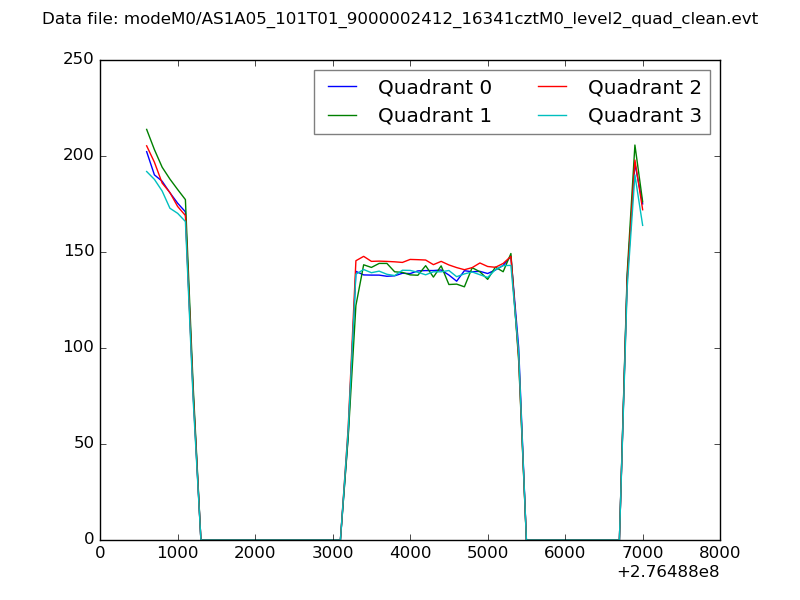
| Quadrant-wise count rates Data is divided into 100 sec bins |
 |
|
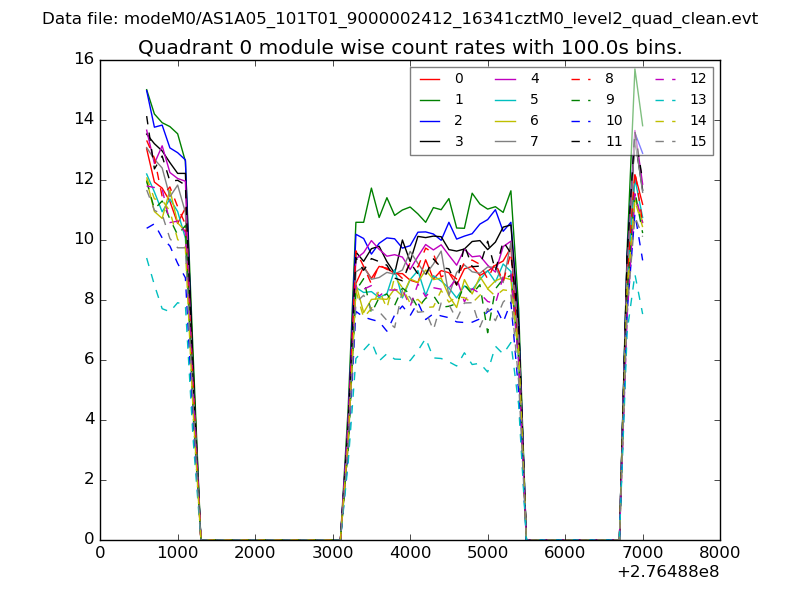
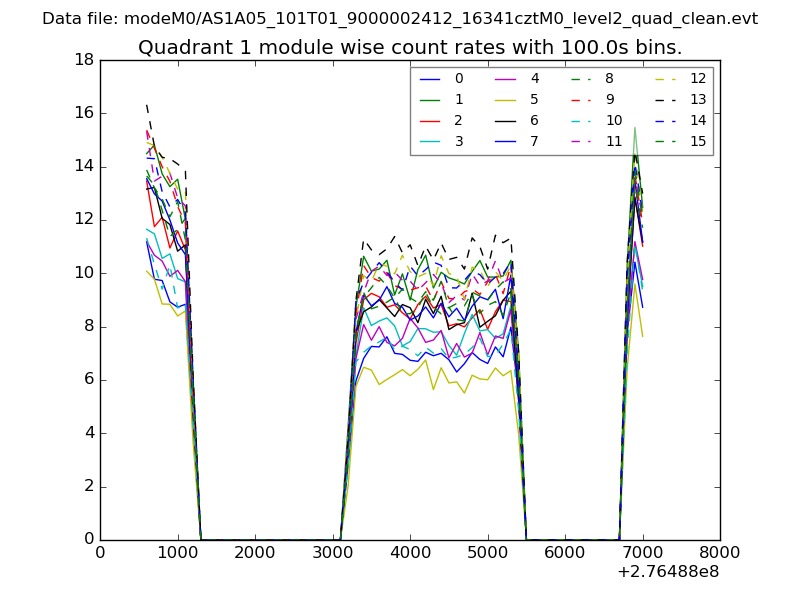
| Module-wise count rates for Quadrant A Data is divided into 100 sec bins |
 |
 |
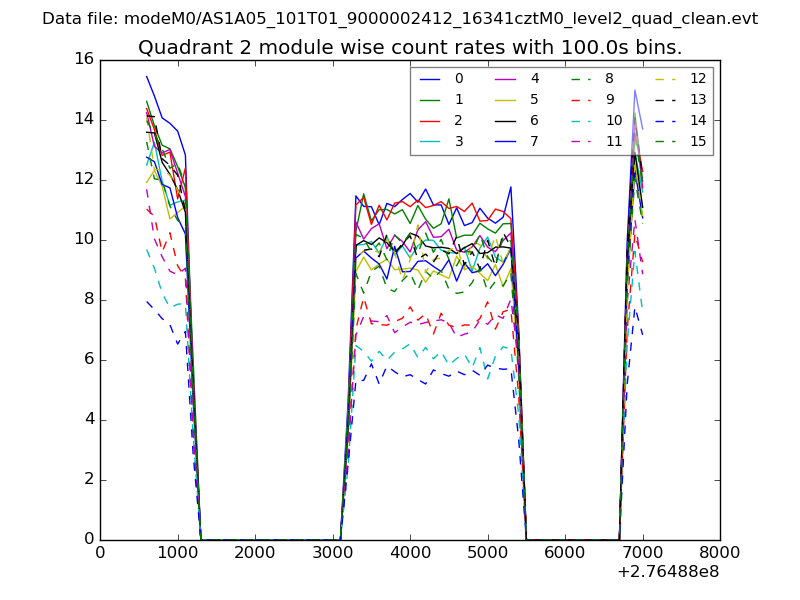
| Module-wise count rates for Quadrant B Data is divided into 100 sec bins |
 |
 |
| Module-wise count rates for Quadrant C Data is divided into 100 sec bins |
 |
 |
| Module-wise count rates for Quadrant D Data is divided into 100 sec bins |
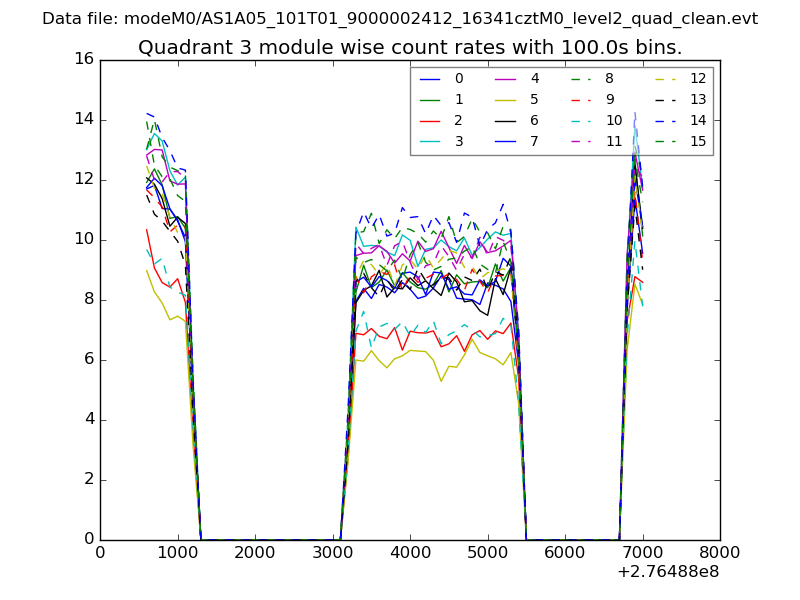 |
 |
| Parameter | Plot |
|---|---|
| CZT HV Monitor | 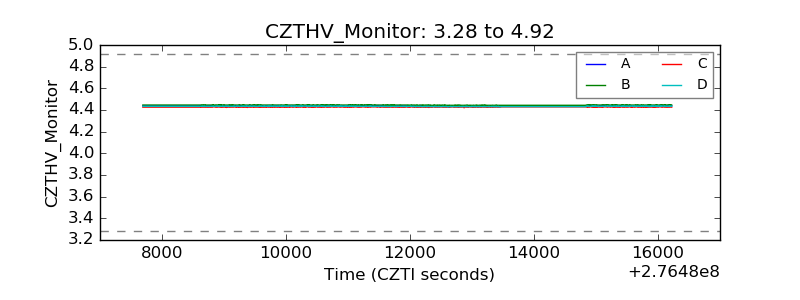 |
| D_VDD | 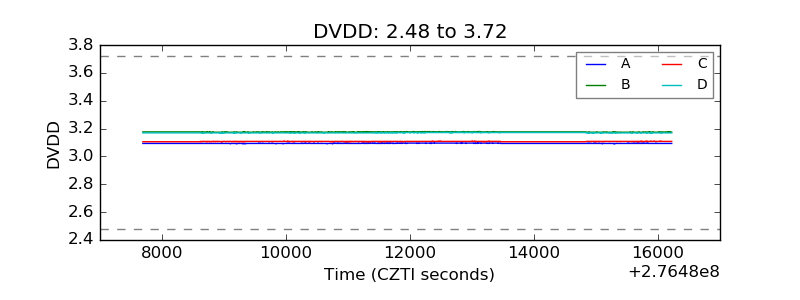 |
| Temperature 1 | 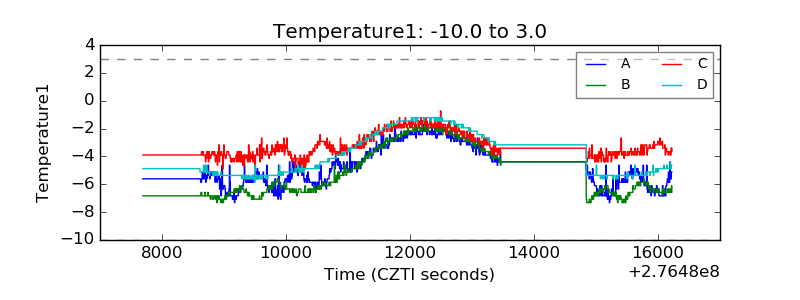 |
| Veto HV Monitor | 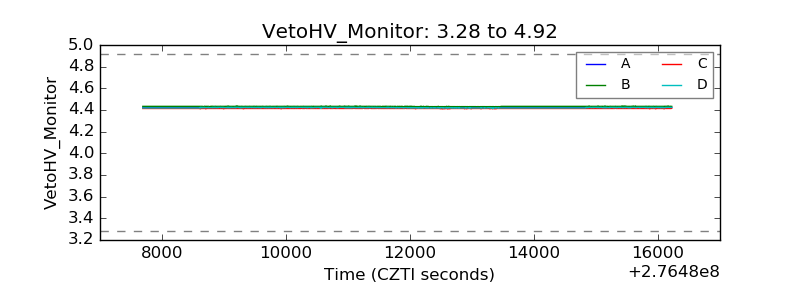 |
| Veto LLD | 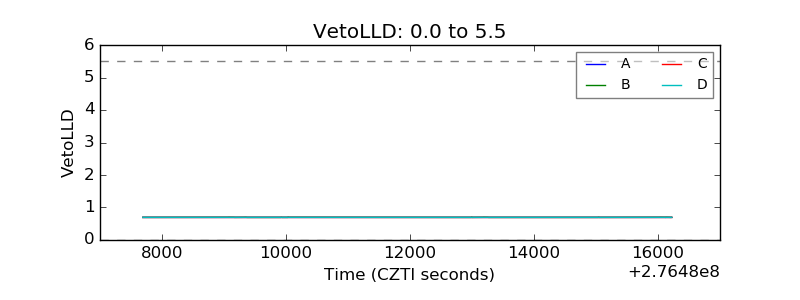 |
| Alpha Counter | 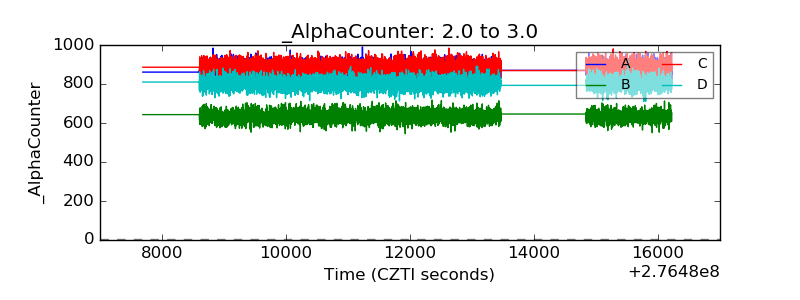 |
| _CPM_Rate | 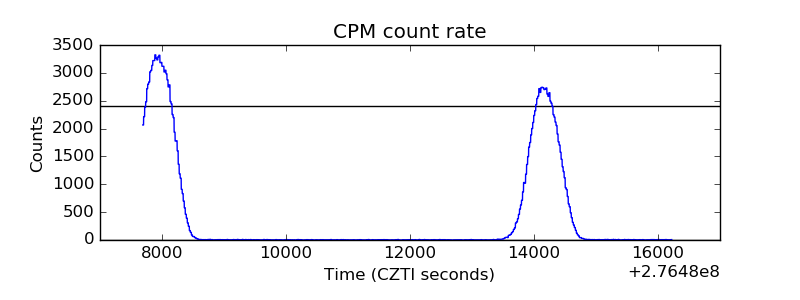 |
| CZT Counter | 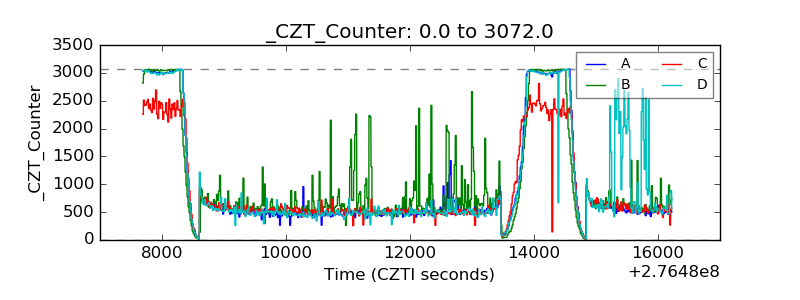 |
| +2.5 Volts monitor |  |
| +5 Volts monitor |  |
| _ROLL_ROT |  |
| _Roll_DEC | 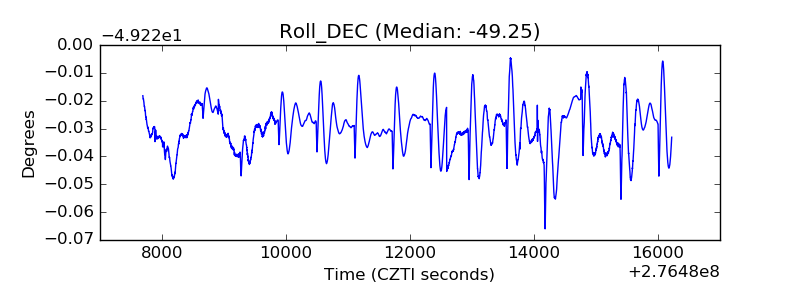 |
| _Roll_RA | 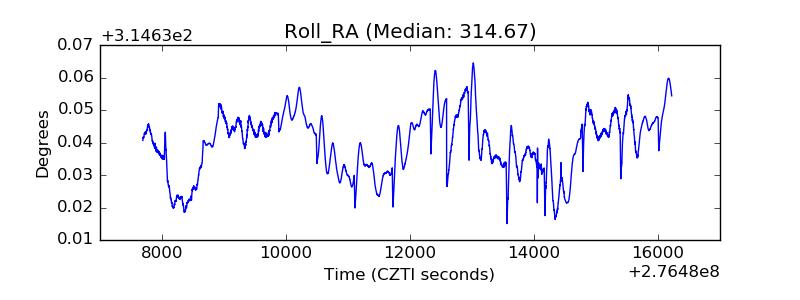 |
| Veto Counter | 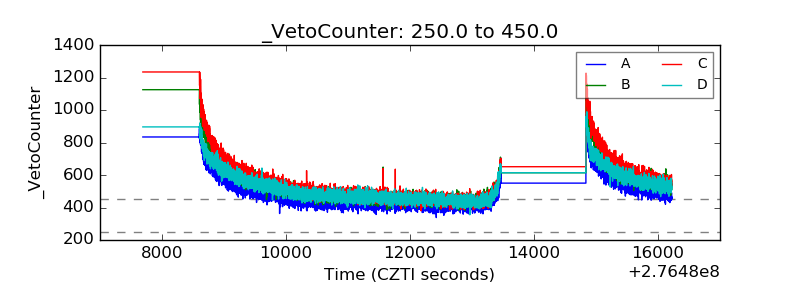 |