| Param | Original file | Final file |
|---|---|---|
| Filename | modeM0/AS1A05_149T04_9000002410cztM0_level2.fits | modeM0/AS1A05_149T04_9000002410cztM0_level2_quad_clean.evt |
| Size (bytes) | 129,147,840 | 102,712,320 |
| Size | 123.2 MB | 98.0 MB |
| Events in quadrant A | 769,338 | 510,736 |
| Events in quadrant B | 679,594 | 489,906 |
| Events in quadrant C | 787,784 | 586,578 |
| Events in quadrant D | 686,254 | 535,467 |
| Mode SS | |||
|---|---|---|---|
| Quadrant | BADHDUFLAG | Total packets | Discarded packets |
| A | 0 | 292 | 0 |
| B | 0 | 292 | 0 |
| C | 0 | 292 | 0 |
| D | 0 | 292 | 0 |
| Mode M0 | |||
|---|---|---|---|
| Quadrant | BADHDUFLAG | Total packets | Discarded packets |
| A | 0 | 38468 | 0 |
| B | 0 | 51874 | 0 |
| C | 0 | 29990 | 0 |
| D | 0 | 31456 | 0 |
| Mode M9 | |||
|---|---|---|---|
| Quadrant | BADHDUFLAG | Total packets | Discarded packets |
| A | 0 | 23 | 0 |
| B | 0 | 23 | 0 |
| C | 0 | 23 | 0 |
| D | 0 | 23 | 0 |
| Quadrant | Total seconds | Saturated seconds | Saturation percentage |
|---|---|---|---|
| A | 14288 | 1190 | 8.328667% |
| B | 14288 | 2938 | 20.562710% |
| C | 14288 | 161 | 1.126820% |
| D | 14288 | 144 | 1.007839% |
Noise dominated data is calculated using 1-second bins in cleaned event files. If a bin has >2000 counts, and if more than 50% of those come from <1% of pixels, then it is considered to be noise-dominated and hence unusable.
| Quadrant | # 1 sec bins | Bins with >0 counts | Bins with >2000 counts | High rate bins dominated by noise | Noise dominated (total time) | Noise dominated (detector-on time) | Marked lightcurve |
|---|---|---|---|---|---|---|---|
| A | 16583 | 14288 | 0 | 0 | 0.00% | 0.00% |  |
| B | 16583 | 14233 | 0 | 0 | 0.00% | 0.00% | 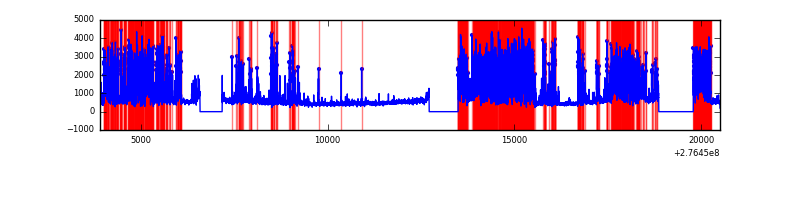 |
| C | 16583 | 14288 | 0 | 0 | 0.00% | 0.00% | 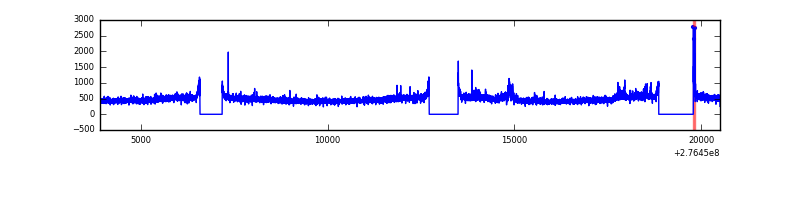 |
| D | 16583 | 14287 | 0 | 0 | 0.00% | 0.00% | 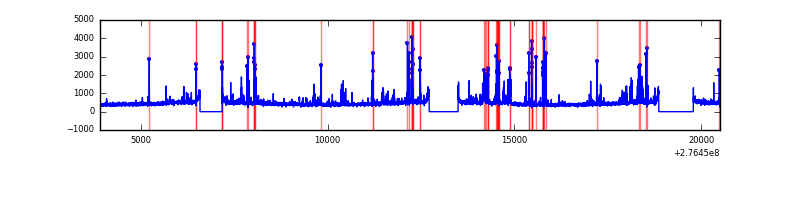 |
Top three noisy pixels from each quadrant. If the there are fewer than three noisy pixels in the level2.evt file, extra rows are filled as -1
| Pixel properties | Quadrant properties | ||||||
|---|---|---|---|---|---|---|---|
| Quadrant | DetID | PixID | Counts | Sigma | Mean | Median | Sigma |
| A | 0 | 29 | 732 | 10.5 | 200 | 188 | 51.8 |
| A | 7 | 110 | 659 | 9.09 | 200 | 188 | 51.8 |
| A | 0 | 30 | 610 | 8.14 | 200 | 188 | 51.8 |
| B | 2 | 9 | 518 | 9.21 | 179 | 171 | 37.7 |
| B | 14 | 254 | 459 | 7.65 | 179 | 171 | 37.7 |
| B | 3 | 17 | 455 | 7.54 | 179 | 171 | 37.7 |
| C | 1 | 81 | 651 | 8.2 | 207 | 193 | 55.9 |
| C | 1 | 80 | 621 | 7.66 | 207 | 193 | 55.9 |
| C | 12 | 241 | 539 | 6.19 | 207 | 193 | 55.9 |
| D | 13 | 238 | 530 | 6.53 | 195 | 177 | 54.0 |
| D | 6 | 231 | 515 | 6.26 | 195 | 177 | 54.0 |
| D | 3 | 14 | 508 | 6.13 | 195 | 177 | 54.0 |
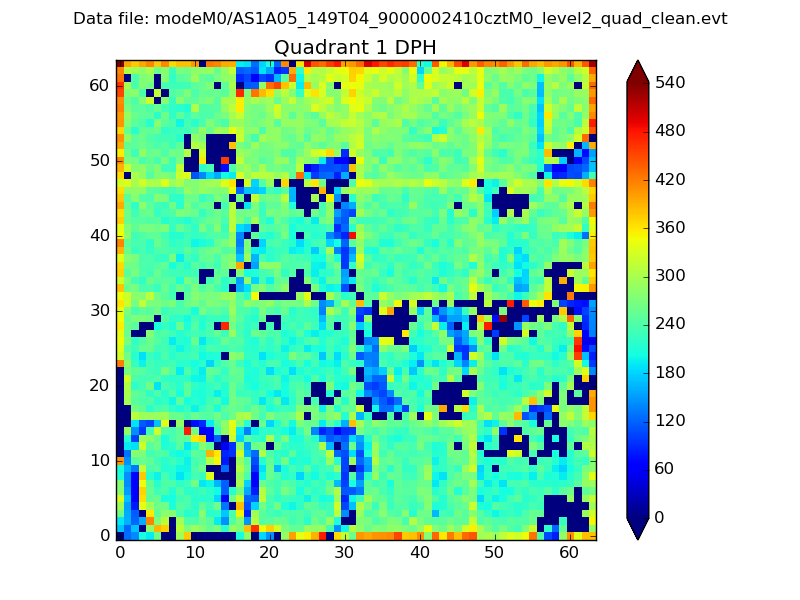
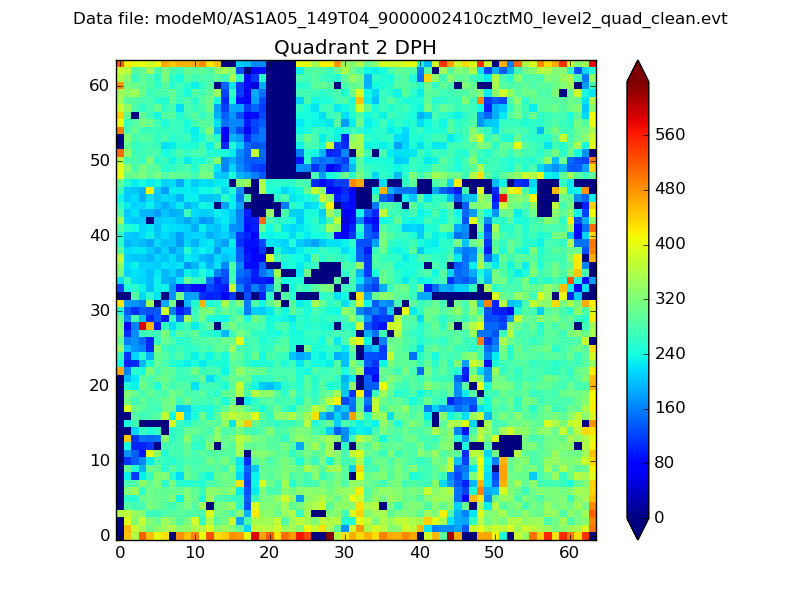
Histogram calculated using DETX and DETY for each event in the final _common_clean file
| Quadrant A | 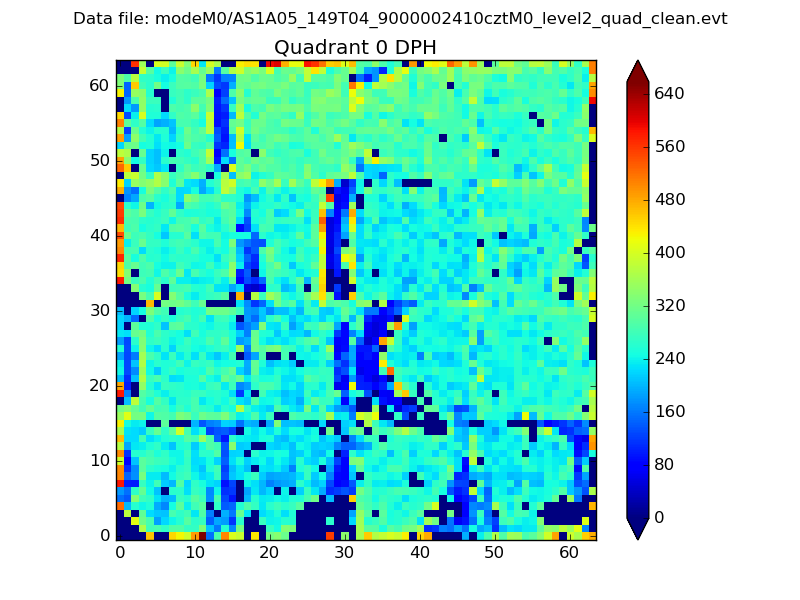 |
 |
Quadrant B |
|---|---|---|---|
| Quadrant D | 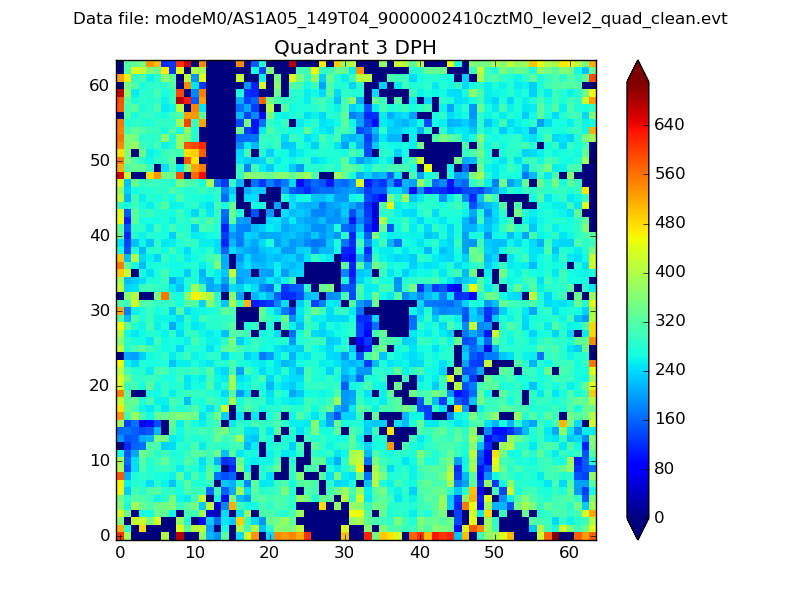 |
 |
Quadrant C |
| Plot type | Count rate plots | Images |
|---|---|---|
| Comparison with Poisson distribution Blue bars denote a histogram of data divided into 1 sec bins. Red curve is a Poisson curve with rate = median count rate of data. |
 |
 |
| Quadrant-wise count rates Data is divided into 100 sec bins |
 |
|
| Module-wise count rates for Quadrant A Data is divided into 100 sec bins |
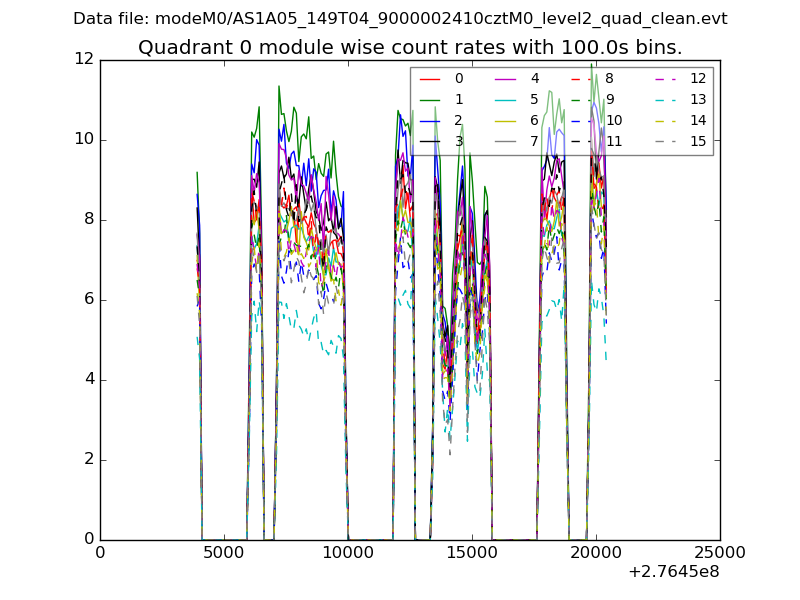 |
 |
| Module-wise count rates for Quadrant B Data is divided into 100 sec bins |
 |
 |
| Module-wise count rates for Quadrant C Data is divided into 100 sec bins |
 |
 |
| Module-wise count rates for Quadrant D Data is divided into 100 sec bins |
 |
 |
| Parameter | Plot |
|---|---|
| CZT HV Monitor |  |
| D_VDD | 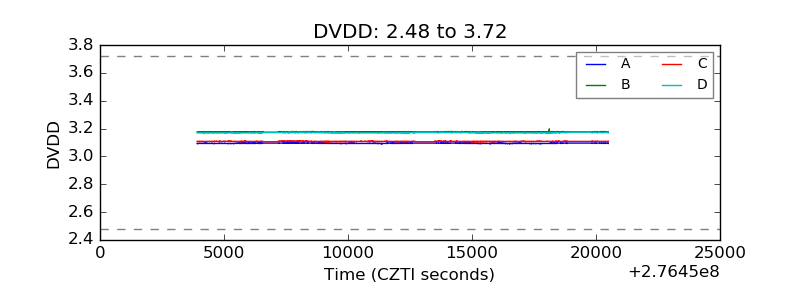 |
| Temperature 1 |  |
| Veto HV Monitor | 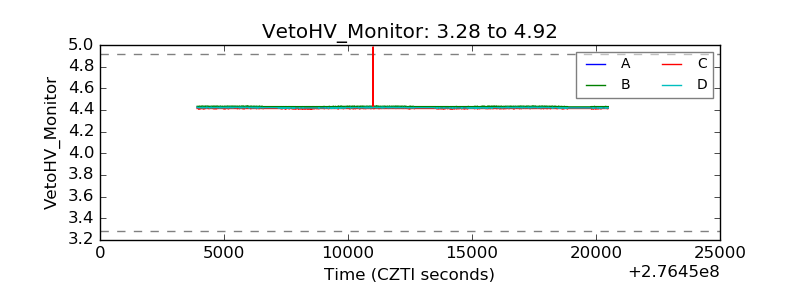 |
| Veto LLD | 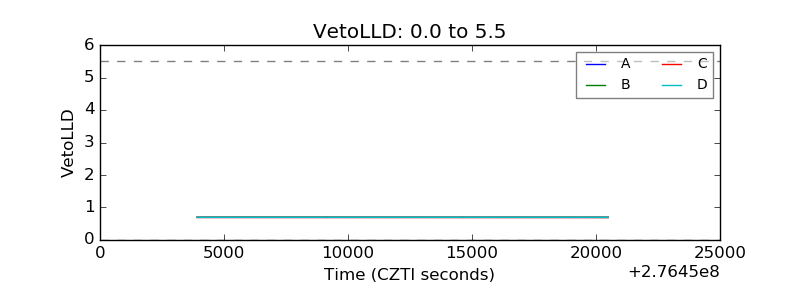 |
| Alpha Counter |  |
| _CPM_Rate | 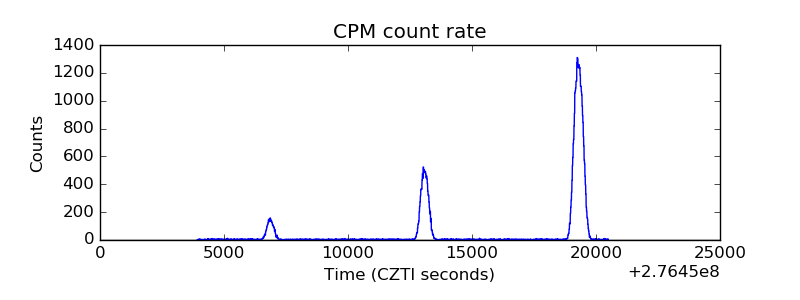 |
| CZT Counter |  |
| +2.5 Volts monitor | 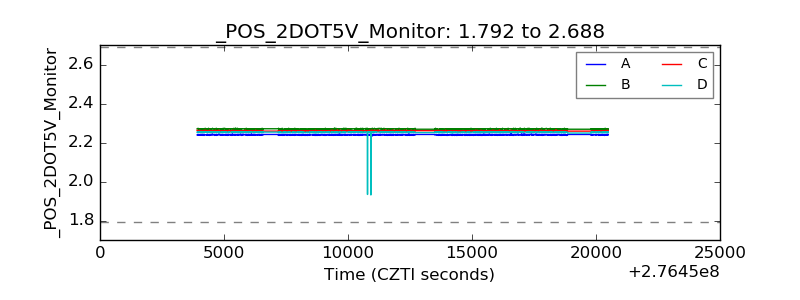 |
| +5 Volts monitor | 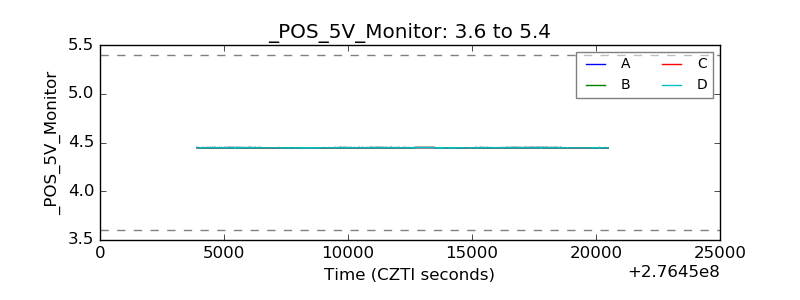 |
| _ROLL_ROT | 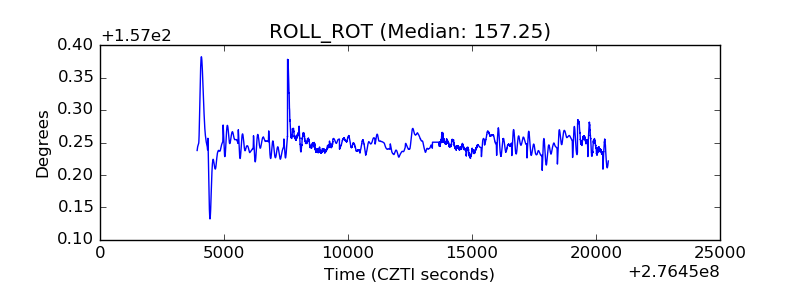 |
| _Roll_DEC |  |
| _Roll_RA | 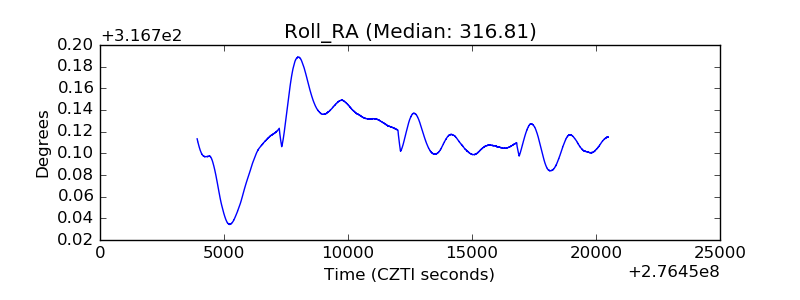 |
| Veto Counter |  |