| Param | Original file | Final file |
|---|---|---|
| Filename | modeM0/AS1A05_149T04_9000002410_16335cztM0_level2.evt | modeM0/AS1A05_149T04_9000002410_16335cztM0_level2_quad_clean.evt |
| Size (bytes) | 852,572,160 | 112,694,400 |
| Size | 813.1 MB | 107.5 MB |
| Events in quadrant A | 6,662,015 | 676,614 |
| Events in quadrant B | 8,910,756 | 666,790 |
| Events in quadrant C | 4,669,200 | 707,662 |
| Events in quadrant D | 4,922,473 | 689,095 |
| Mode SS | |||
|---|---|---|---|
| Quadrant | BADHDUFLAG | Total packets | Discarded packets |
| A | 0 | 196 | 0 |
| B | 0 | 196 | 0 |
| C | 0 | 196 | 0 |
| D | 0 | 196 | 0 |
| Mode M0 | |||
|---|---|---|---|
| Quadrant | BADHDUFLAG | Total packets | Discarded packets |
| A | 0 | 26394 | 3 |
| B | 0 | 33036 | 2 |
| C | 0 | 20112 | 2 |
| D | 0 | 21497 | 2 |
| Mode M9 | |||
|---|---|---|---|
| Quadrant | BADHDUFLAG | Total packets | Discarded packets |
| A | 0 | 14 | 0 |
| B | 0 | 14 | 0 |
| C | 0 | 14 | 0 |
| D | 0 | 14 | 0 |
| Quadrant | Total seconds | Saturated seconds | Saturation percentage |
|---|---|---|---|
| A | 9698 | 887 | 9.146216% |
| B | 9698 | 1680 | 17.323159% |
| C | 9698 | 99 | 1.020829% |
| D | 9698 | 99 | 1.020829% |
Noise dominated data is calculated using 1-second bins in cleaned event files. If a bin has >2000 counts, and if more than 50% of those come from <1% of pixels, then it is considered to be noise-dominated and hence unusable.
| Quadrant | # 1 sec bins | Bins with >0 counts | Bins with >2000 counts | High rate bins dominated by noise | Noise dominated (total time) | Noise dominated (detector-on time) | Marked lightcurve |
|---|---|---|---|---|---|---|---|
| A | 11069 | 9701 | 679 | 679 | 6.13% | 7.00% | 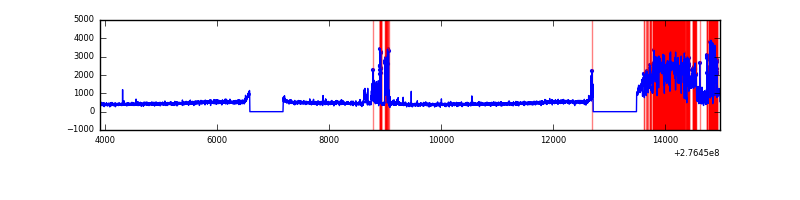 |
| B | 11068 | 9700 | 1113 | 1113 | 10.06% | 11.47% | 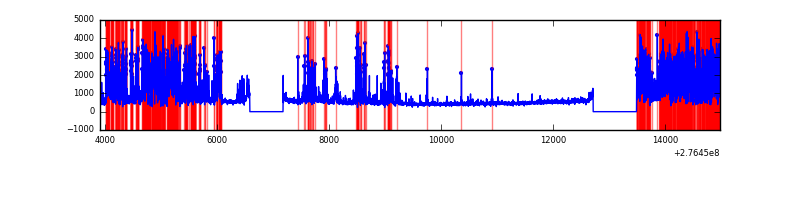 |
| C | 11069 | 9701 | 0 | 0 | 0.00% | 0.00% | 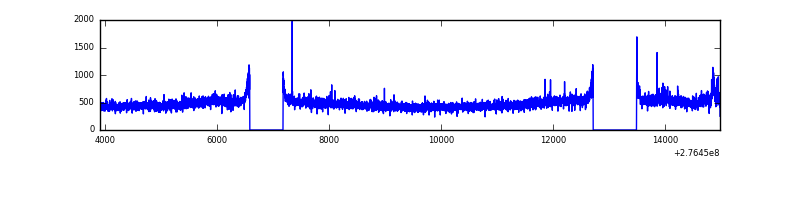 |
| D | 11069 | 9701 | 44 | 44 | 0.40% | 0.45% | 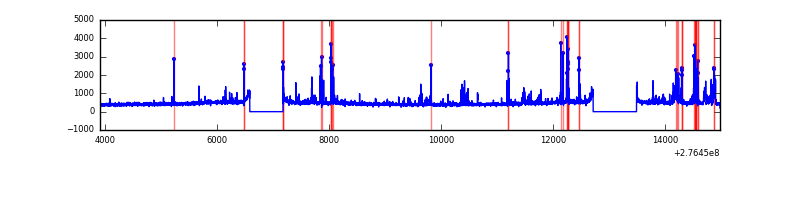 |
Top three noisy pixels from each quadrant. If the there are fewer than three noisy pixels in the level2.evt file, extra rows are filled as -1
| Pixel properties | Quadrant properties | ||||||
|---|---|---|---|---|---|---|---|
| Quadrant | DetID | PixID | Counts | Sigma | Mean | Median | Sigma |
| A | 15 | 174 | 2376970 | 10563.03 | 1113 | 1088 | 224.9 |
| A | 0 | 226 | 9818 | 38.81 | 1113 | 1088 | 224.9 |
| A | 12 | 194 | 8149 | 31.39 | 1113 | 1088 | 224.9 |
| B | 3 | 112 | 4310285 | 21268.59 | 1066 | 1040 | 202.6 |
| B | 0 | 189 | 109750 | 536.55 | 1066 | 1040 | 202.6 |
| B | 5 | 65 | 90517 | 441.62 | 1066 | 1040 | 202.6 |
| C | 14 | 238 | 169415 | 645.87 | 1110 | 1115 | 260.6 |
| C | 3 | 233 | 162435 | 619.08 | 1110 | 1115 | 260.6 |
| C | 0 | 207 | 9598 | 32.55 | 1110 | 1115 | 260.6 |
| D | 12 | 218 | 395178 | 1450.68 | 1120 | 1087 | 271.7 |
| D | 12 | 110 | 124342 | 453.71 | 1120 | 1087 | 271.7 |
| D | 10 | 70 | 74655 | 270.81 | 1120 | 1087 | 271.7 |
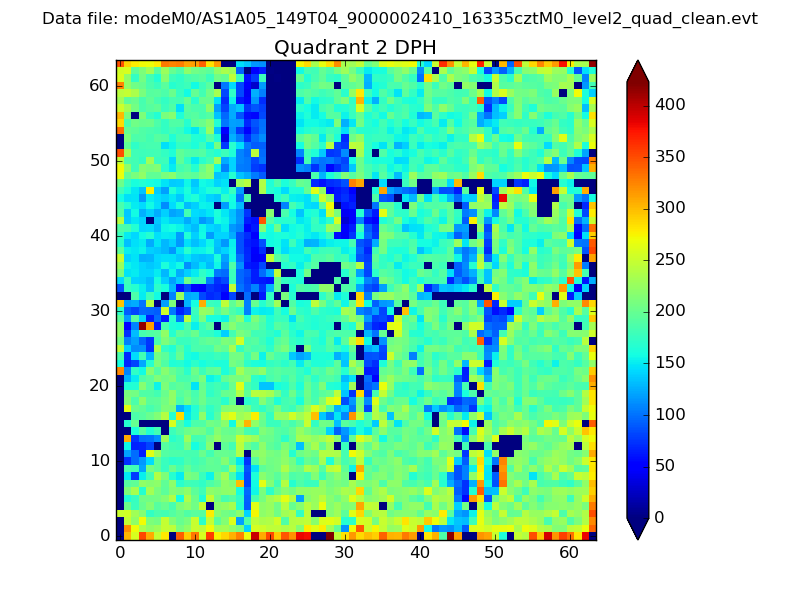
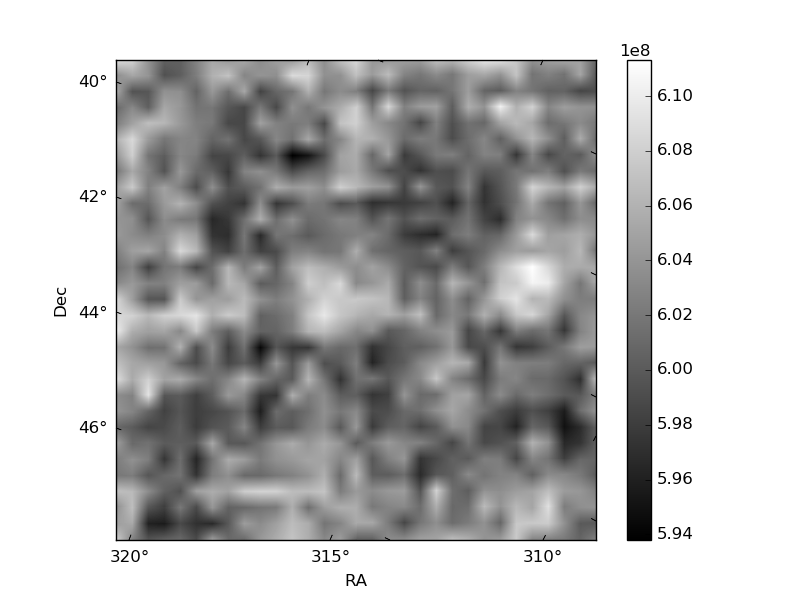
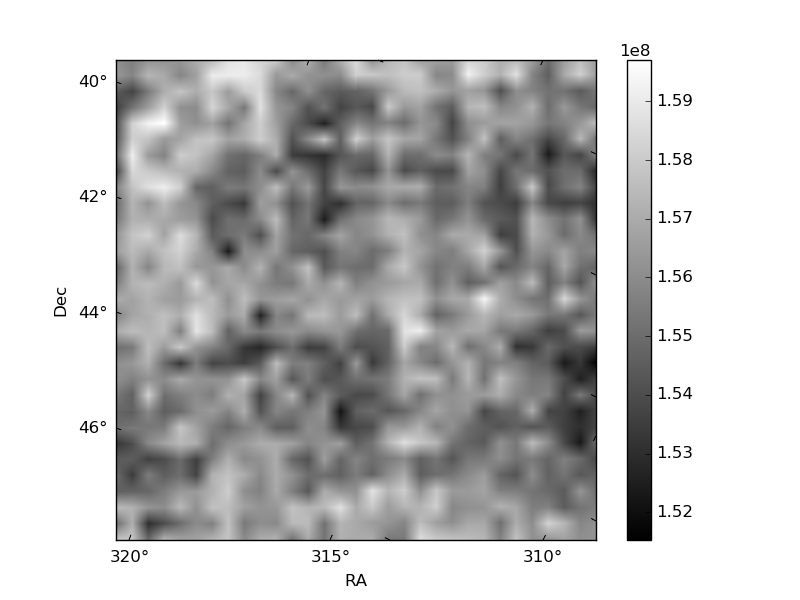
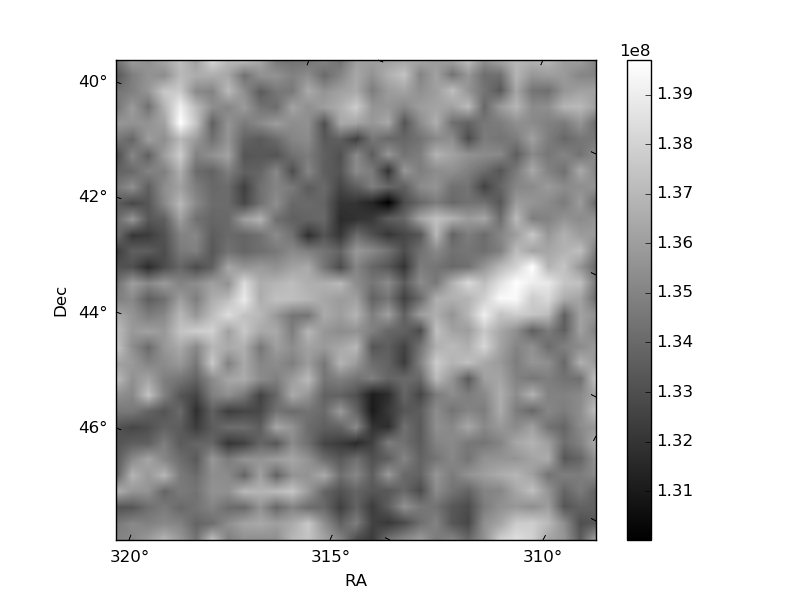
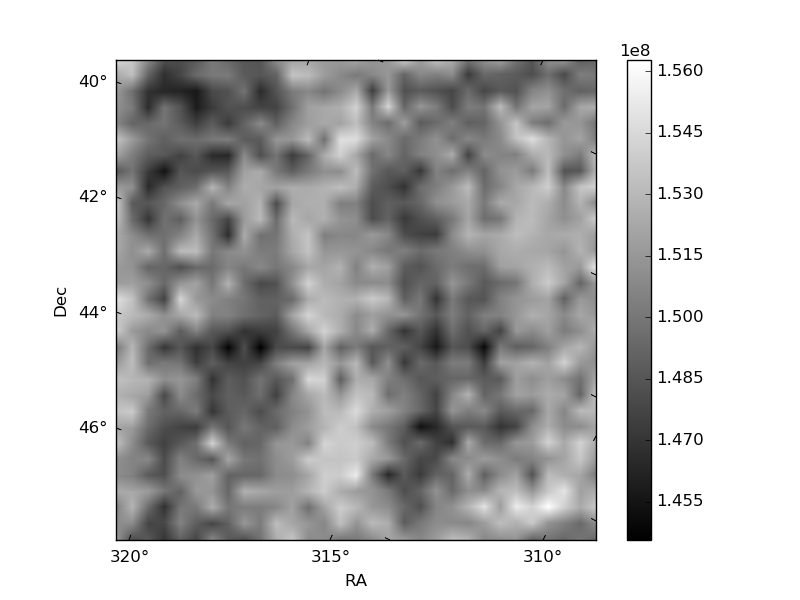
Histogram calculated using DETX and DETY for each event in the final _common_clean file
| Quadrant A | 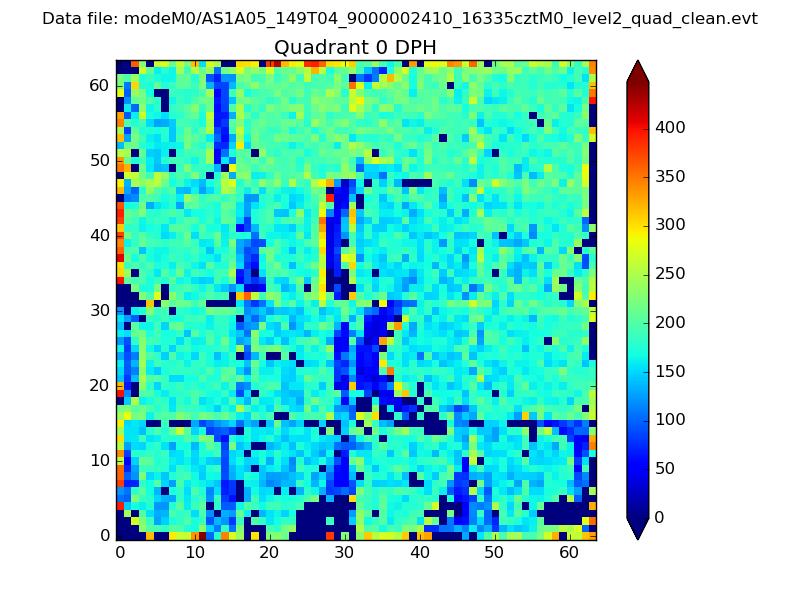 |
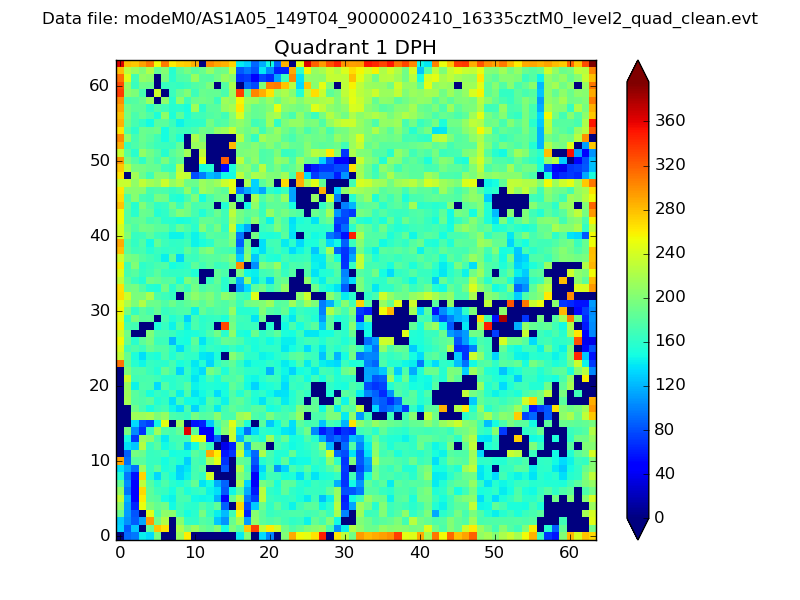 |
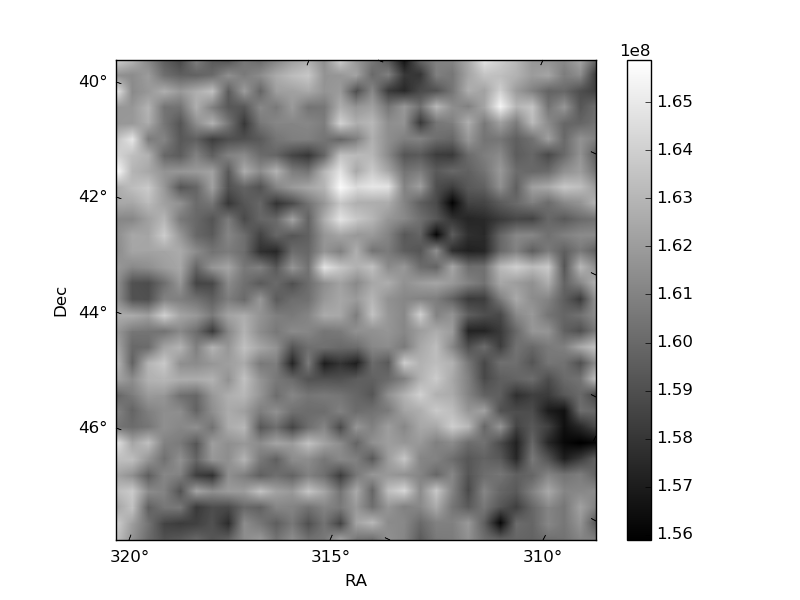
Quadrant B |
|---|---|---|---|
| Quadrant D | 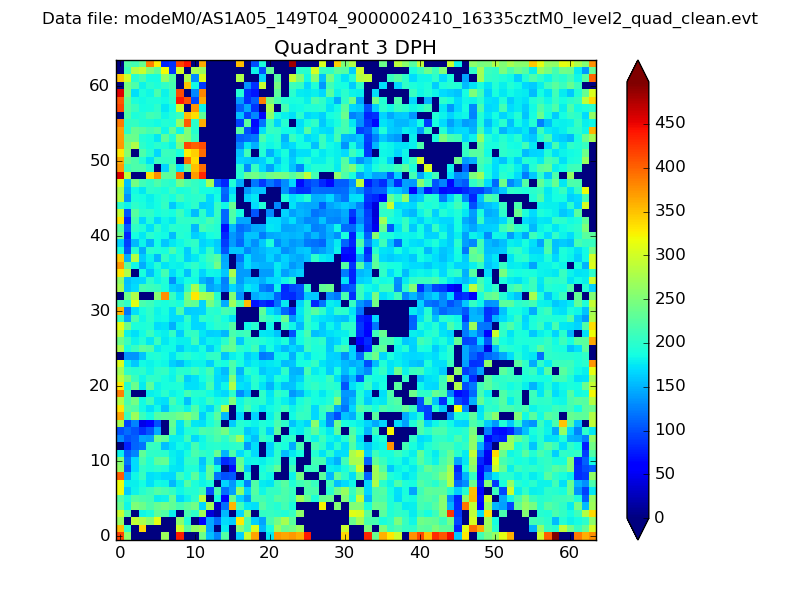 |
 |
Quadrant C |
| Plot type | Count rate plots | Images |
|---|---|---|
| Comparison with Poisson distribution Blue bars denote a histogram of data divided into 1 sec bins. Red curve is a Poisson curve with rate = median count rate of data. |
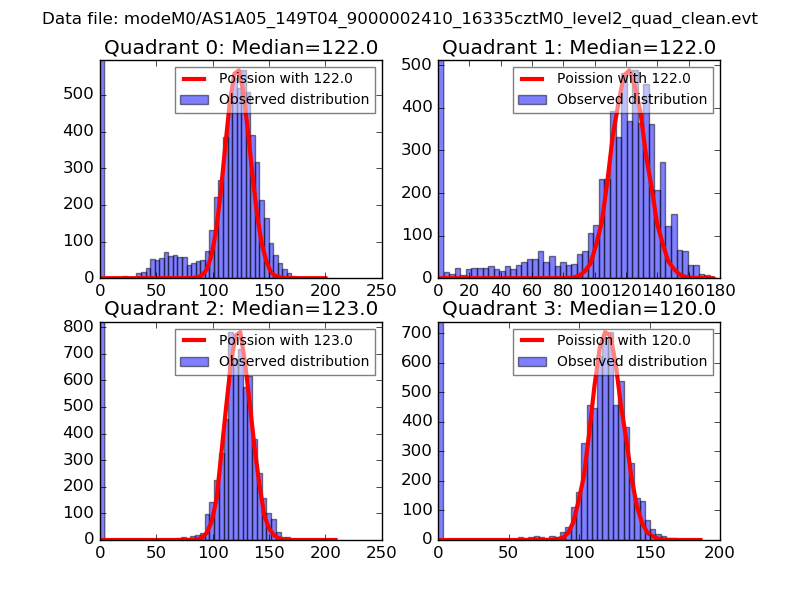 |
 |
| Quadrant-wise count rates Data is divided into 100 sec bins |
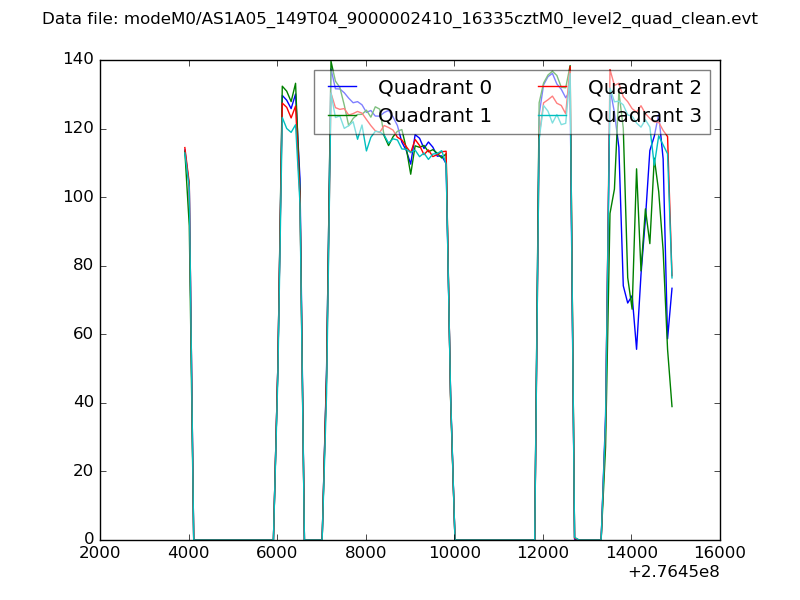 |
|
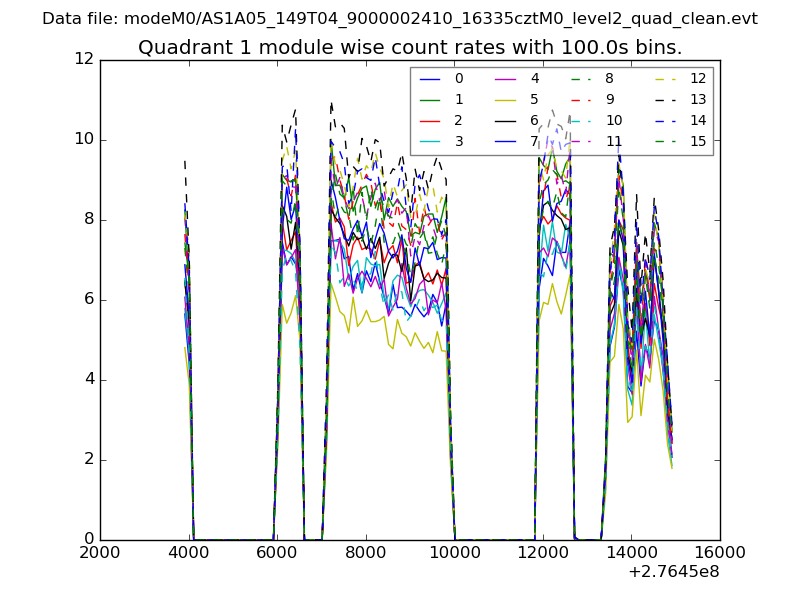
| Module-wise count rates for Quadrant A Data is divided into 100 sec bins |
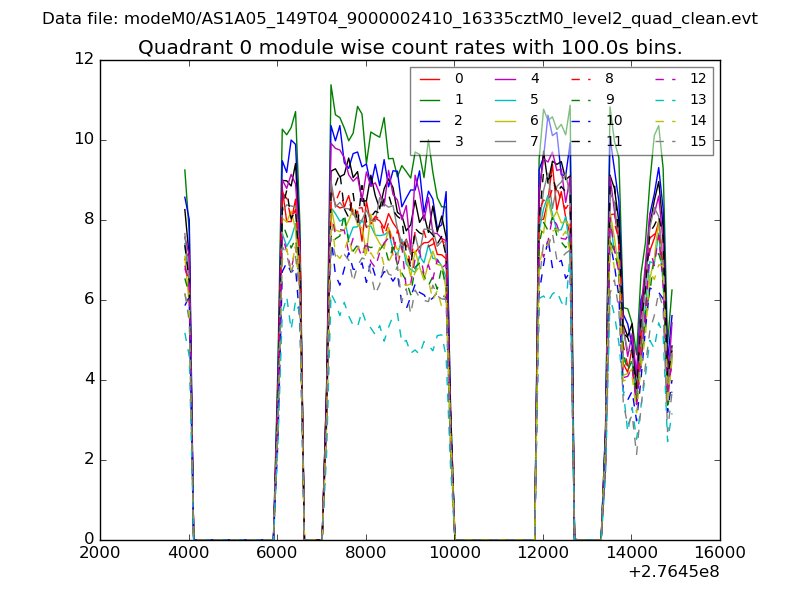 |
 |
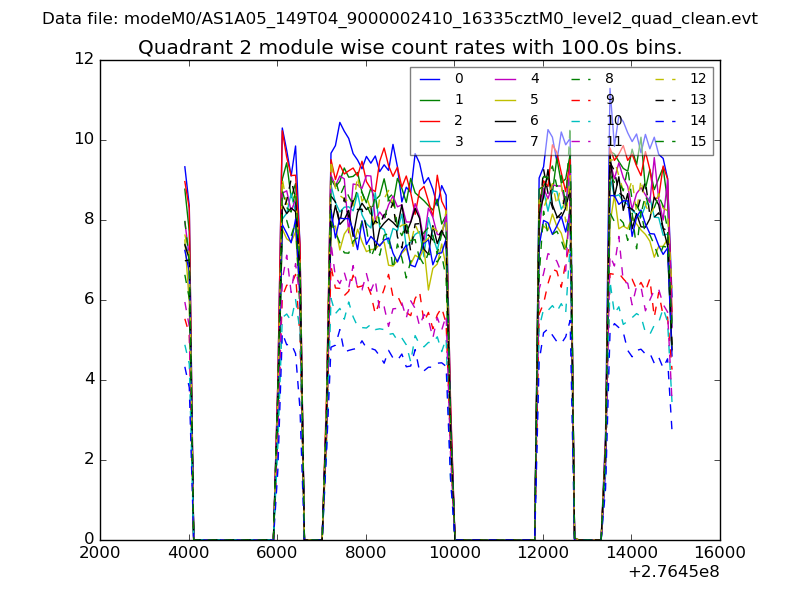
| Module-wise count rates for Quadrant B Data is divided into 100 sec bins |
 |
 |
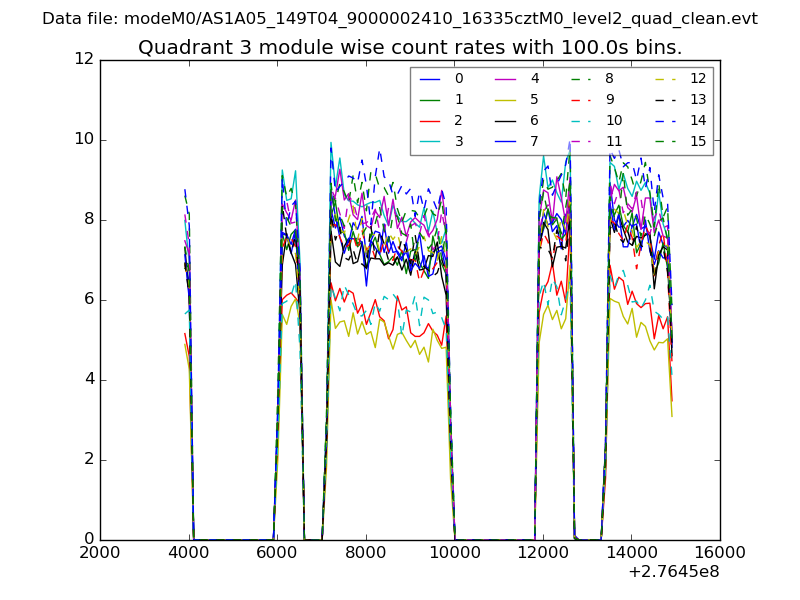
| Module-wise count rates for Quadrant C Data is divided into 100 sec bins |
 |
 |
| Module-wise count rates for Quadrant D Data is divided into 100 sec bins |
 |
 |
| Parameter | Plot |
|---|---|
| CZT HV Monitor | 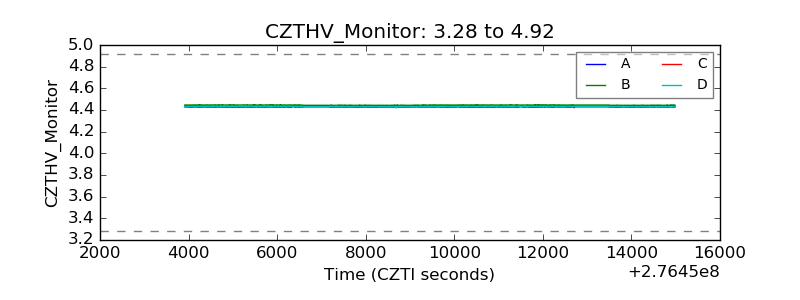 |
| D_VDD | 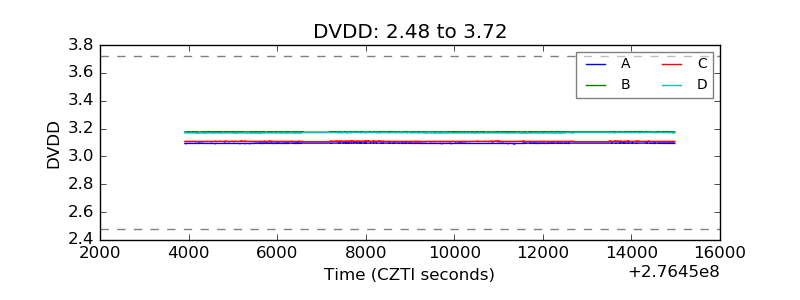 |
| Temperature 1 | 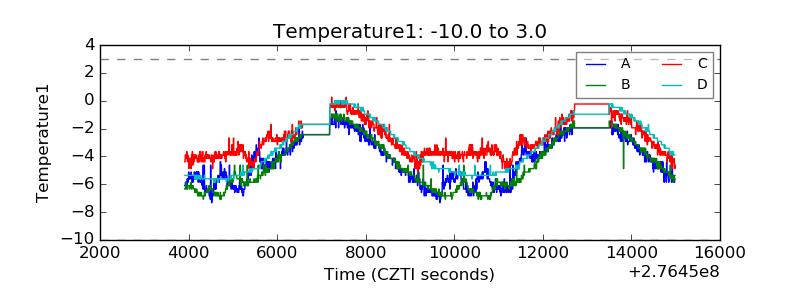 |
| Veto HV Monitor | 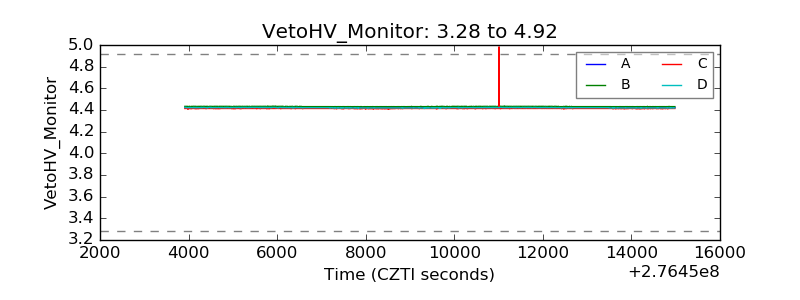 |
| Veto LLD | 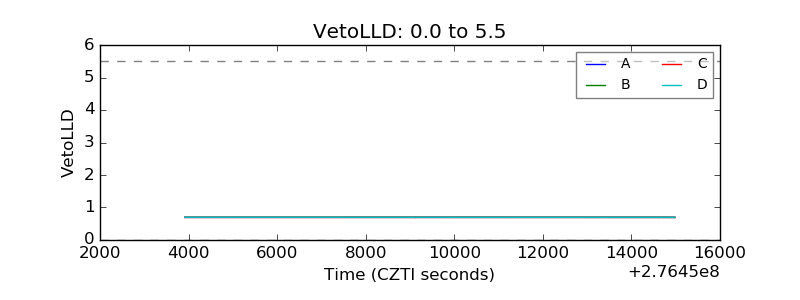 |
| Alpha Counter | 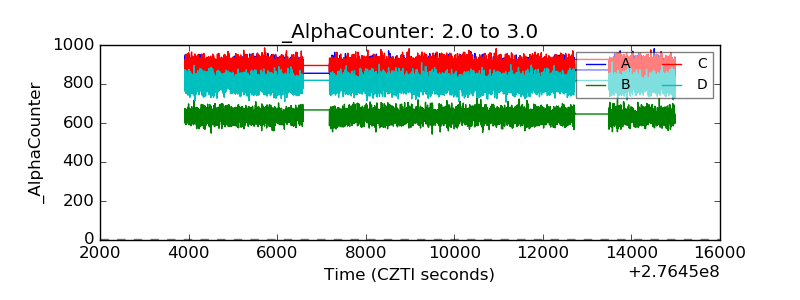 |
| _CPM_Rate | 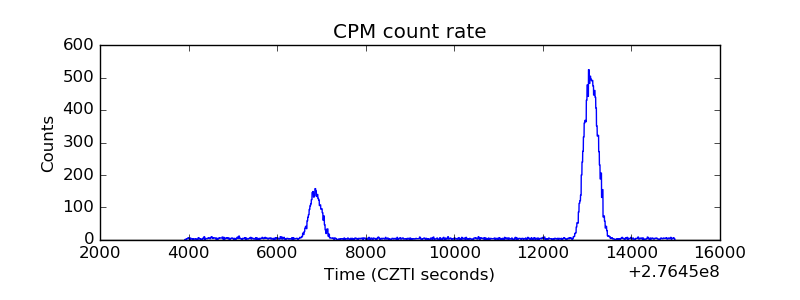 |
| CZT Counter | 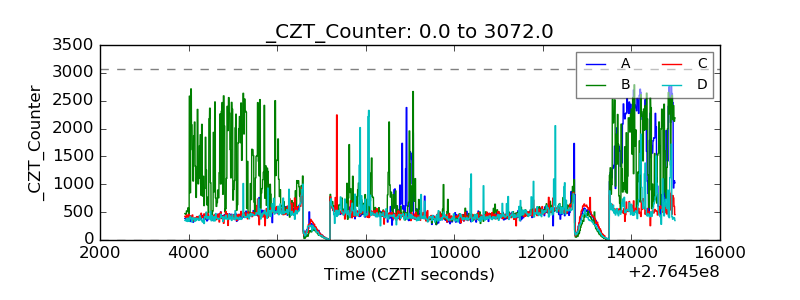 |
| +2.5 Volts monitor |  |
| +5 Volts monitor |  |
| _ROLL_ROT | 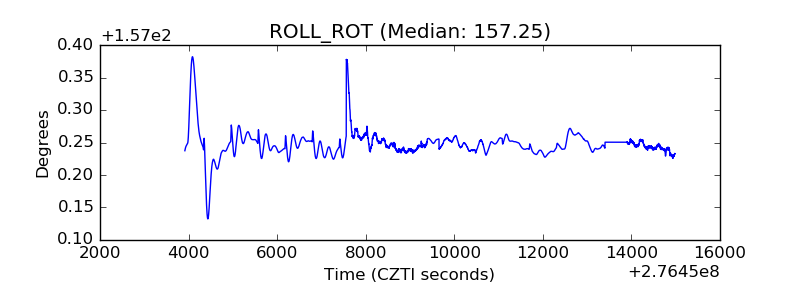 |
| _Roll_DEC | 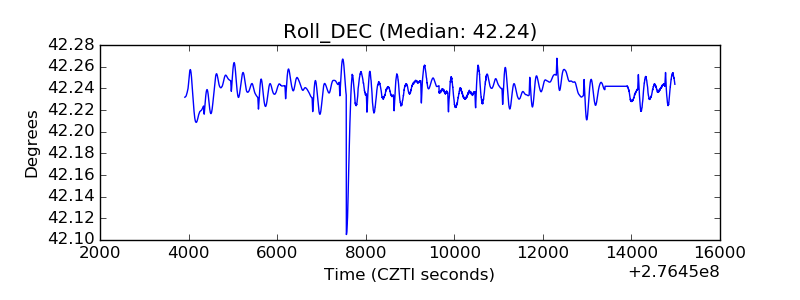 |
| _Roll_RA |  |
| Veto Counter | 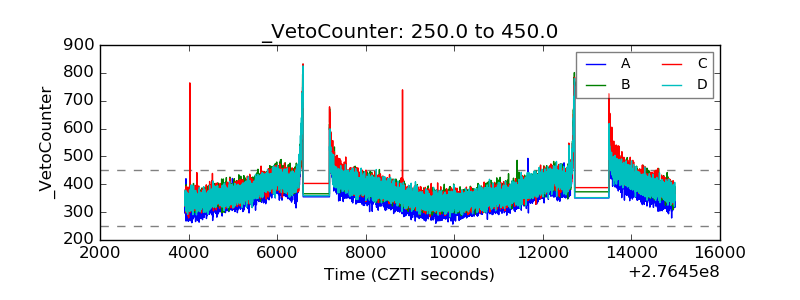 |