| Param | Original file | Final file |
|---|---|---|
| Filename | modeM0/AS1A05_149T04_9000002410_16337cztM0_level2.evt | modeM0/AS1A05_149T04_9000002410_16337cztM0_level2_quad_clean.evt |
| Size (bytes) | 638,040,960 | 73,500,480 |
| Size | 608.5 MB | 70.1 MB |
| Events in quadrant A | 5,399,362 | 447,144 |
| Events in quadrant B | 7,451,083 | 393,596 |
| Events in quadrant C | 2,981,988 | 492,392 |
| Events in quadrant D | 3,090,611 | 478,592 |
| Mode SS | |||
|---|---|---|---|
| Quadrant | BADHDUFLAG | Total packets | Discarded packets |
| A | 0 | 122 | 0 |
| B | 0 | 122 | 0 |
| C | 0 | 122 | 0 |
| D | 0 | 122 | 0 |
| Mode M0 | |||
|---|---|---|---|
| Quadrant | BADHDUFLAG | Total packets | Discarded packets |
| A | 0 | 20114 | 1 |
| B | 0 | 26263 | 1 |
| C | 0 | 12735 | 1 |
| D | 0 | 13384 | 1 |
| Mode M9 | |||
|---|---|---|---|
| Quadrant | BADHDUFLAG | Total packets | Discarded packets |
| A | 0 | 9 | 0 |
| B | 0 | 9 | 0 |
| C | 0 | 9 | 0 |
| D | 0 | 9 | 0 |
| Quadrant | Total seconds | Saturated seconds | Saturation percentage |
|---|---|---|---|
| A | 5900 | 1065 | 18.050847% |
| B | 5900 | 1952 | 33.084746% |
| C | 5900 | 68 | 1.152542% |
| D | 5900 | 63 | 1.067797% |
Noise dominated data is calculated using 1-second bins in cleaned event files. If a bin has >2000 counts, and if more than 50% of those come from <1% of pixels, then it is considered to be noise-dominated and hence unusable.
| Quadrant | # 1 sec bins | Bins with >0 counts | Bins with >2000 counts | High rate bins dominated by noise | Noise dominated (total time) | Noise dominated (detector-on time) | Marked lightcurve |
|---|---|---|---|---|---|---|---|
| A | 6826 | 5902 | 925 | 925 | 13.55% | 15.67% | 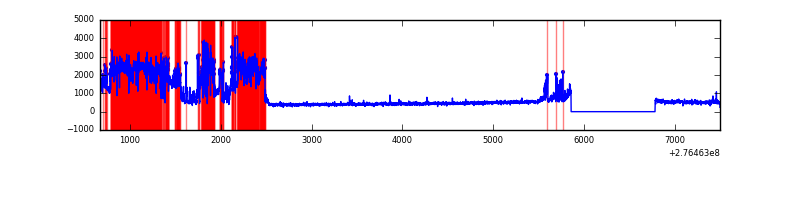 |
| B | 6826 | 5902 | 1326 | 1326 | 19.43% | 22.47% | 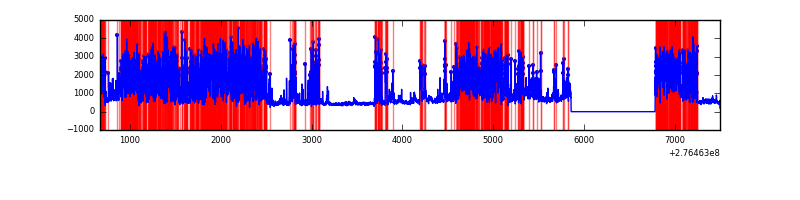 |
| C | 6826 | 5902 | 3 | 3 | 0.04% | 0.05% |  |
| D | 6826 | 5902 | 38 | 38 | 0.56% | 0.64% | 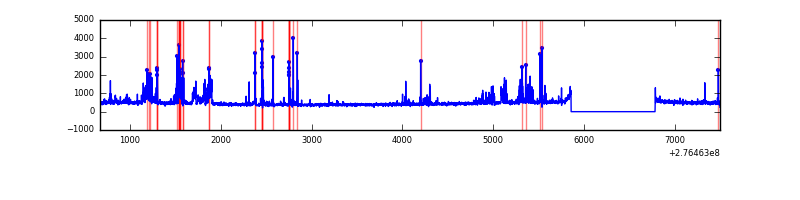 |
Top three noisy pixels from each quadrant. If the there are fewer than three noisy pixels in the level2.evt file, extra rows are filled as -1
| Pixel properties | Quadrant properties | ||||||
|---|---|---|---|---|---|---|---|
| Quadrant | DetID | PixID | Counts | Sigma | Mean | Median | Sigma |
| A | 15 | 174 | 2894111 | 21941.79 | 650 | 635 | 131.9 |
| A | 0 | 226 | 5673 | 38.2 | 650 | 635 | 131.9 |
| A | 12 | 194 | 4713 | 30.92 | 650 | 635 | 131.9 |
| B | 3 | 112 | 4388373 | 39325.17 | 589 | 576 | 111.6 |
| B | 10 | 247 | 249083 | 2227.22 | 589 | 576 | 111.6 |
| B | 10 | 16 | 181850 | 1624.65 | 589 | 576 | 111.6 |
| C | 3 | 233 | 241590 | 1529.81 | 671 | 676 | 157.5 |
| C | 14 | 238 | 103366 | 652.08 | 671 | 676 | 157.5 |
| C | 0 | 207 | 18211 | 111.35 | 671 | 676 | 157.5 |
| D | 12 | 218 | 319783 | 1910.74 | 678 | 656 | 167.0 |
| D | 10 | 70 | 100762 | 599.37 | 678 | 656 | 167.0 |
| D | 12 | 110 | 63663 | 377.25 | 678 | 656 | 167.0 |
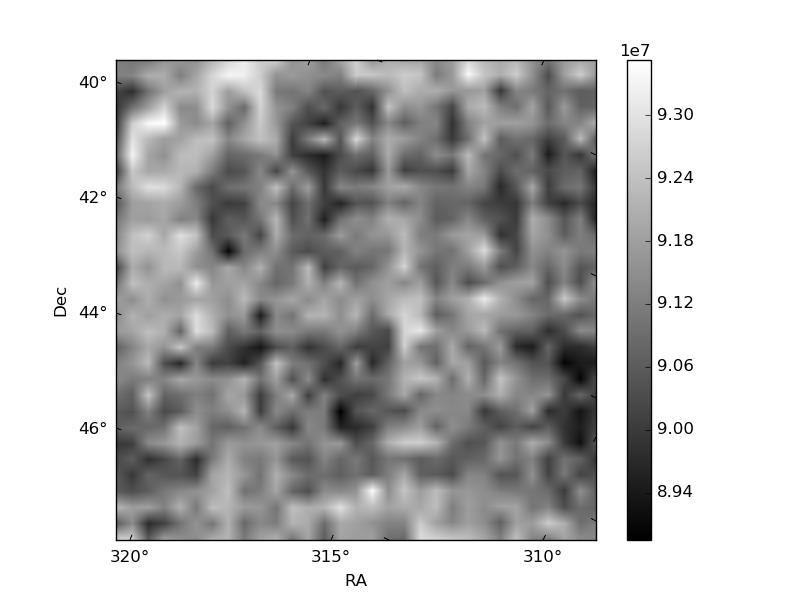
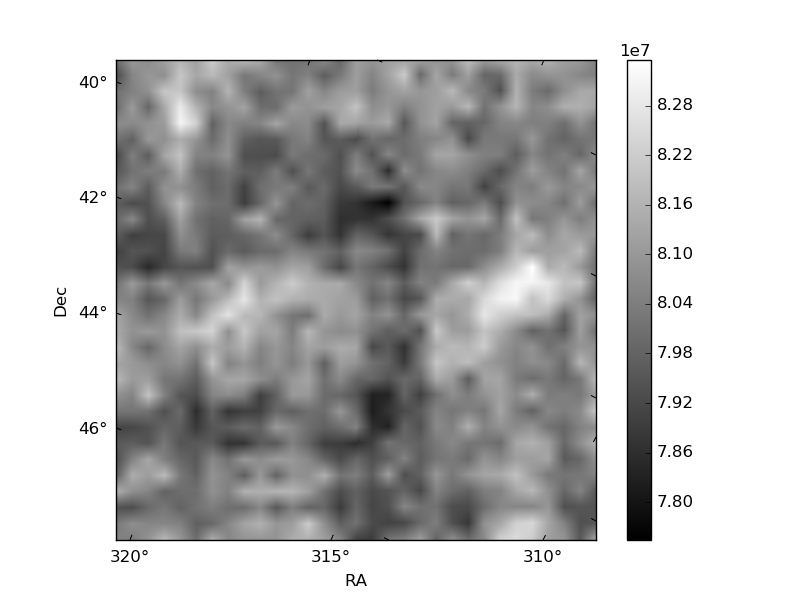
Histogram calculated using DETX and DETY for each event in the final _common_clean file
| Quadrant A |  |
 |
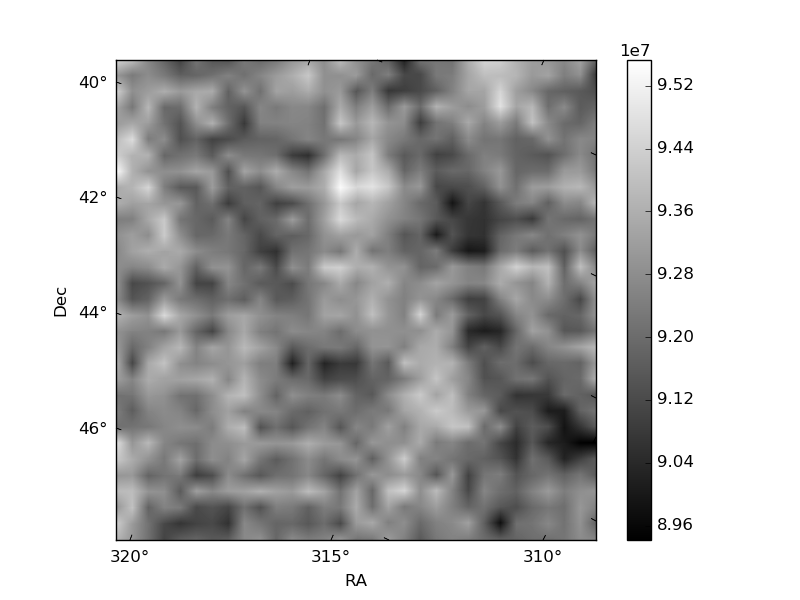
Quadrant B |
|---|---|---|---|
| Quadrant D | 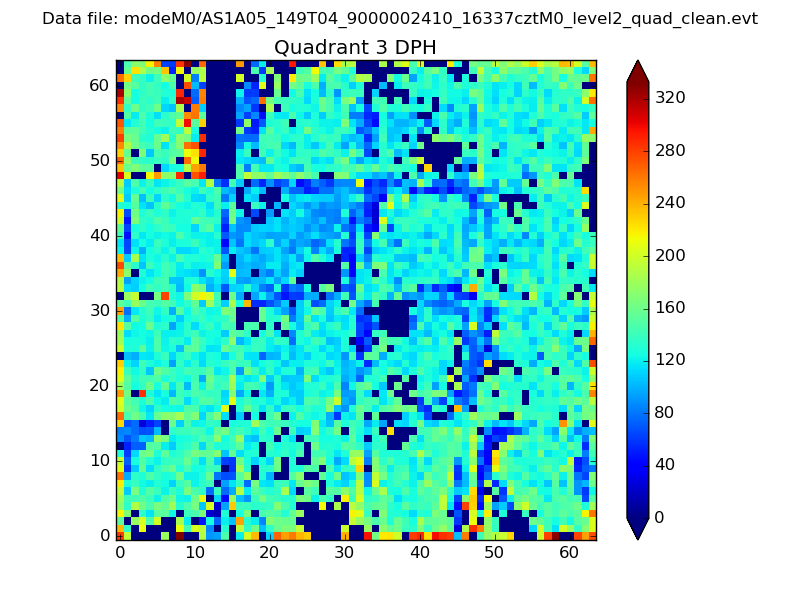 |
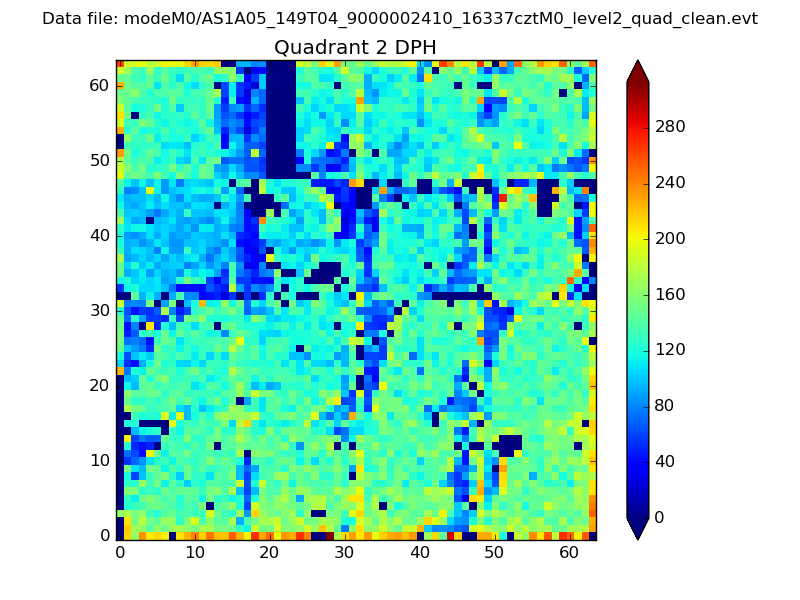 |
Quadrant C |
| Plot type | Count rate plots | Images |
|---|---|---|
| Comparison with Poisson distribution Blue bars denote a histogram of data divided into 1 sec bins. Red curve is a Poisson curve with rate = median count rate of data. |
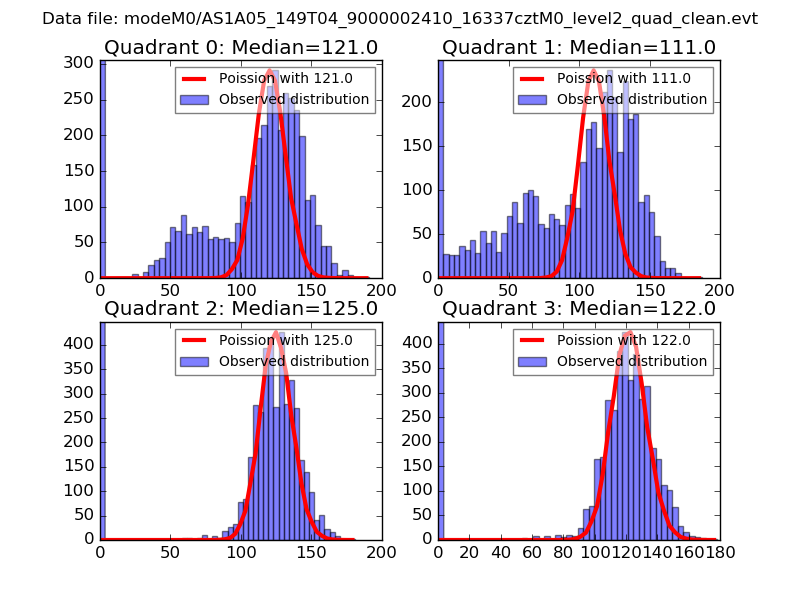 |
 |
| Quadrant-wise count rates Data is divided into 100 sec bins |
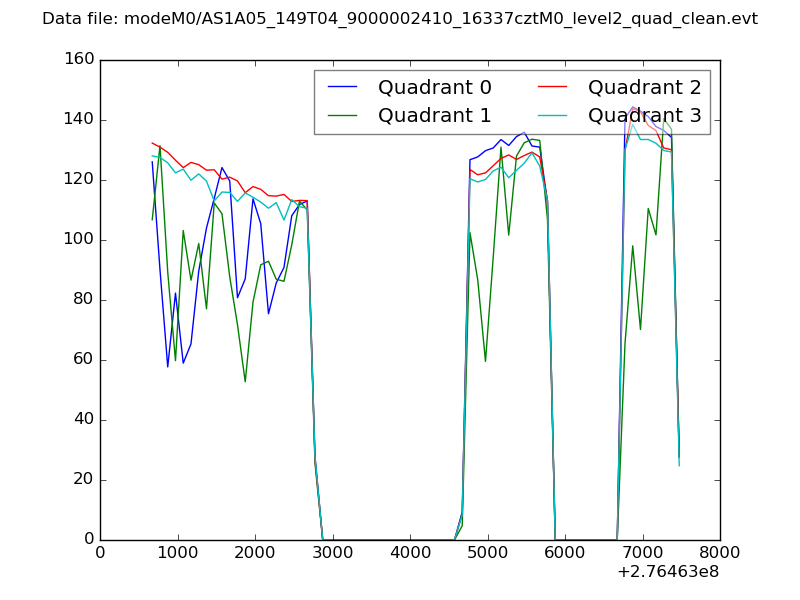 |
|
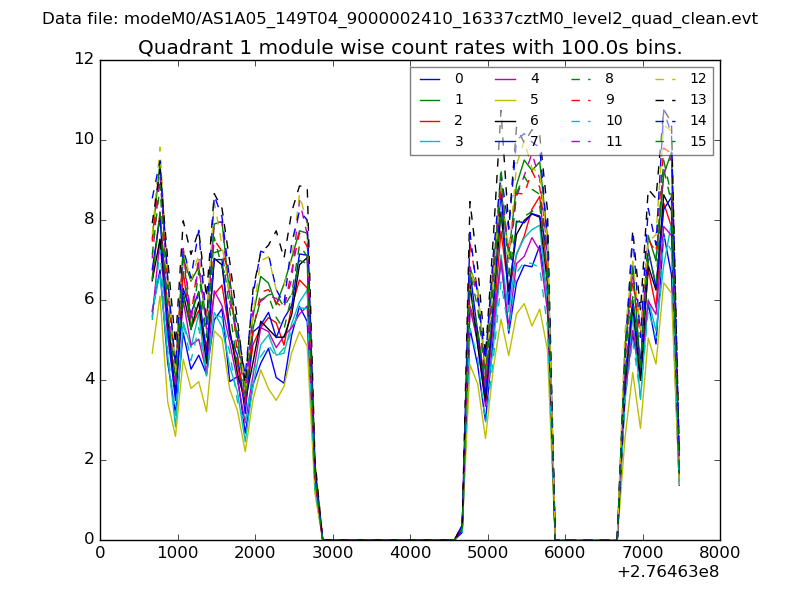
| Module-wise count rates for Quadrant A Data is divided into 100 sec bins |
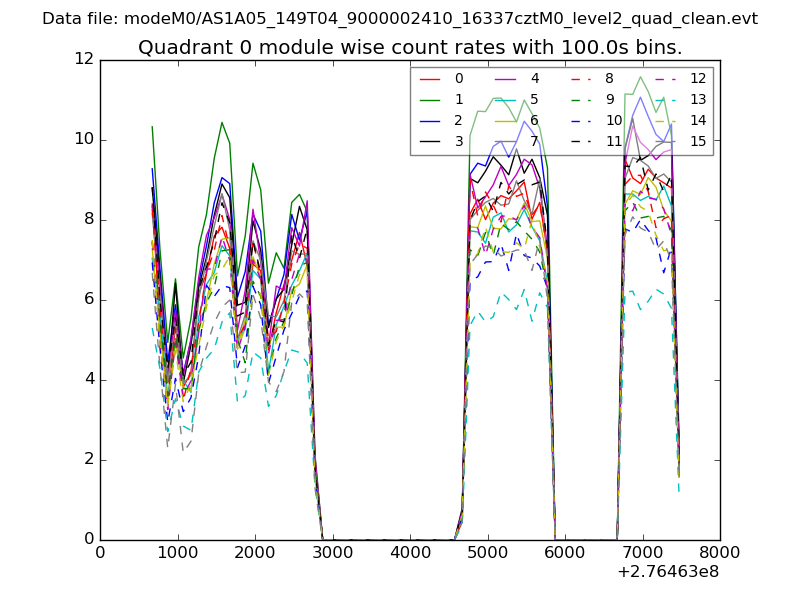 |
 |
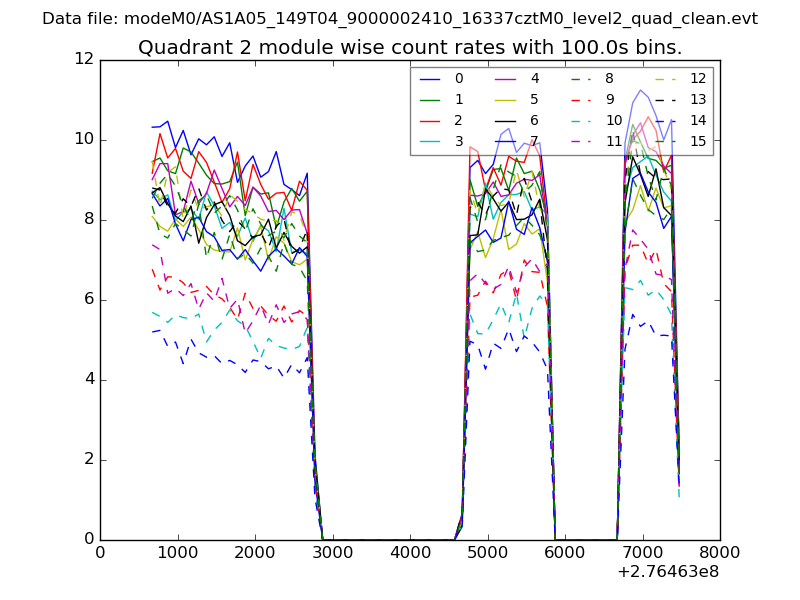
| Module-wise count rates for Quadrant B Data is divided into 100 sec bins |
 |
 |
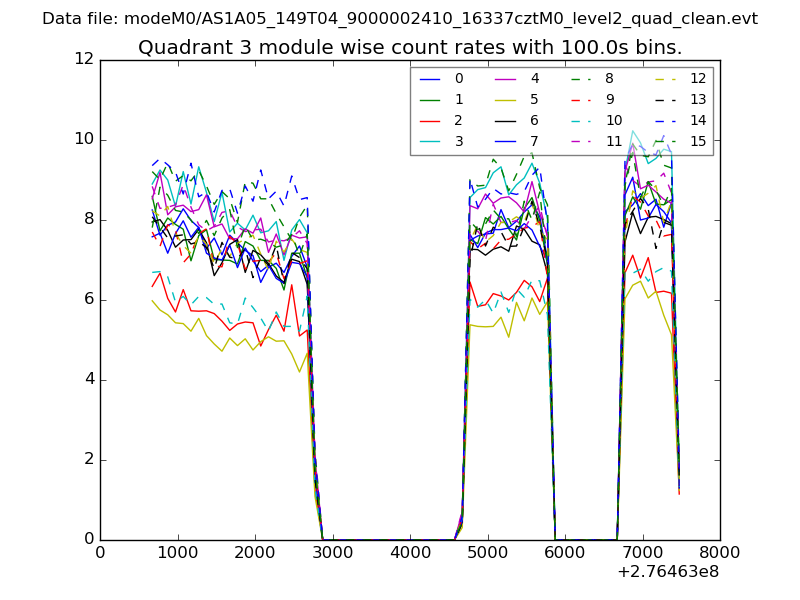
| Module-wise count rates for Quadrant C Data is divided into 100 sec bins |
 |
 |
| Module-wise count rates for Quadrant D Data is divided into 100 sec bins |
 |
 |
| Parameter | Plot |
|---|---|
| CZT HV Monitor | 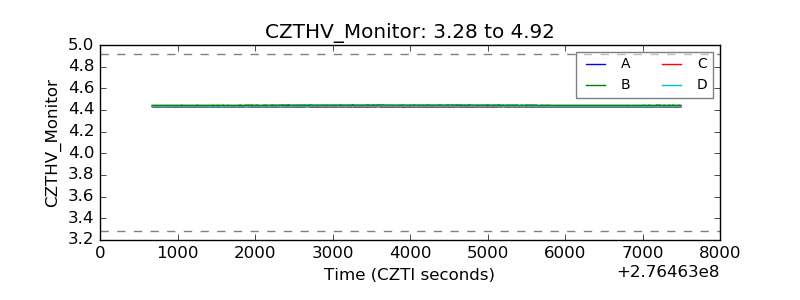 |
| D_VDD | 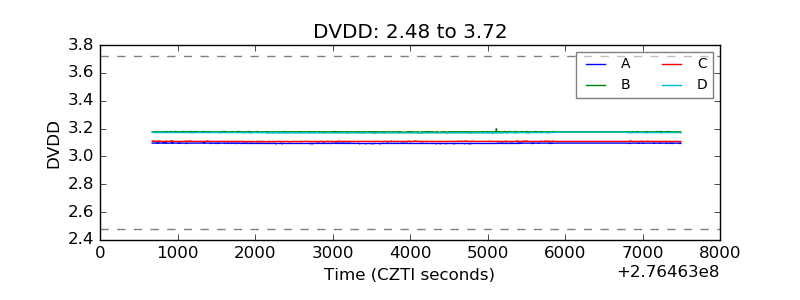 |
| Temperature 1 | 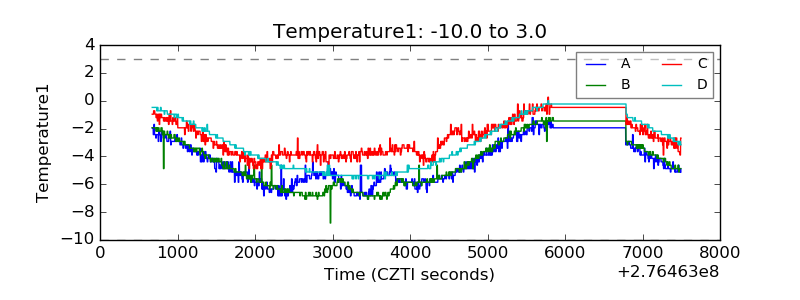 |
| Veto HV Monitor | 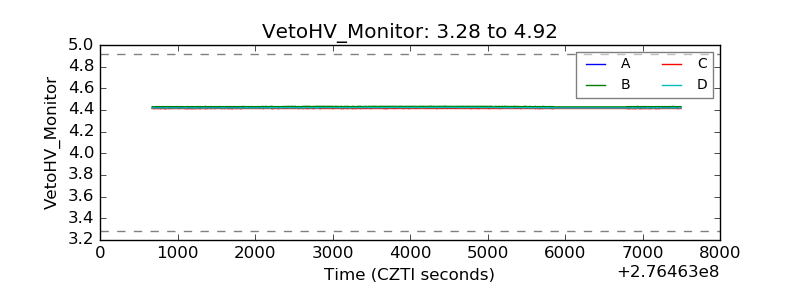 |
| Veto LLD | 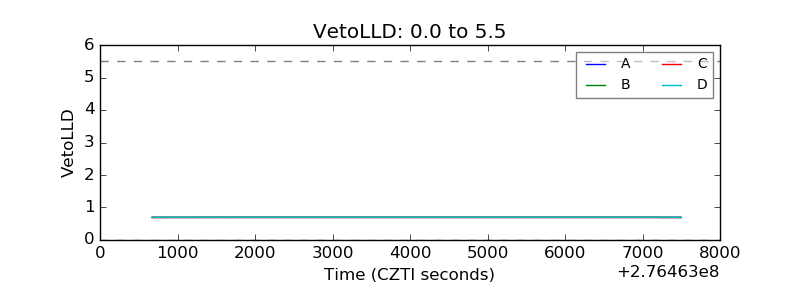 |
| Alpha Counter | 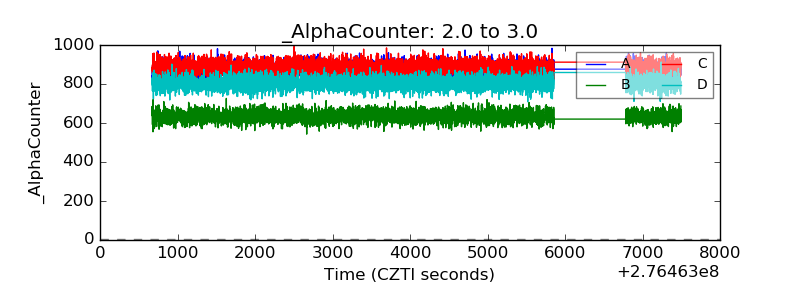 |
| _CPM_Rate | 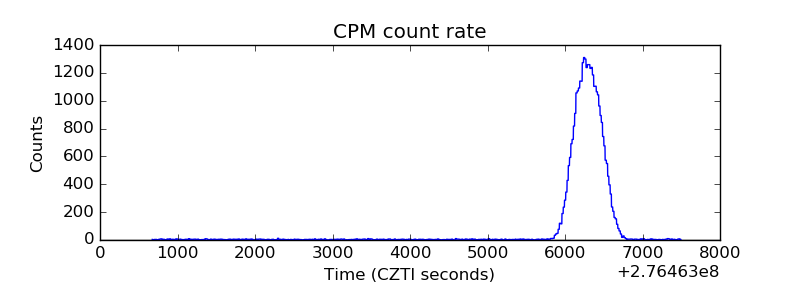 |
| CZT Counter | 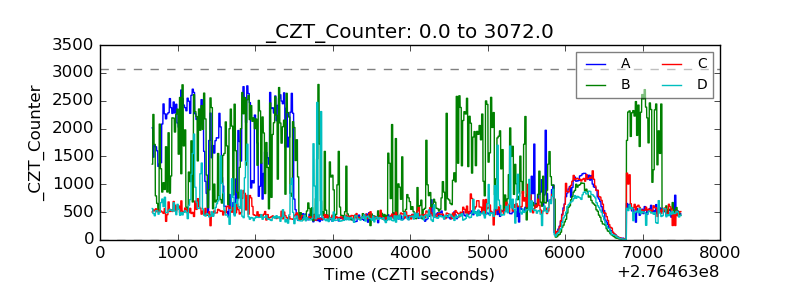 |
| +2.5 Volts monitor |  |
| +5 Volts monitor |  |
| _ROLL_ROT | 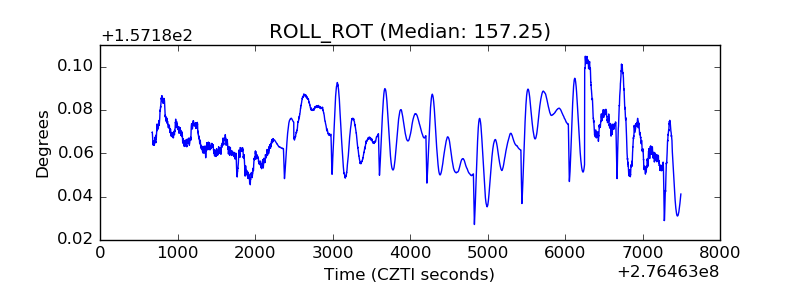 |
| _Roll_DEC | 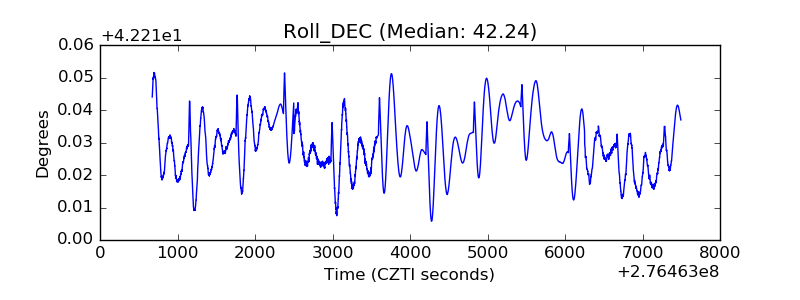 |
| _Roll_RA | 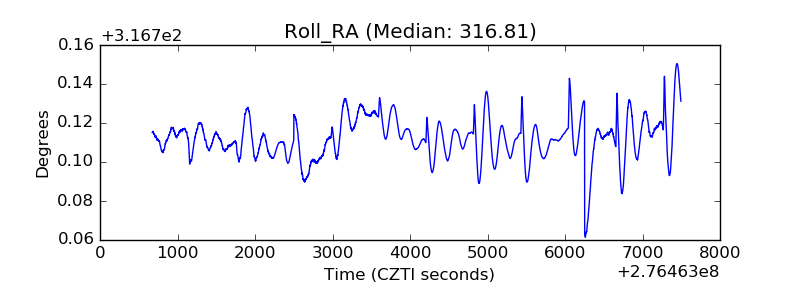 |
| Veto Counter | 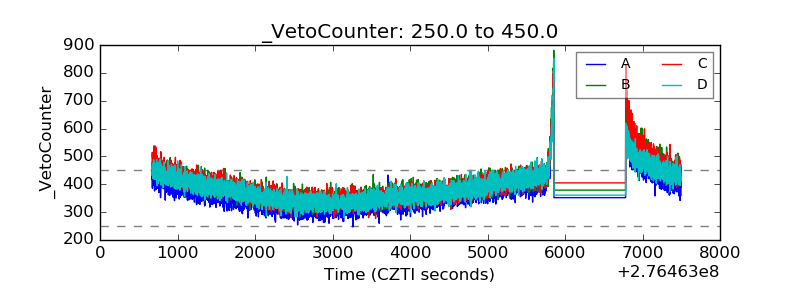 |