| Param | Original file | Final file |
|---|---|---|
| Filename | modeM0/AS1C04_007T01_9000002408cztM0_level2.fits | modeM0/AS1C04_007T01_9000002408cztM0_level2_quad_clean.evt |
| Size (bytes) | 191,592,000 | 186,036,480 |
| Size | 182.7 MB | 177.4 MB |
| Events in quadrant A | 1,223,590 | 1,199,865 |
| Events in quadrant B | 863,176 | 769,871 |
| Events in quadrant C | 1,205,674 | 1,151,809 |
| Events in quadrant D | 1,059,314 | 1,065,690 |
| Mode M9 | |||
|---|---|---|---|
| Quadrant | BADHDUFLAG | Total packets | Discarded packets |
| A | 0 | 12 | 0 |
| B | 0 | 12 | 0 |
| C | 0 | 12 | 0 |
| D | 0 | 12 | 0 |
| Mode SS | |||
|---|---|---|---|
| Quadrant | BADHDUFLAG | Total packets | Discarded packets |
| A | 0 | 430 | 0 |
| B | 0 | 430 | 0 |
| C | 0 | 430 | 0 |
| D | 0 | 430 | 0 |
| Mode M0 | |||
|---|---|---|---|
| Quadrant | BADHDUFLAG | Total packets | Discarded packets |
| A | 0 | 45890 | 0 |
| B | 0 | 96016 | 0 |
| C | 0 | 43684 | 0 |
| D | 0 | 45725 | 0 |
| Quadrant | Total seconds | Saturated seconds | Saturation percentage |
|---|---|---|---|
| A | 20997 | 612 | 2.914702% |
| B | 20997 | 8655 | 41.220174% |
| C | 20997 | 617 | 2.938515% |
| D | 20997 | 579 | 2.757537% |
Noise dominated data is calculated using 1-second bins in cleaned event files. If a bin has >2000 counts, and if more than 50% of those come from <1% of pixels, then it is considered to be noise-dominated and hence unusable.
| Quadrant | # 1 sec bins | Bins with >0 counts | Bins with >2000 counts | High rate bins dominated by noise | Noise dominated (total time) | Noise dominated (detector-on time) | Marked lightcurve |
|---|---|---|---|---|---|---|---|
| A | 22342 | 20996 | 0 | 0 | 0.00% | 0.00% |  |
| B | 22342 | 20312 | 0 | 0 | 0.00% | 0.00% |  |
| C | 22342 | 20996 | 0 | 0 | 0.00% | 0.00% |  |
| D | 22342 | 20993 | 0 | 0 | 0.00% | 0.00% |  |
Top three noisy pixels from each quadrant. If the there are fewer than three noisy pixels in the level2.evt file, extra rows are filled as -1
| Pixel properties | Quadrant properties | ||||||
|---|---|---|---|---|---|---|---|
| Quadrant | DetID | PixID | Counts | Sigma | Mean | Median | Sigma |
| A | 14 | 188 | 1263 | 11.73 | 317 | 296 | 82.4 |
| A | 0 | 29 | 1184 | 10.78 | 317 | 296 | 82.4 |
| A | 14 | 204 | 1073 | 9.43 | 317 | 296 | 82.4 |
| B | 2 | 9 | 707 | 10.0 | 228 | 216 | 49.1 |
| B | 5 | 225 | 611 | 8.04 | 228 | 216 | 49.1 |
| B | 2 | 8 | 603 | 7.88 | 228 | 216 | 49.1 |
| C | 12 | 241 | 865 | 6.81 | 318 | 295 | 83.7 |
| C | 2 | 191 | 824 | 6.32 | 318 | 295 | 83.7 |
| C | 12 | 250 | 822 | 6.29 | 318 | 295 | 83.7 |
| D | 3 | 14 | 831 | 6.85 | 301 | 274 | 81.3 |
| D | 4 | 246 | 820 | 6.71 | 301 | 274 | 81.3 |
| D | 3 | 31 | 812 | 6.62 | 301 | 274 | 81.3 |
Histogram calculated using DETX and DETY for each event in the final _common_clean file
| Quadrant A |  |
 |
Quadrant B |
|---|---|---|---|
| Quadrant D |  |
 |
Quadrant C |
| Plot type | Count rate plots | Images |
|---|---|---|
| Comparison with Poisson distribution Blue bars denote a histogram of data divided into 1 sec bins. Red curve is a Poisson curve with rate = median count rate of data. |
 |
 |
| Quadrant-wise count rates Data is divided into 100 sec bins |
 |
|
| Module-wise count rates for Quadrant A Data is divided into 100 sec bins |
 |
 |
| Module-wise count rates for Quadrant B Data is divided into 100 sec bins |
 |
 |
| Module-wise count rates for Quadrant C Data is divided into 100 sec bins |
 |
 |
| Module-wise count rates for Quadrant D Data is divided into 100 sec bins |
 |
 |
| Parameter | Plot |
|---|---|
| CZT HV Monitor |  |
| D_VDD | 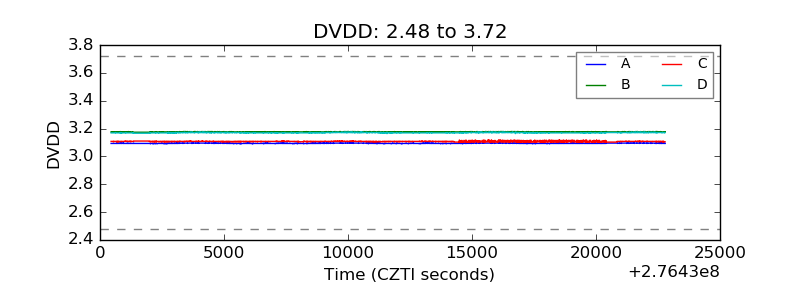 |
| Temperature 1 |  |
| Veto HV Monitor |  |
| Veto LLD |  |
| Alpha Counter |  |
| _CPM_Rate |  |
| CZT Counter |  |
| +2.5 Volts monitor |  |
| +5 Volts monitor |  |
| _ROLL_ROT |  |
| _Roll_DEC |  |
| _Roll_RA |  |
| Veto Counter |  |