| Param | Original file | Final file |
|---|---|---|
| Filename | modeM0/AS1C04_007T01_9000002408_16330cztM0_level2.evt | modeM0/AS1C04_007T01_9000002408_16330cztM0_level2_quad_clean.evt |
| Size (bytes) | 175,394,880 | 38,355,840 |
| Size | 167.3 MB | 36.6 MB |
| Events in quadrant A | 1,210,771 | 250,764 |
| Events in quadrant B | 1,470,147 | 252,218 |
| Events in quadrant C | 1,221,684 | 247,288 |
| Events in quadrant D | 1,247,343 | 241,730 |
| Mode M9 | |||
|---|---|---|---|
| Quadrant | BADHDUFLAG | Total packets | Discarded packets |
| A | 0 | 6 | 0 |
| B | 0 | 6 | 0 |
| C | 0 | 6 | 0 |
| D | 0 | 6 | 0 |
| Mode SS | |||
|---|---|---|---|
| Quadrant | BADHDUFLAG | Total packets | Discarded packets |
| A | 0 | 50 | 0 |
| B | 0 | 50 | 0 |
| C | 0 | 50 | 0 |
| D | 0 | 50 | 0 |
| Mode M0 | |||
|---|---|---|---|
| Quadrant | BADHDUFLAG | Total packets | Discarded packets |
| A | 0 | 5005 | 2 |
| B | 0 | 5787 | 1 |
| C | 0 | 4997 | 1 |
| D | 0 | 5196 | 1 |
| Quadrant | Total seconds | Saturated seconds | Saturation percentage |
|---|---|---|---|
| A | 2344 | 118 | 5.034130% |
| B | 2344 | 156 | 6.655290% |
| C | 2344 | 105 | 4.479522% |
| D | 2344 | 83 | 3.540956% |
Noise dominated data is calculated using 1-second bins in cleaned event files. If a bin has >2000 counts, and if more than 50% of those come from <1% of pixels, then it is considered to be noise-dominated and hence unusable.
| Quadrant | # 1 sec bins | Bins with >0 counts | Bins with >2000 counts | High rate bins dominated by noise | Noise dominated (total time) | Noise dominated (detector-on time) | Marked lightcurve |
|---|---|---|---|---|---|---|---|
| A | 2960 | 2345 | 0 | 0 | 0.00% | 0.00% |  |
| B | 2960 | 2345 | 13 | 13 | 0.44% | 0.55% | 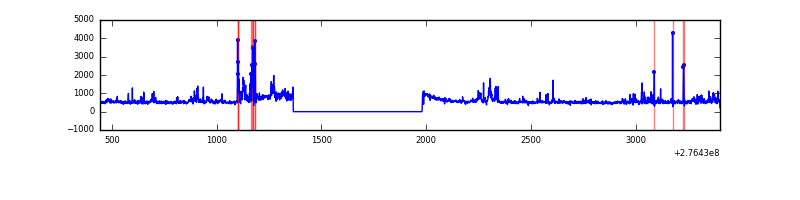 |
| C | 2960 | 2345 | 0 | 0 | 0.00% | 0.00% | 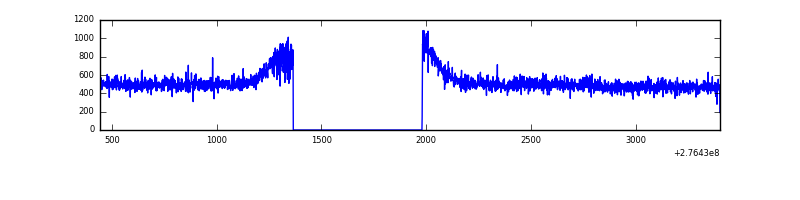 |
| D | 2960 | 2346 | 0 | 0 | 0.00% | 0.00% | 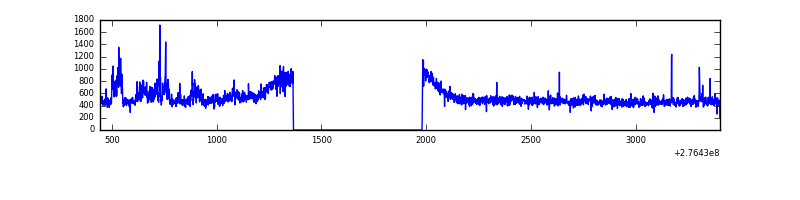 |
Top three noisy pixels from each quadrant. If the there are fewer than three noisy pixels in the level2.evt file, extra rows are filled as -1
| Pixel properties | Quadrant properties | ||||||
|---|---|---|---|---|---|---|---|
| Quadrant | DetID | PixID | Counts | Sigma | Mean | Median | Sigma |
| A | 15 | 174 | 5600 | 80.46 | 313 | 306 | 65.8 |
| A | 0 | 226 | 2765 | 37.37 | 313 | 306 | 65.8 |
| A | 12 | 194 | 2337 | 30.87 | 313 | 306 | 65.8 |
| B | 3 | 112 | 208360 | 3348.22 | 308 | 301 | 62.1 |
| B | 4 | 173 | 27102 | 431.3 | 308 | 301 | 62.1 |
| B | 0 | 198 | 9203 | 143.26 | 308 | 301 | 62.1 |
| C | 14 | 238 | 45438 | 625.63 | 300 | 302 | 72.1 |
| C | 3 | 233 | 6569 | 86.87 | 300 | 302 | 72.1 |
| C | 13 | 61 | 2173 | 25.93 | 300 | 302 | 72.1 |
| D | 12 | 144 | 70844 | 912.05 | 306 | 296 | 77.4 |
| D | 2 | 234 | 9803 | 122.91 | 306 | 296 | 77.4 |
| D | 1 | 52 | 5835 | 71.61 | 306 | 296 | 77.4 |
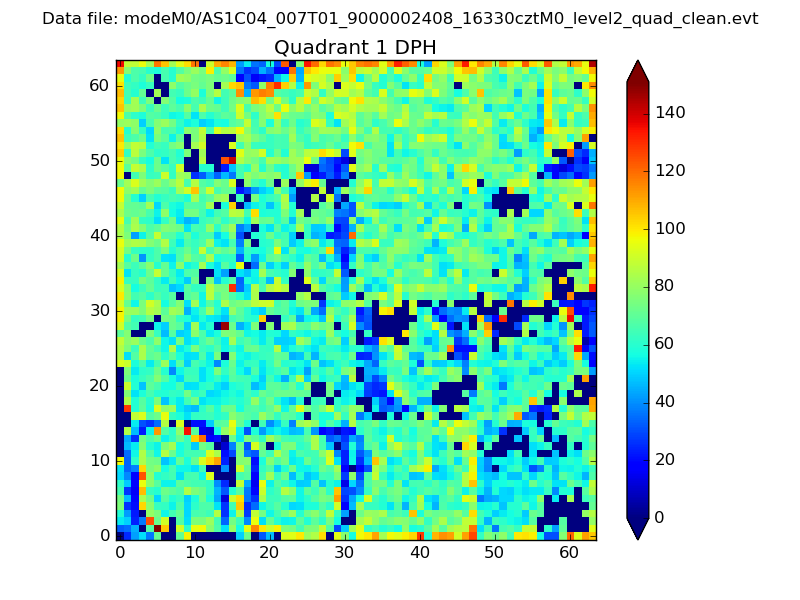
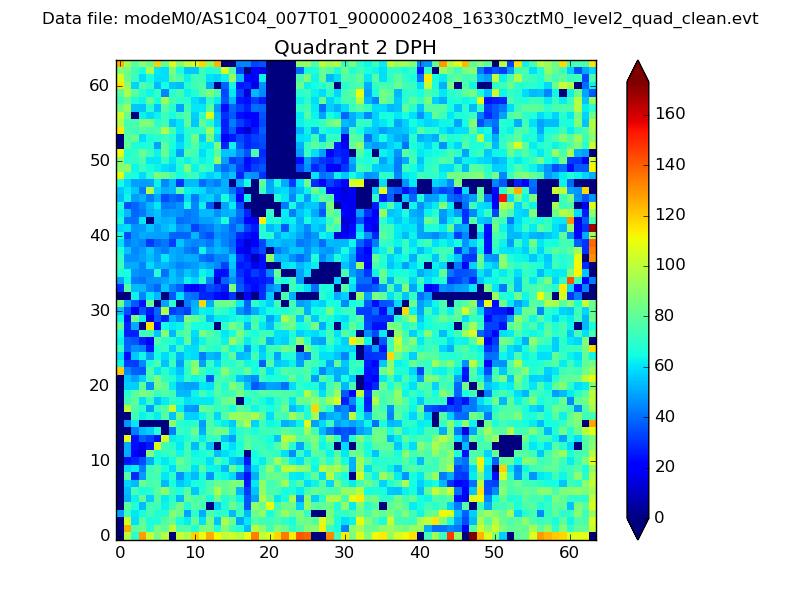
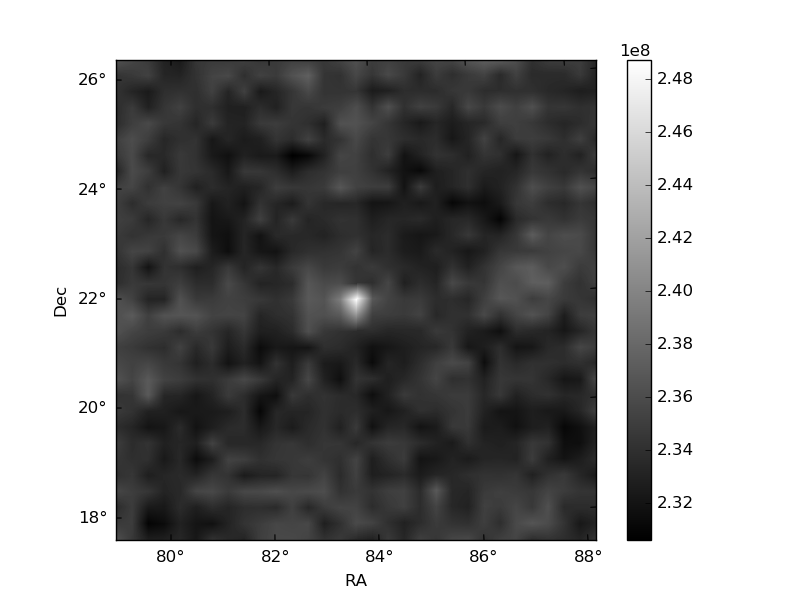
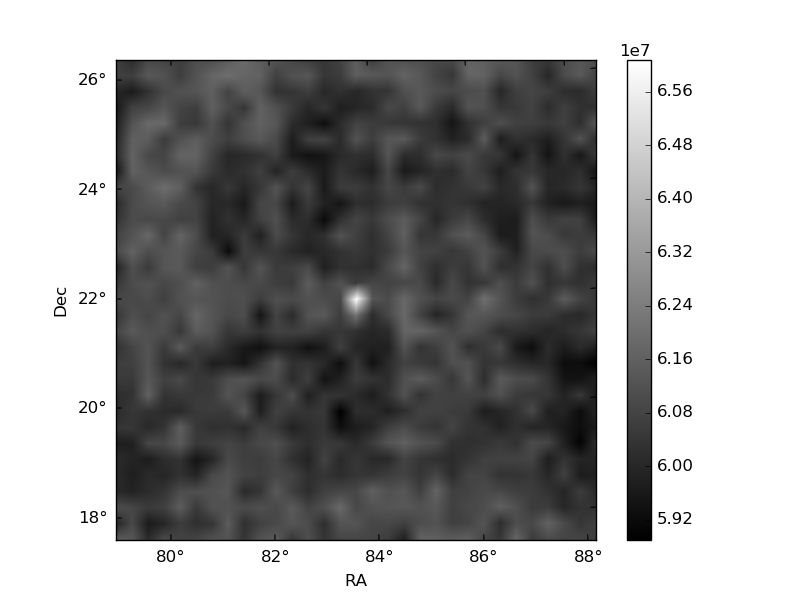
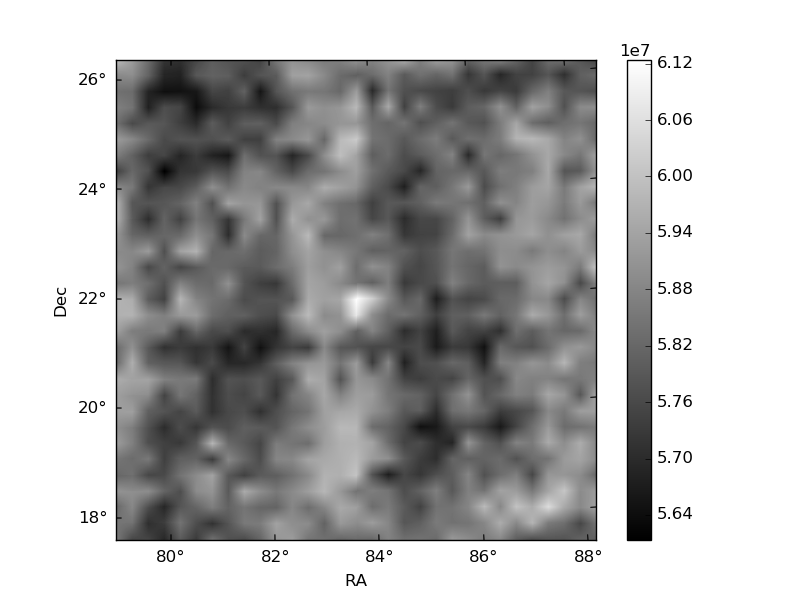
Histogram calculated using DETX and DETY for each event in the final _common_clean file
| Quadrant A | 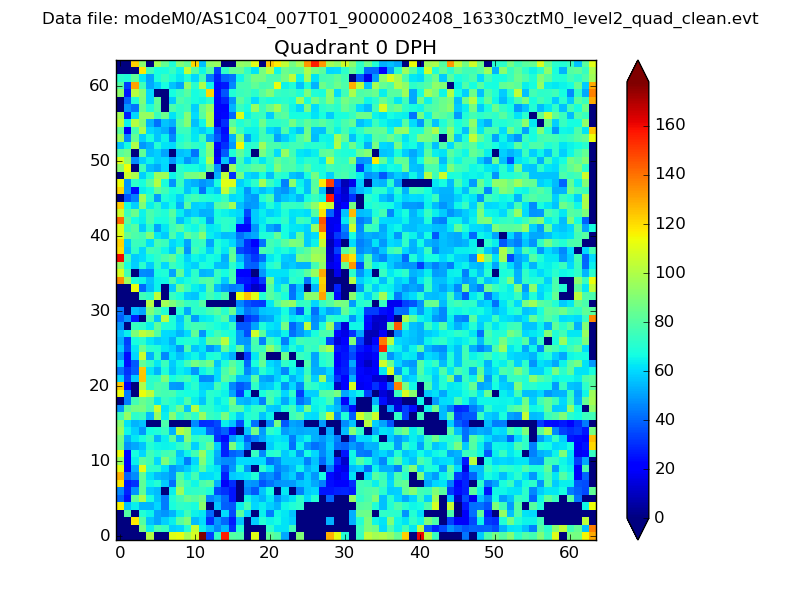 |
 |
Quadrant B |
|---|---|---|---|
| Quadrant D | 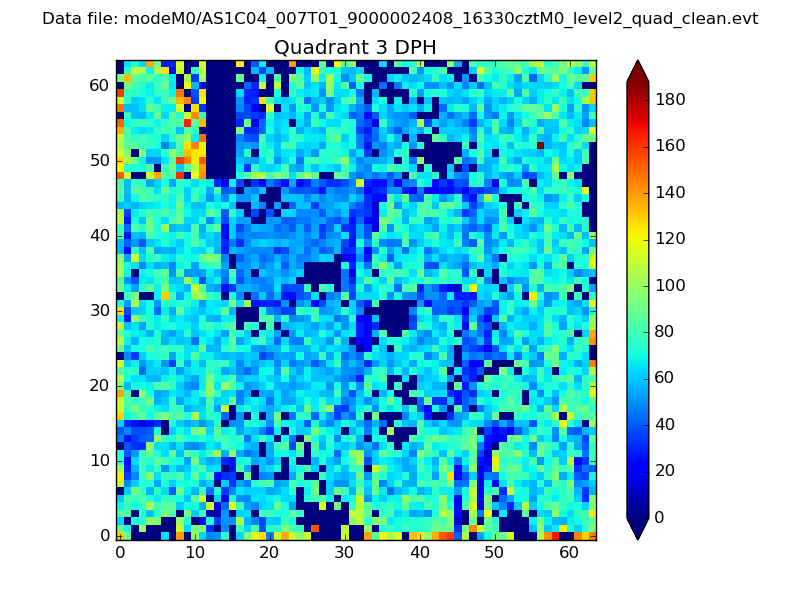 |
 |
Quadrant C |
| Plot type | Count rate plots | Images |
|---|---|---|
| Comparison with Poisson distribution Blue bars denote a histogram of data divided into 1 sec bins. Red curve is a Poisson curve with rate = median count rate of data. |
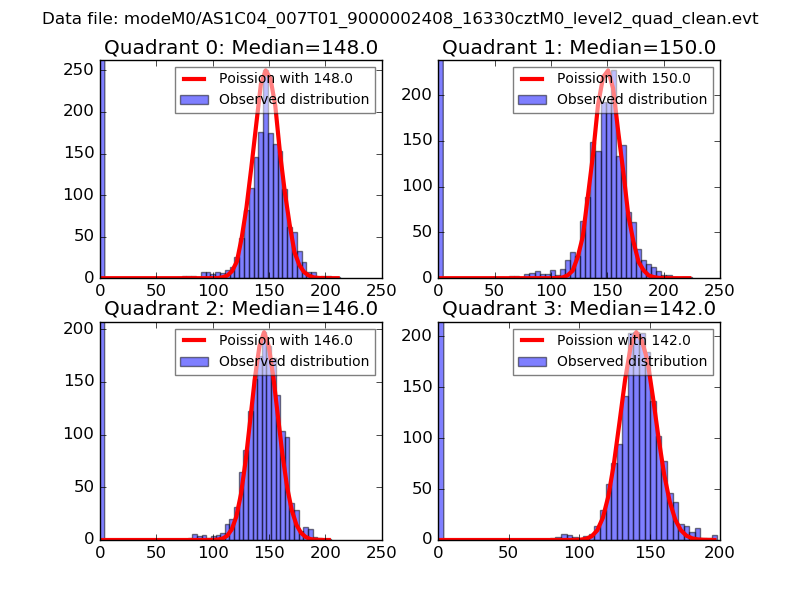 |
 |
| Quadrant-wise count rates Data is divided into 100 sec bins |
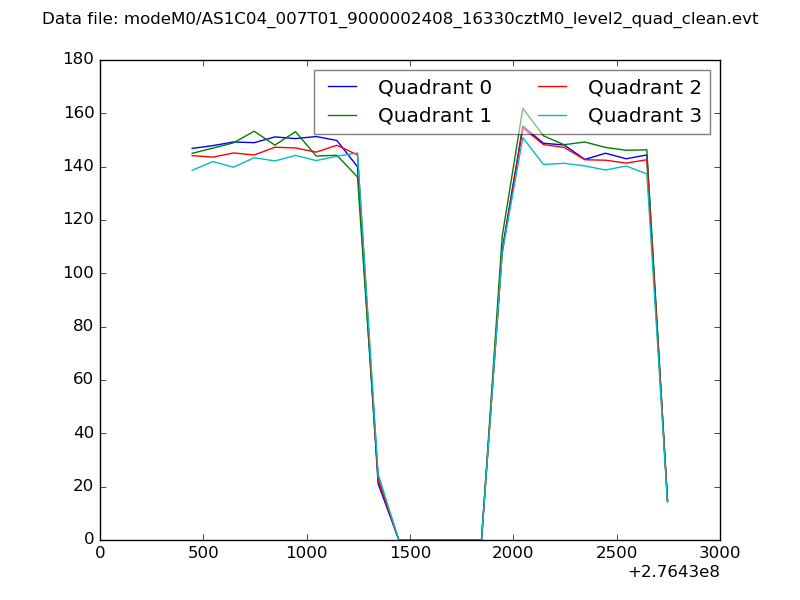 |
|
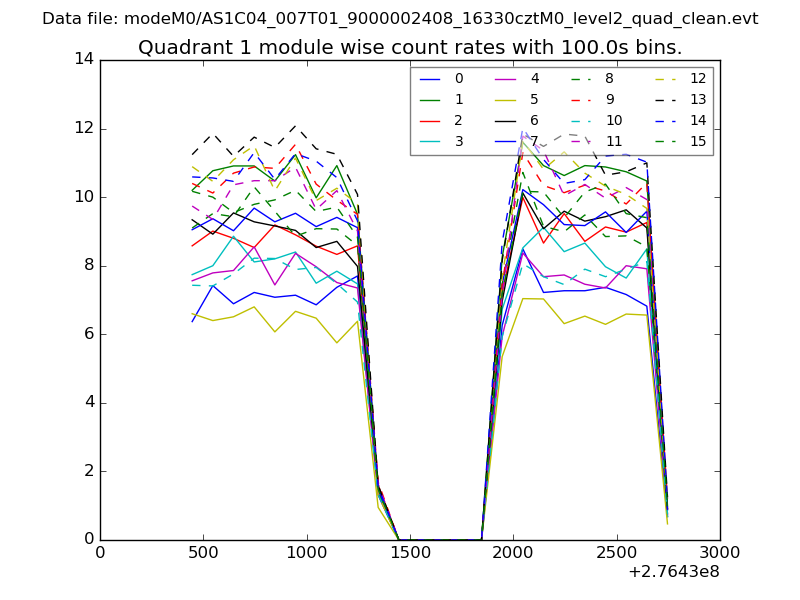
| Module-wise count rates for Quadrant A Data is divided into 100 sec bins |
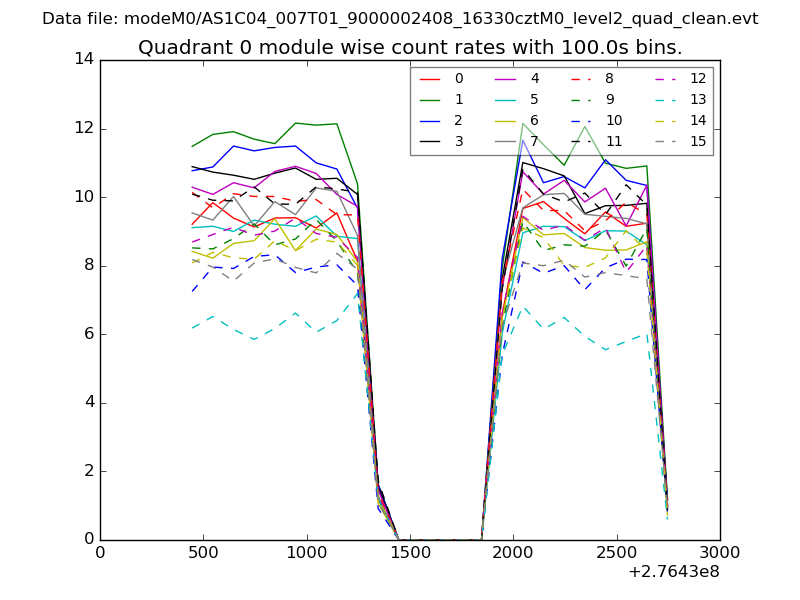 |
 |
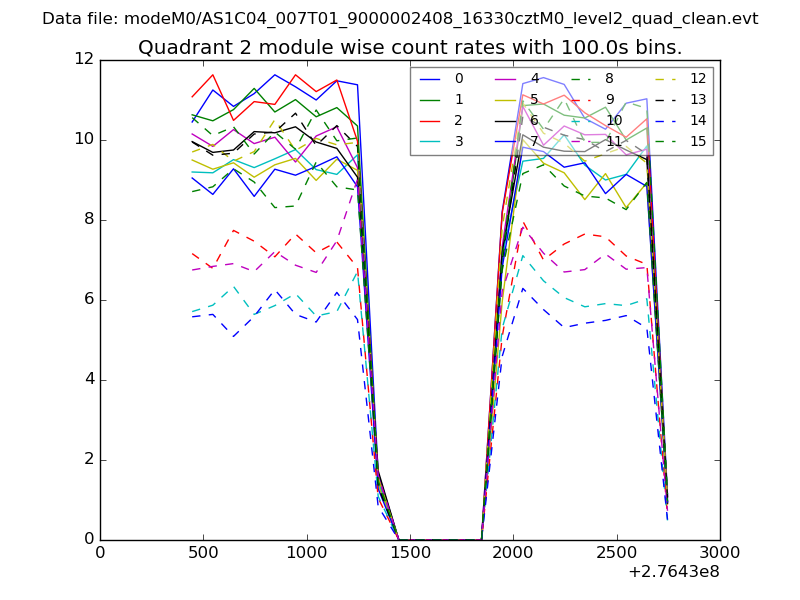
| Module-wise count rates for Quadrant B Data is divided into 100 sec bins |
 |
 |
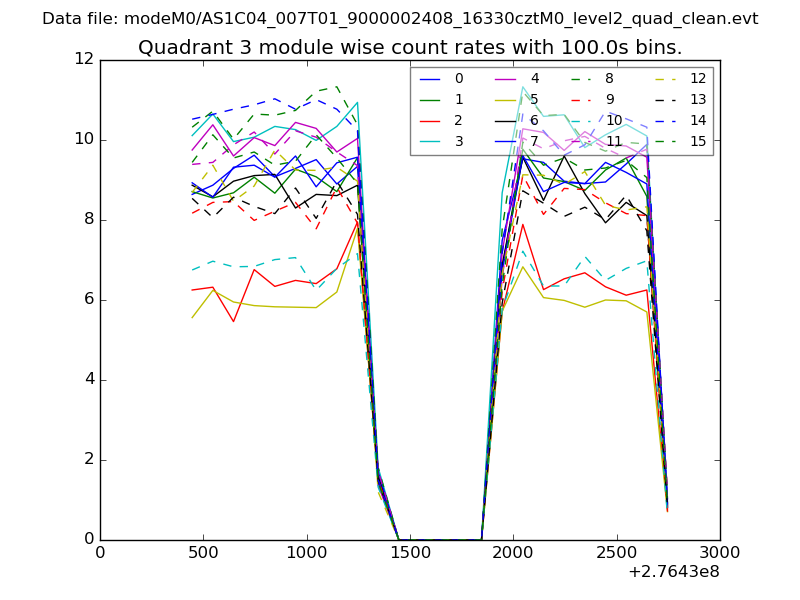
| Module-wise count rates for Quadrant C Data is divided into 100 sec bins |
 |
 |
| Module-wise count rates for Quadrant D Data is divided into 100 sec bins |
 |
 |
| Parameter | Plot |
|---|---|
| CZT HV Monitor | 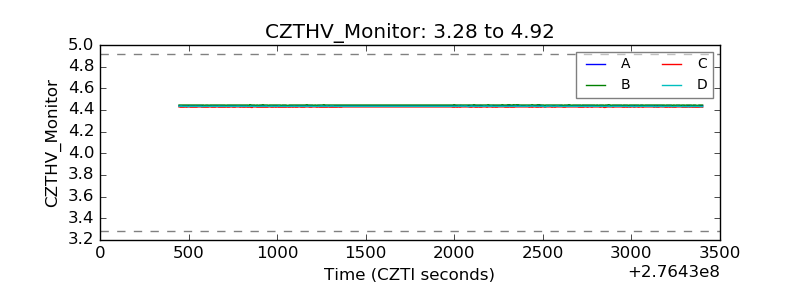 |
| D_VDD |  |
| Temperature 1 | 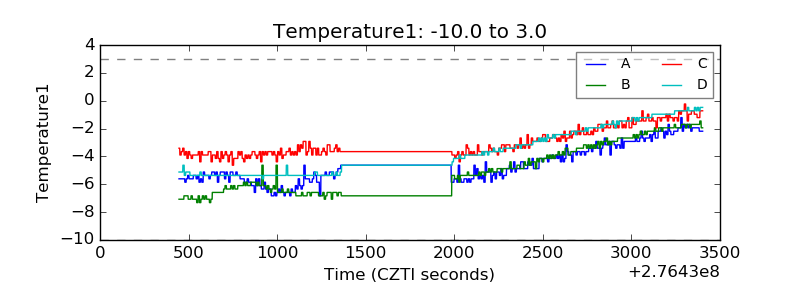 |
| Veto HV Monitor | 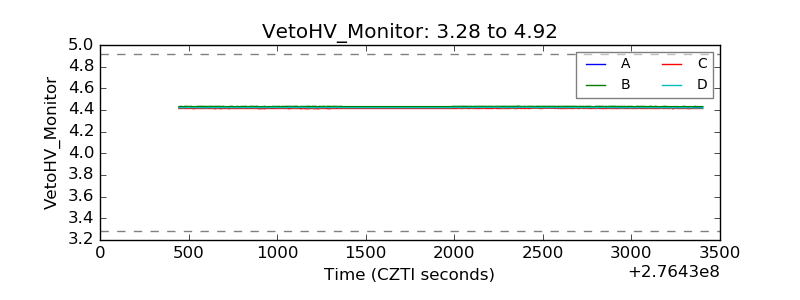 |
| Veto LLD | 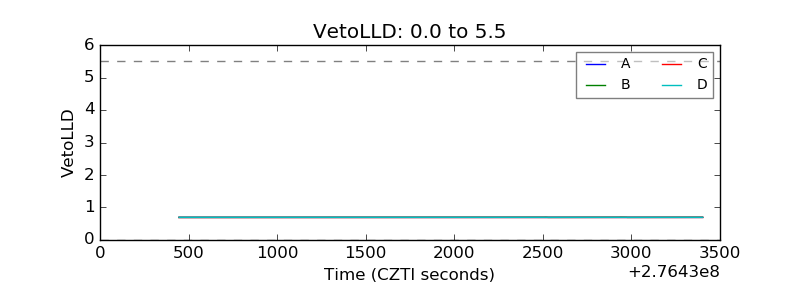 |
| Alpha Counter | 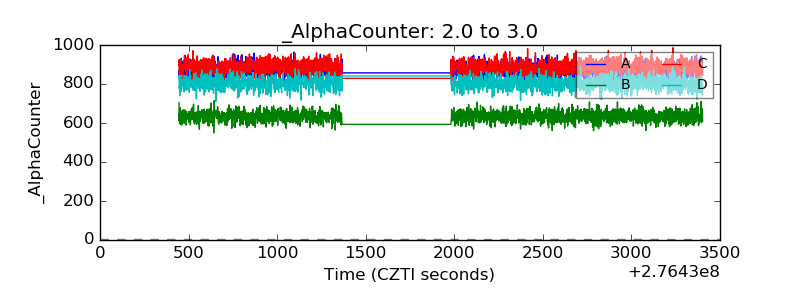 |
| _CPM_Rate | 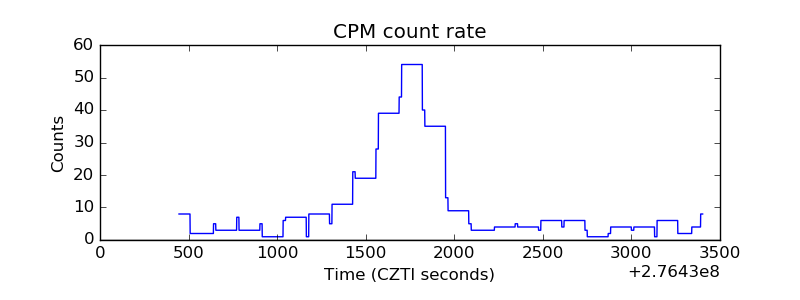 |
| CZT Counter | 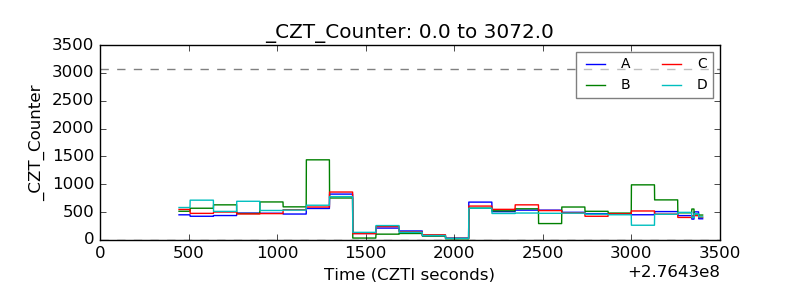 |
| +2.5 Volts monitor | 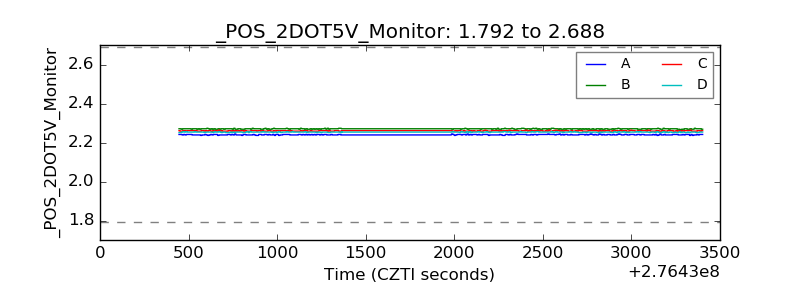 |
| +5 Volts monitor |  |
| _ROLL_ROT | 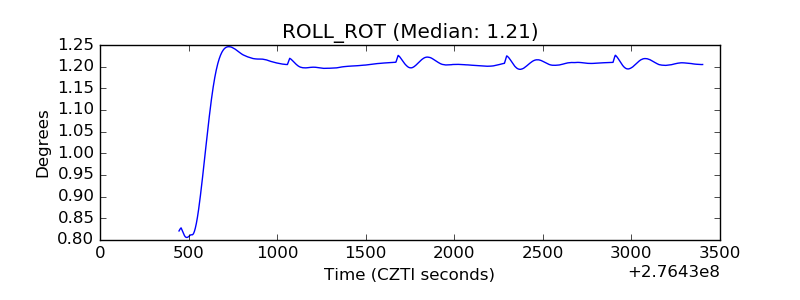 |
| _Roll_DEC | 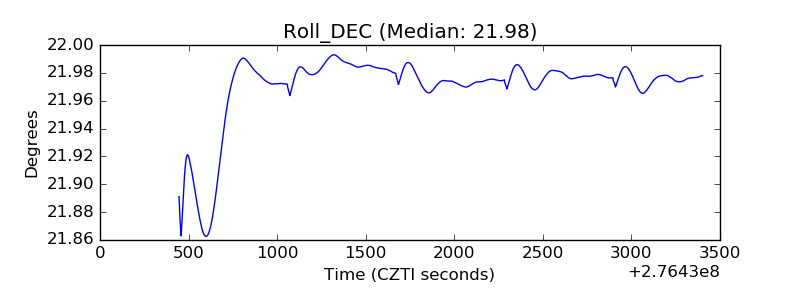 |
| _Roll_RA | 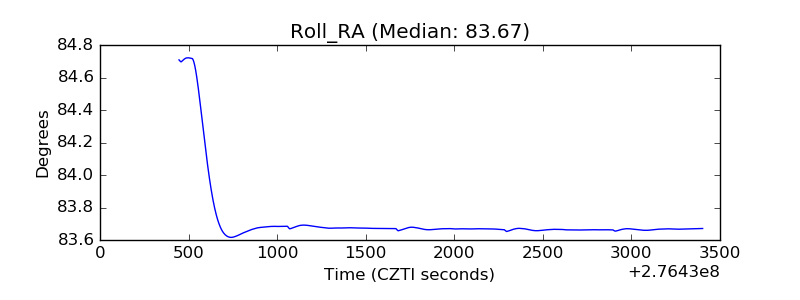 |
| Veto Counter | 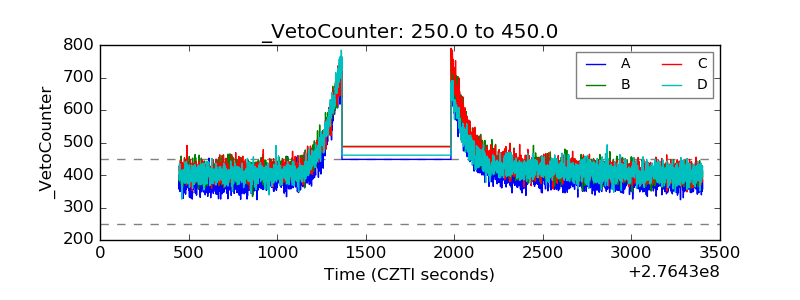 |