| Param | Original file | Final file |
|---|---|---|
| Filename | modeM0/AS1C04_007T01_9000002408_16335cztM0_level2.evt | modeM0/AS1C04_007T01_9000002408_16335cztM0_level2_quad_clean.evt |
| Size (bytes) | 200,442,240 | 8,426,880 |
| Size | 191.2 MB | 8.0 MB |
| Events in quadrant A | 1,009,294 | 36,456 |
| Events in quadrant B | 3,143,976 | 24,301 |
| Events in quadrant C | 849,666 | 35,191 |
| Events in quadrant D | 951,053 | 34,949 |
| Mode SS | |||
|---|---|---|---|
| Quadrant | BADHDUFLAG | Total packets | Discarded packets |
| A | 0 | 32 | 0 |
| B | 0 | 32 | 0 |
| C | 0 | 32 | 0 |
| D | 0 | 32 | 0 |
| Mode M0 | |||
|---|---|---|---|
| Quadrant | BADHDUFLAG | Total packets | Discarded packets |
| A | 0 | 3993 | 0 |
| B | 0 | 10514 | 0 |
| C | 0 | 3465 | 0 |
| D | 0 | 3843 | 0 |
| Quadrant | Total seconds | Saturated seconds | Saturation percentage |
|---|---|---|---|
| A | 1684 | 24 | 1.425178% |
| B | 1684 | 1187 | 70.486936% |
| C | 1684 | 17 | 1.009501% |
| D | 1684 | 40 | 2.375297% |
Noise dominated data is calculated using 1-second bins in cleaned event files. If a bin has >2000 counts, and if more than 50% of those come from <1% of pixels, then it is considered to be noise-dominated and hence unusable.
| Quadrant | # 1 sec bins | Bins with >0 counts | Bins with >2000 counts | High rate bins dominated by noise | Noise dominated (total time) | Noise dominated (detector-on time) | Marked lightcurve |
|---|---|---|---|---|---|---|---|
| A | 1685 | 1685 | 3 | 3 | 0.18% | 0.18% |  |
| B | 1685 | 1685 | 791 | 791 | 46.94% | 46.94% |  |
| C | 1685 | 1685 | 5 | 5 | 0.30% | 0.30% |  |
| D | 1685 | 1685 | 23 | 23 | 1.36% | 1.36% |  |
Top three noisy pixels from each quadrant. If the there are fewer than three noisy pixels in the level2.evt file, extra rows are filled as -1
| Pixel properties | Quadrant properties | ||||||
|---|---|---|---|---|---|---|---|
| Quadrant | DetID | PixID | Counts | Sigma | Mean | Median | Sigma |
| A | 15 | 174 | 164865 | 3661.36 | 211 | 206 | 45.0 |
| A | 15 | 239 | 32520 | 718.53 | 211 | 206 | 45.0 |
| A | 0 | 226 | 1859 | 36.76 | 211 | 206 | 45.0 |
| B | 3 | 112 | 2311303 | 86722.02 | 130 | 127 | 26.7 |
| B | 4 | 173 | 269775 | 10117.97 | 130 | 127 | 26.7 |
| B | 0 | 189 | 19481 | 726.22 | 130 | 127 | 26.7 |
| C | 14 | 238 | 30911 | 625.28 | 201 | 202 | 49.1 |
| C | 0 | 207 | 26741 | 540.37 | 201 | 202 | 49.1 |
| C | 3 | 233 | 5210 | 101.97 | 201 | 202 | 49.1 |
| D | 10 | 70 | 140251 | 2616.96 | 206 | 199 | 53.5 |
| D | 2 | 69 | 10535 | 193.13 | 206 | 199 | 53.5 |
| D | 2 | 234 | 7140 | 129.7 | 206 | 199 | 53.5 |
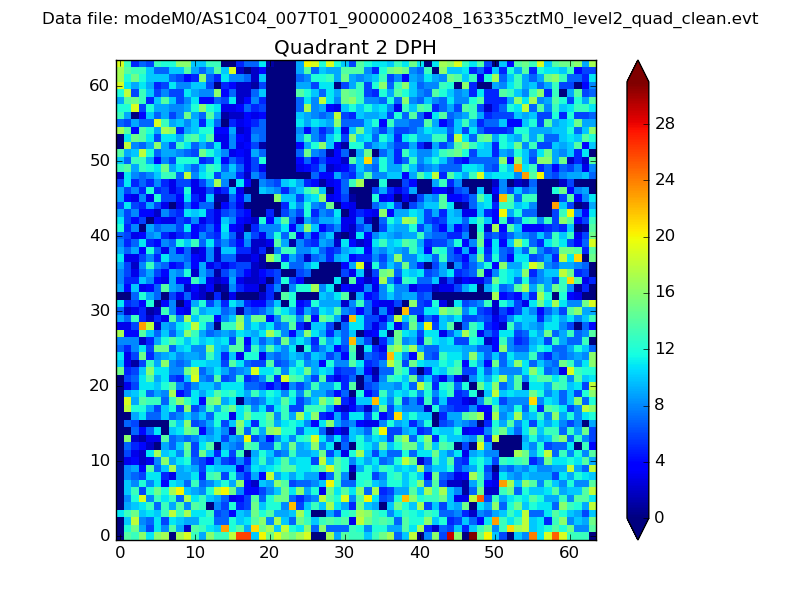
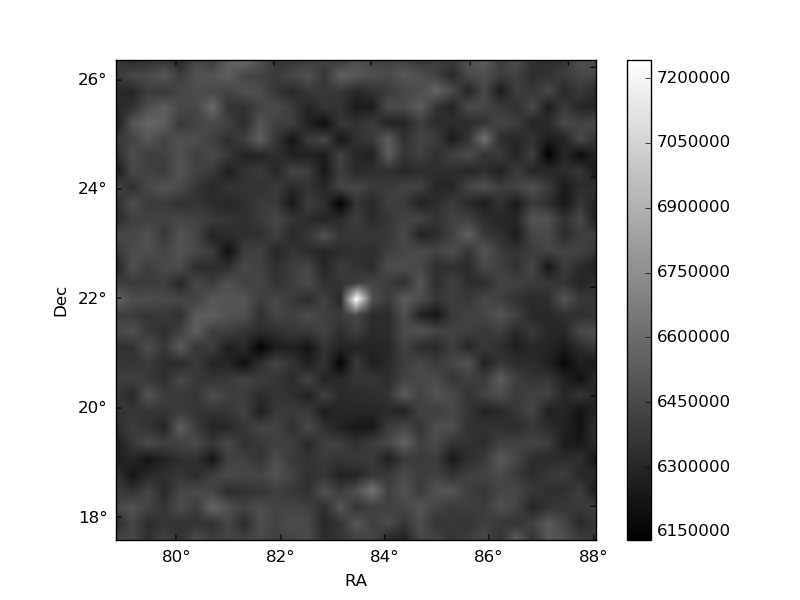
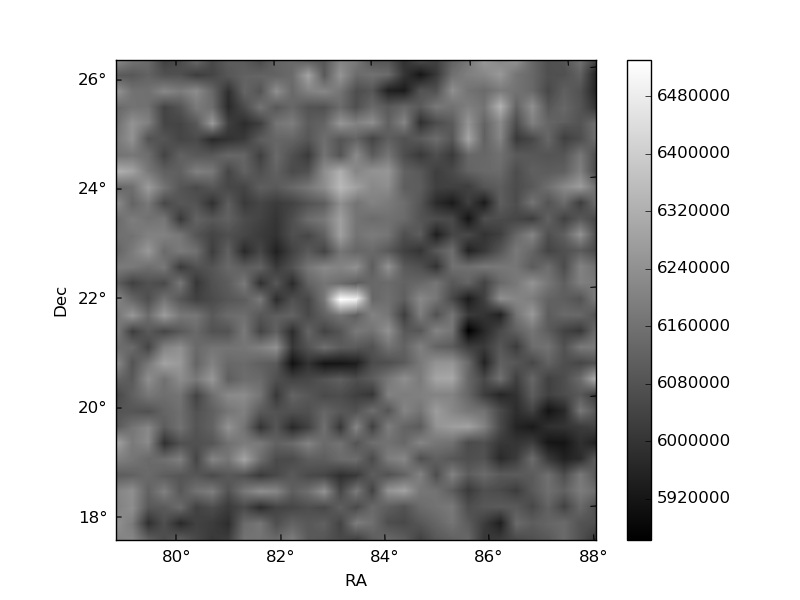
Histogram calculated using DETX and DETY for each event in the final _common_clean file
| Quadrant A | 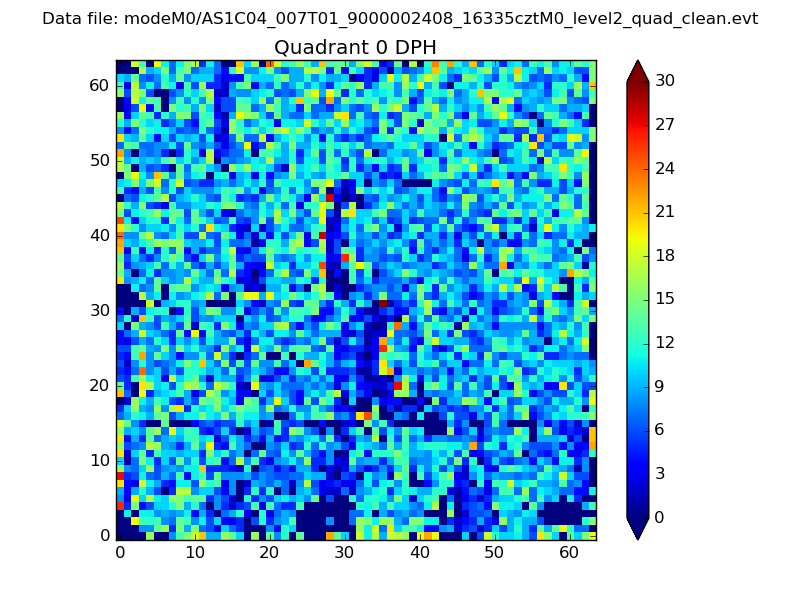 |
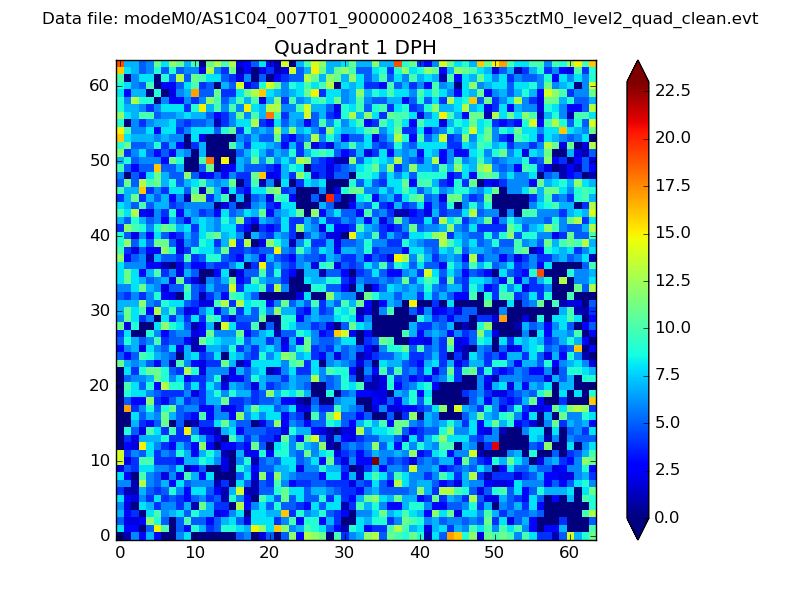 |
Quadrant B |
|---|---|---|---|
| Quadrant D | 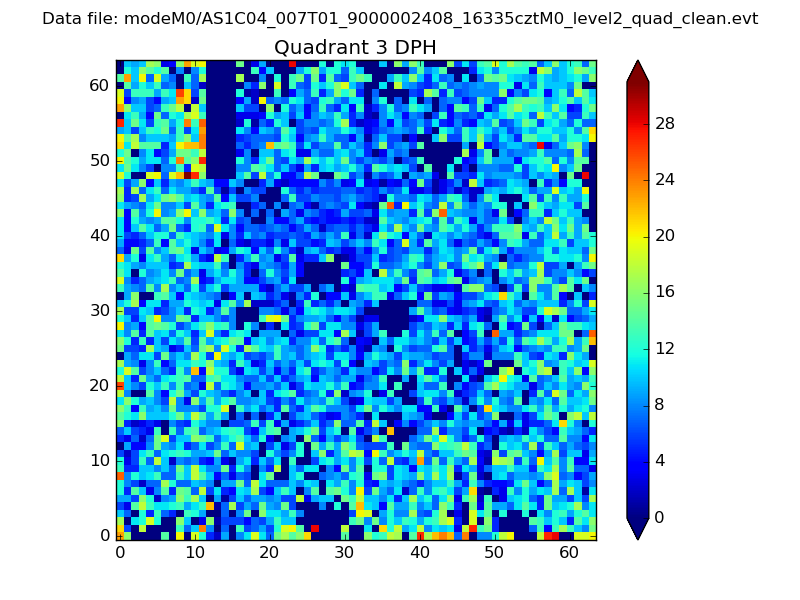 |
 |
Quadrant C |
| Plot type | Count rate plots | Images |
|---|---|---|
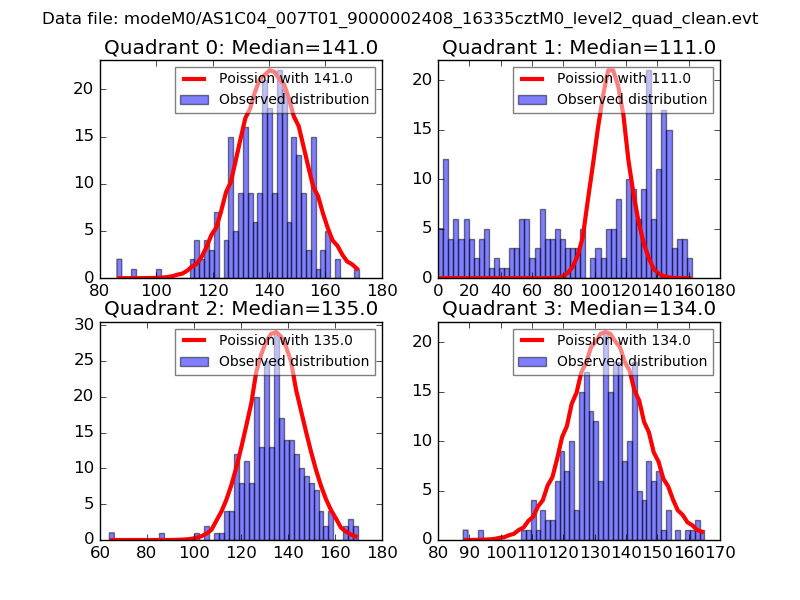
| Comparison with Poisson distribution Blue bars denote a histogram of data divided into 1 sec bins. Red curve is a Poisson curve with rate = median count rate of data. |
 |
 |
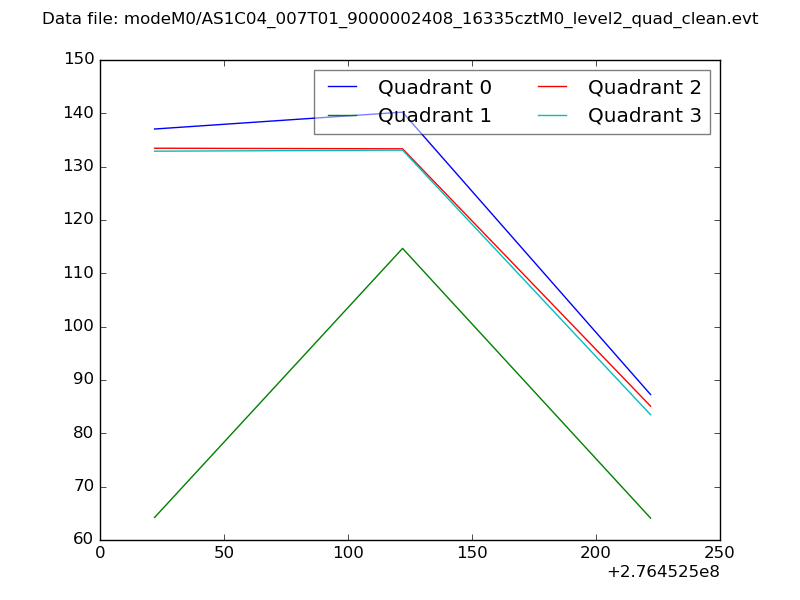
| Quadrant-wise count rates Data is divided into 100 sec bins |
 |
|
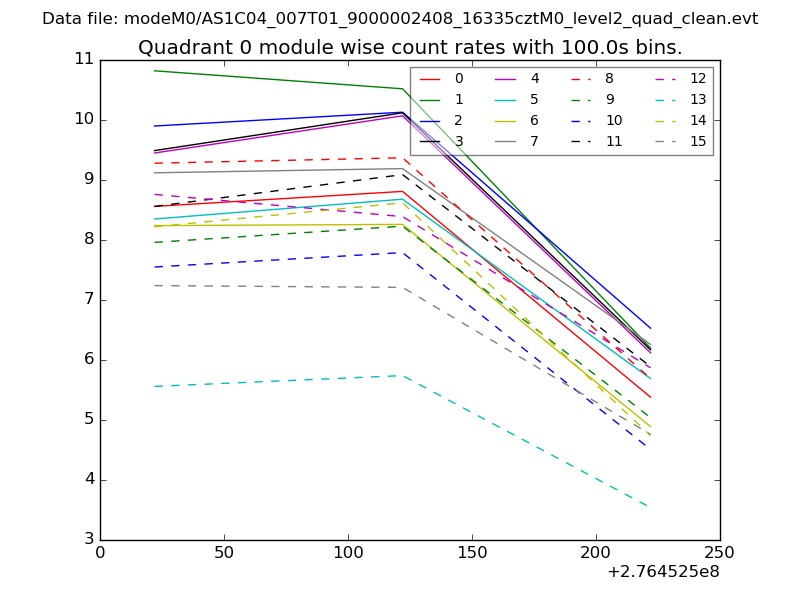
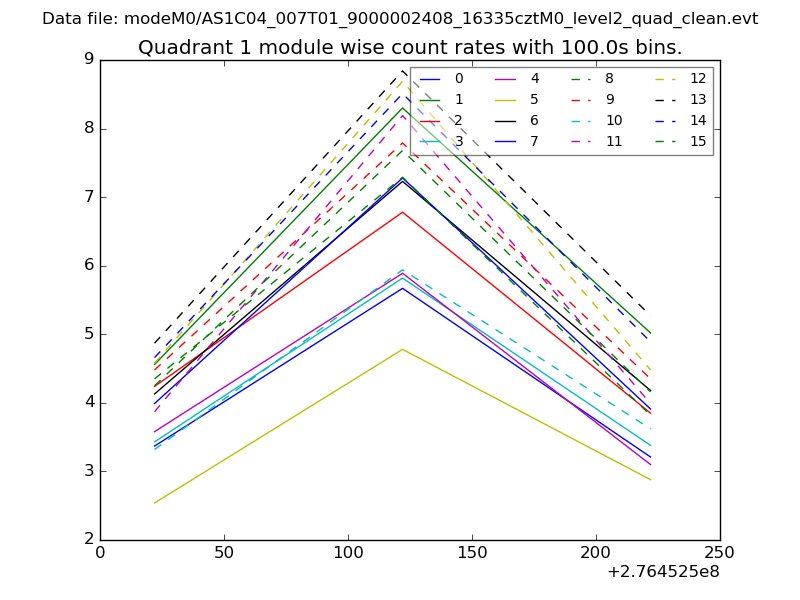
| Module-wise count rates for Quadrant A Data is divided into 100 sec bins |
 |
 |
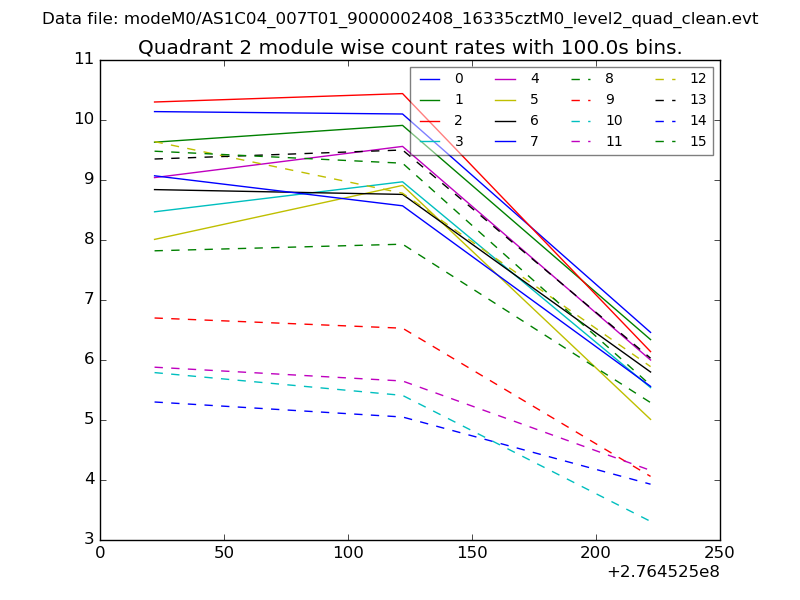
| Module-wise count rates for Quadrant B Data is divided into 100 sec bins |
 |
 |
| Module-wise count rates for Quadrant C Data is divided into 100 sec bins |
 |
 |
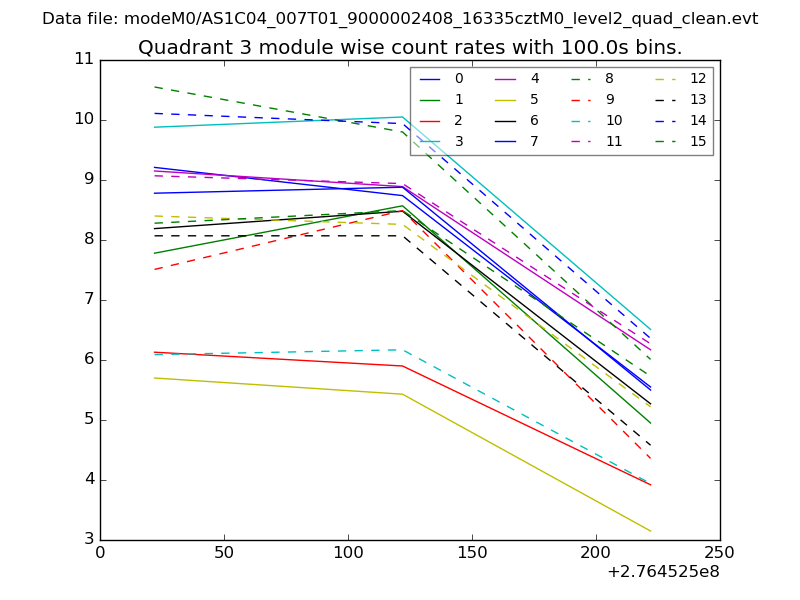
| Module-wise count rates for Quadrant D Data is divided into 100 sec bins |
 |
 |
| Parameter | Plot |
|---|---|
| CZT HV Monitor | 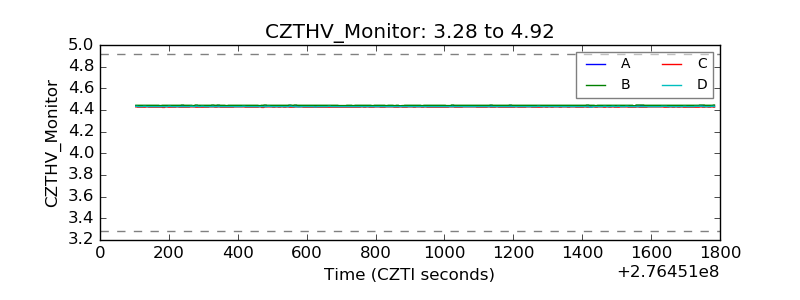 |
| D_VDD | 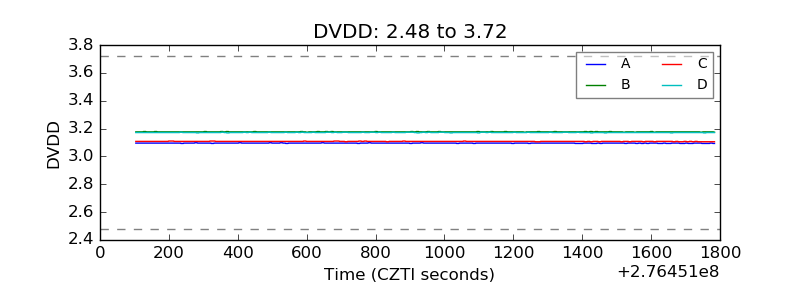 |
| Temperature 1 | 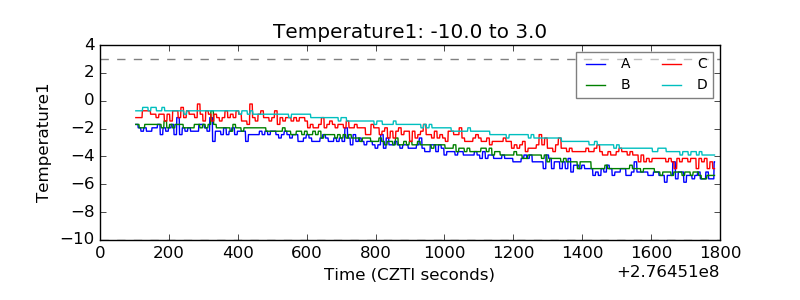 |
| Veto HV Monitor |  |
| Veto LLD | 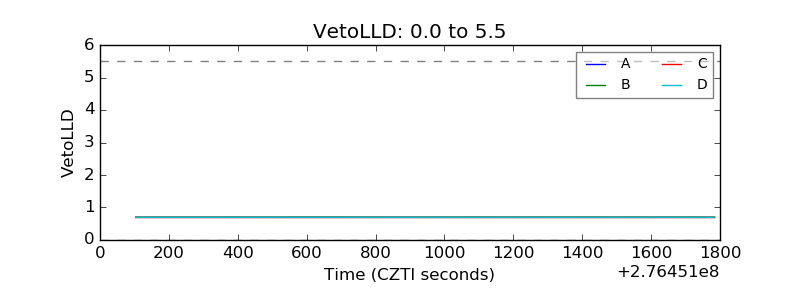 |
| Alpha Counter | 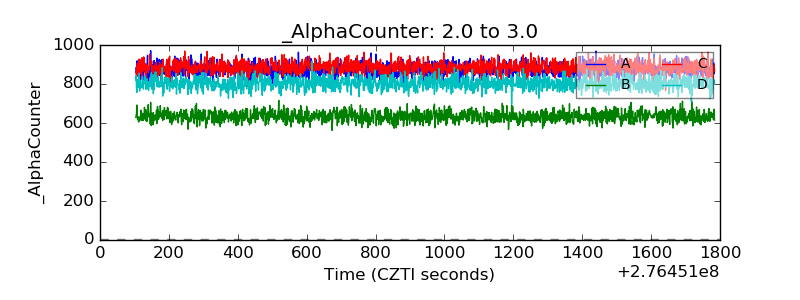 |
| _CPM_Rate | 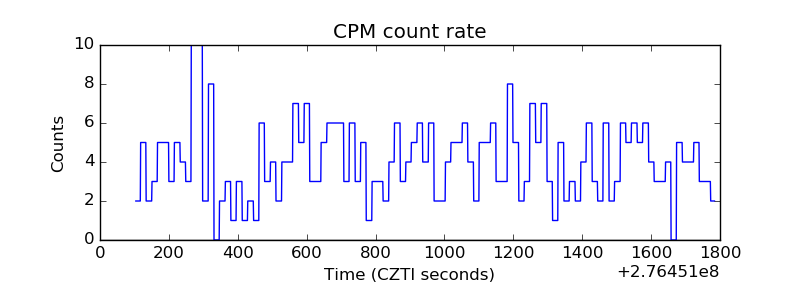 |
| CZT Counter | 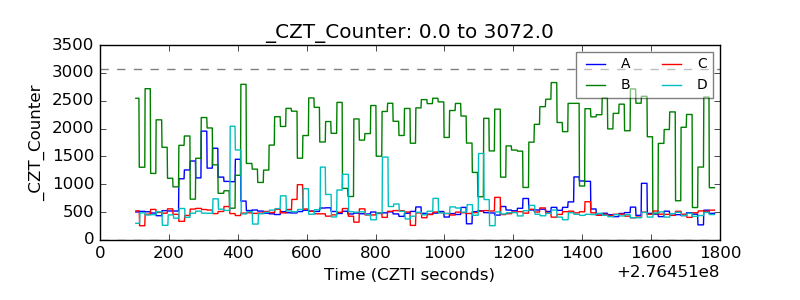 |
| +2.5 Volts monitor |  |
| +5 Volts monitor |  |
| _ROLL_ROT | 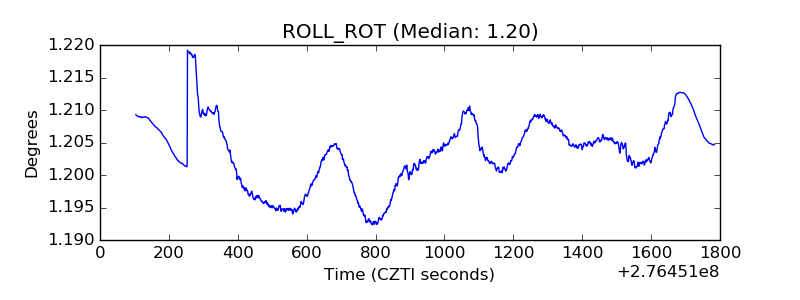 |
| _Roll_DEC | 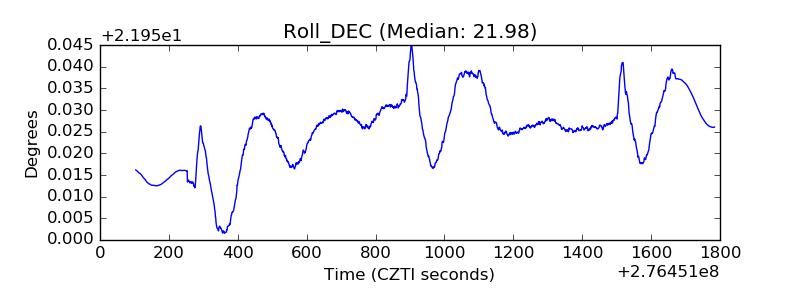 |
| _Roll_RA | 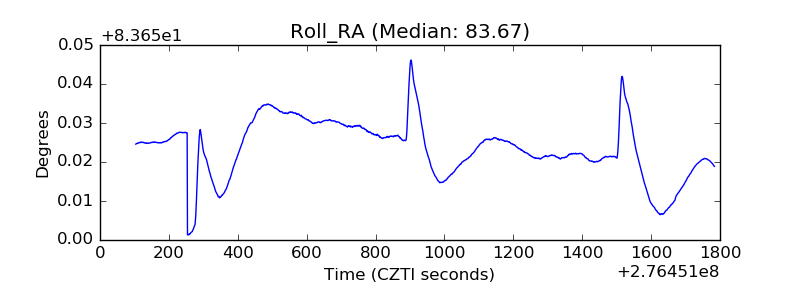 |
| Veto Counter | 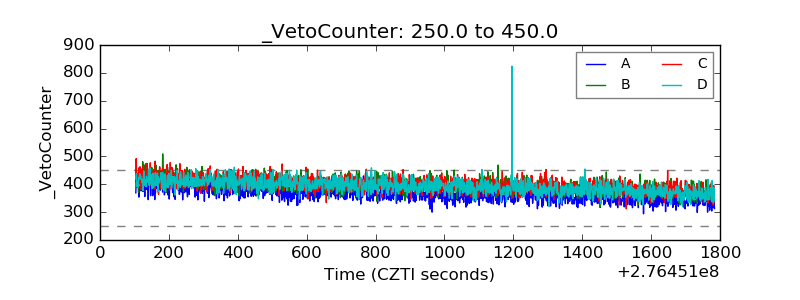 |