| Param | Original file | Final file |
|---|---|---|
| Filename | modeM0/AS1A05_069T02_9000002414cztM0_level2.fits | modeM0/AS1A05_069T02_9000002414cztM0_level2_quad_clean.evt |
| Size (bytes) | 627,609,600 | 576,564,480 |
| Size | 598.5 MB | 549.9 MB |
| Events in quadrant A | 3,848,434 | 3,401,356 |
| Events in quadrant B | 3,695,342 | 3,433,025 |
| Events in quadrant C | 3,774,374 | 3,256,190 |
| Events in quadrant D | 3,259,940 | 2,941,788 |
| Mode M0 | |||
|---|---|---|---|
| Quadrant | BADHDUFLAG | Total packets | Discarded packets |
| A | 0 | 139585 | 0 |
| B | 0 | 143632 | 0 |
| C | 0 | 136257 | 0 |
| D | 0 | 150401 | 0 |
| Mode M9 | |||
|---|---|---|---|
| Quadrant | BADHDUFLAG | Total packets | Discarded packets |
| A | 0 | 104 | 0 |
| B | 0 | 104 | 0 |
| C | 0 | 104 | 0 |
| D | 0 | 104 | 0 |
| Mode SS | |||
|---|---|---|---|
| Quadrant | BADHDUFLAG | Total packets | Discarded packets |
| A | 0 | 1316 | 0 |
| B | 0 | 1316 | 0 |
| C | 0 | 1316 | 0 |
| D | 0 | 1316 | 0 |
| Quadrant | Total seconds | Saturated seconds | Saturation percentage |
|---|---|---|---|
| A | 64559 | 1491 | 2.309515% |
| B | 64559 | 1375 | 2.129835% |
| C | 64559 | 1140 | 1.765827% |
| D | 64559 | 1621 | 2.510882% |
Noise dominated data is calculated using 1-second bins in cleaned event files. If a bin has >2000 counts, and if more than 50% of those come from <1% of pixels, then it is considered to be noise-dominated and hence unusable.
| Quadrant | # 1 sec bins | Bins with >0 counts | Bins with >2000 counts | High rate bins dominated by noise | Noise dominated (total time) | Noise dominated (detector-on time) | Marked lightcurve |
|---|---|---|---|---|---|---|---|
| A | 75065 | 64524 | 0 | 0 | 0.00% | 0.00% | 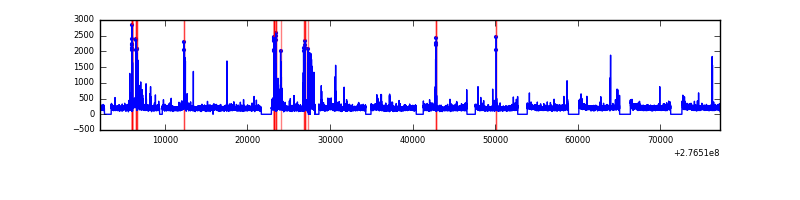 |
| B | 75065 | 64550 | 0 | 0 | 0.00% | 0.00% |  |
| C | 75065 | 64559 | 0 | 0 | 0.00% | 0.00% | 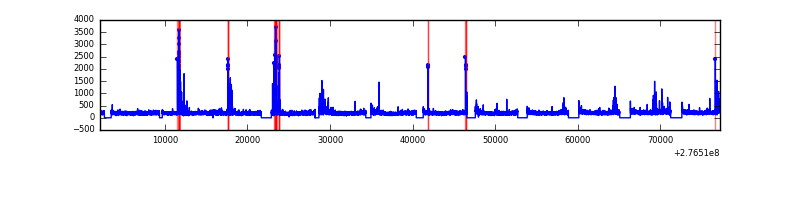 |
| D | 75065 | 64547 | 0 | 0 | 0.00% | 0.00% | 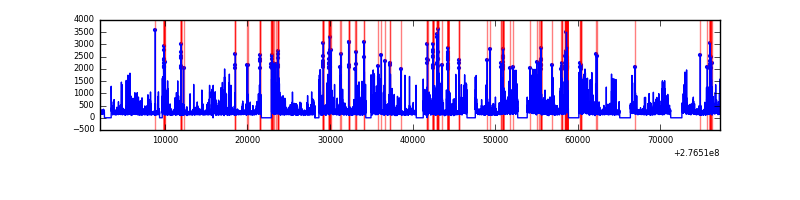 |
Top three noisy pixels from each quadrant. If the there are fewer than three noisy pixels in the level2.evt file, extra rows are filled as -1
| Pixel properties | Quadrant properties | ||||||
|---|---|---|---|---|---|---|---|
| Quadrant | DetID | PixID | Counts | Sigma | Mean | Median | Sigma |
| A | 0 | 29 | 3604 | 10.93 | 1000 | 936 | 244.1 |
| A | 7 | 110 | 3127 | 8.97 | 1000 | 936 | 244.1 |
| A | 0 | 30 | 2862 | 7.89 | 1000 | 936 | 244.1 |
| B | 2 | 9 | 2979 | 10.69 | 979 | 934 | 191.3 |
| B | 2 | 8 | 2528 | 8.33 | 979 | 934 | 191.3 |
| B | 5 | 128 | 2459 | 7.97 | 979 | 934 | 191.3 |
| C | 1 | 81 | 2756 | 7.14 | 995 | 930 | 255.7 |
| C | 1 | 80 | 2712 | 6.97 | 995 | 930 | 255.7 |
| C | 12 | 241 | 2676 | 6.83 | 995 | 930 | 255.7 |
| D | 6 | 231 | 2385 | 6.13 | 932 | 848 | 250.7 |
| D | 10 | 189 | 2338 | 5.94 | 932 | 848 | 250.7 |
| D | 3 | 14 | 2306 | 5.81 | 932 | 848 | 250.7 |
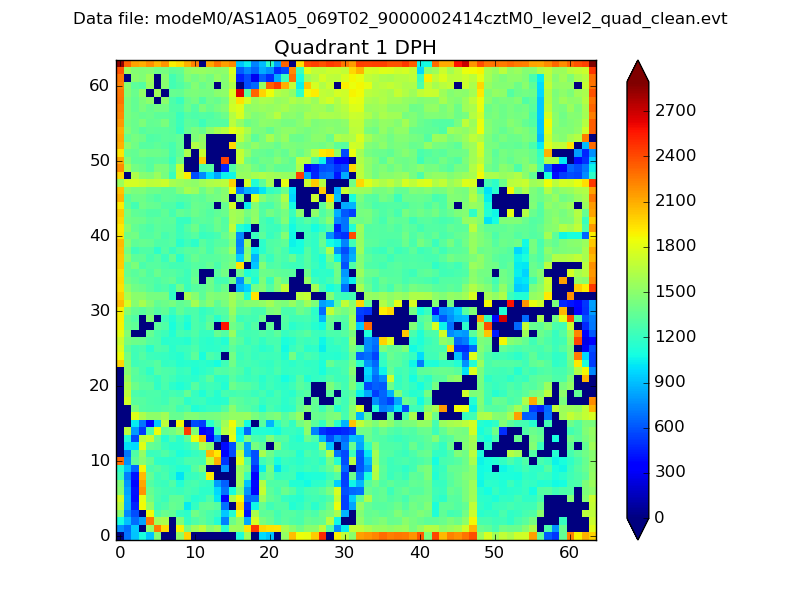
Histogram calculated using DETX and DETY for each event in the final _common_clean file
| Quadrant A | 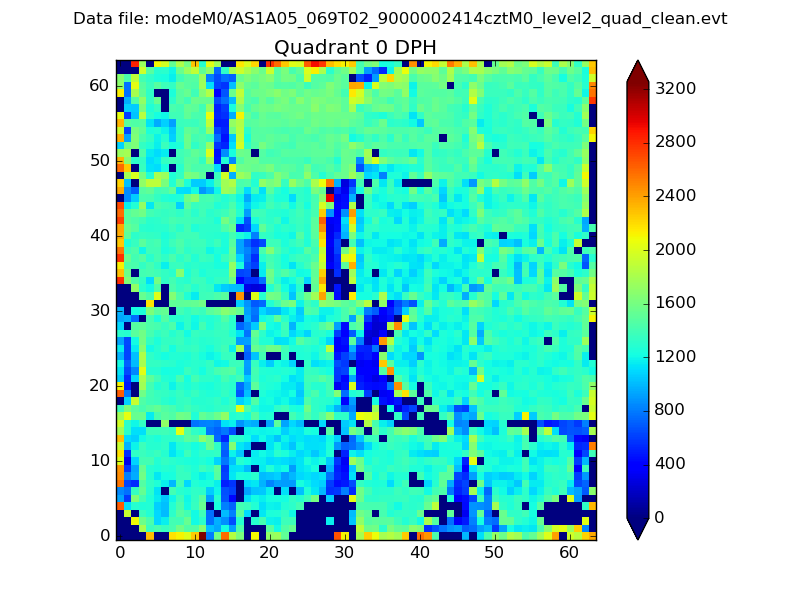 |
 |
Quadrant B |
|---|---|---|---|
| Quadrant D |  |
 |
Quadrant C |
| Plot type | Count rate plots | Images |
|---|---|---|
| Comparison with Poisson distribution Blue bars denote a histogram of data divided into 1 sec bins. Red curve is a Poisson curve with rate = median count rate of data. |
 |
 |
| Quadrant-wise count rates Data is divided into 100 sec bins |
 |
|
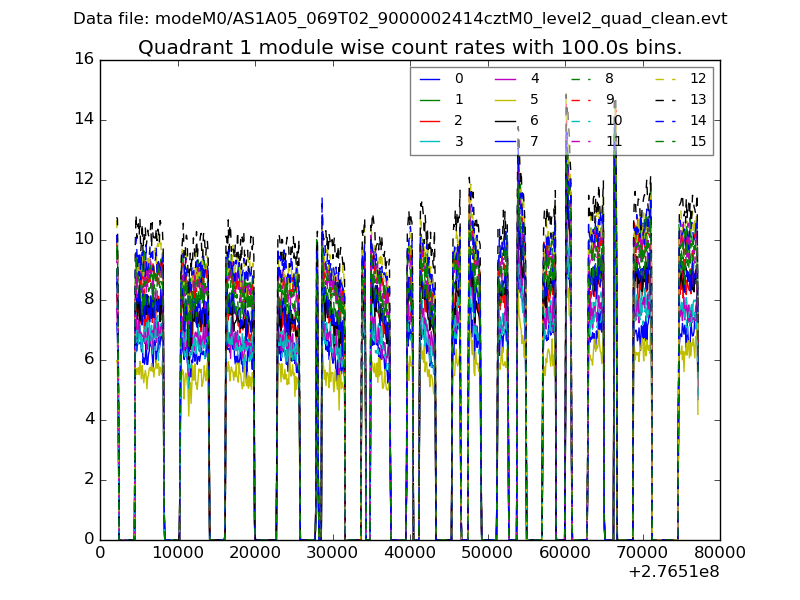
| Module-wise count rates for Quadrant A Data is divided into 100 sec bins |
 |
 |
| Module-wise count rates for Quadrant B Data is divided into 100 sec bins |
 |
 |
| Module-wise count rates for Quadrant C Data is divided into 100 sec bins |
 |
 |
| Module-wise count rates for Quadrant D Data is divided into 100 sec bins |
 |
 |
| Parameter | Plot |
|---|---|
| CZT HV Monitor | 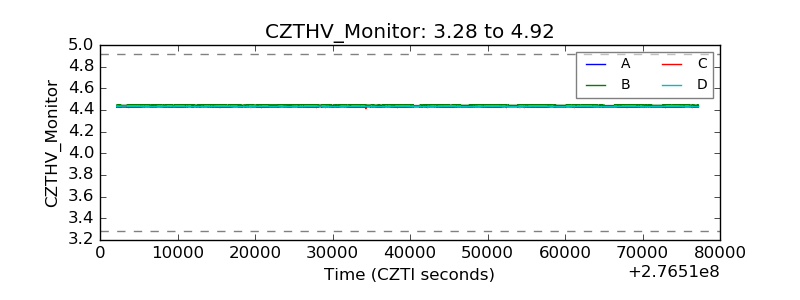 |
| D_VDD |  |
| Temperature 1 |  |
| Veto HV Monitor |  |
| Veto LLD |  |
| Alpha Counter |  |
| _CPM_Rate |  |
| CZT Counter |  |
| +2.5 Volts monitor |  |
| +5 Volts monitor |  |
| _ROLL_ROT |  |
| _Roll_DEC | 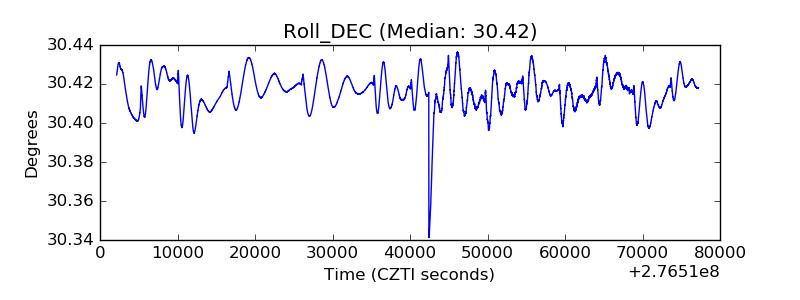 |
| _Roll_RA |  |
| Veto Counter |  |