| Param | Original file | Final file |
|---|---|---|
| Filename | modeM0/AS1A05_069T02_9000002414_16349cztM0_level2.evt | modeM0/AS1A05_069T02_9000002414_16349cztM0_level2_quad_clean.evt |
| Size (bytes) | 915,073,920 | 160,732,800 |
| Size | 872.7 MB | 153.3 MB |
| Events in quadrant A | 7,019,564 | 1,017,805 |
| Events in quadrant B | 6,508,083 | 1,030,542 |
| Events in quadrant C | 6,218,650 | 993,589 |
| Events in quadrant D | 7,119,792 | 960,573 |
| Mode M0 | |||
|---|---|---|---|
| Quadrant | BADHDUFLAG | Total packets | Discarded packets |
| A | 0 | 29381 | 5 |
| B | 0 | 27424 | 4 |
| C | 0 | 26541 | 4 |
| D | 0 | 29821 | 4 |
| Mode M9 | |||
|---|---|---|---|
| Quadrant | BADHDUFLAG | Total packets | Discarded packets |
| A | 0 | 18 | 0 |
| B | 0 | 18 | 0 |
| C | 0 | 18 | 0 |
| D | 0 | 19 | 0 |
| Mode SS | |||
|---|---|---|---|
| Quadrant | BADHDUFLAG | Total packets | Discarded packets |
| A | 0 | 256 | 0 |
| B | 0 | 256 | 0 |
| C | 0 | 256 | 0 |
| D | 0 | 256 | 0 |
| Quadrant | Total seconds | Saturated seconds | Saturation percentage |
|---|---|---|---|
| A | 12510 | 556 | 4.444444% |
| B | 12510 | 192 | 1.534772% |
| C | 12510 | 217 | 1.734612% |
| D | 12510 | 304 | 2.430056% |
Noise dominated data is calculated using 1-second bins in cleaned event files. If a bin has >2000 counts, and if more than 50% of those come from <1% of pixels, then it is considered to be noise-dominated and hence unusable.
| Quadrant | # 1 sec bins | Bins with >0 counts | Bins with >2000 counts | High rate bins dominated by noise | Noise dominated (total time) | Noise dominated (detector-on time) | Marked lightcurve |
|---|---|---|---|---|---|---|---|
| A | 13626 | 12513 | 307 | 307 | 2.25% | 2.45% | 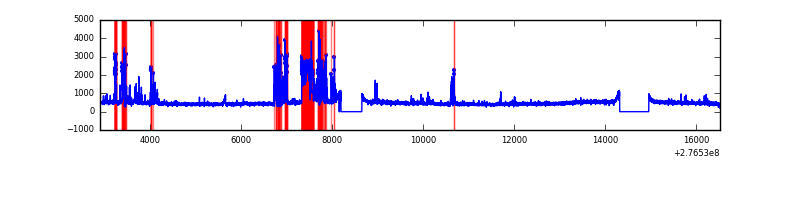 |
| B | 13626 | 12513 | 47 | 47 | 0.34% | 0.38% | 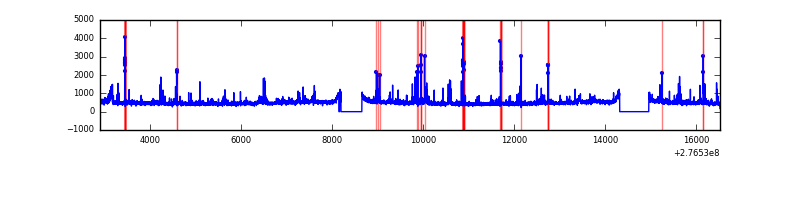 |
| C | 13626 | 12514 | 41 | 41 | 0.30% | 0.33% | 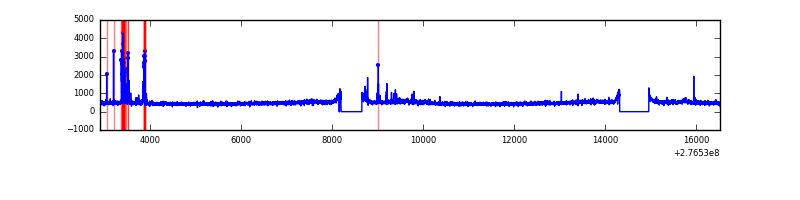 |
| D | 13626 | 12514 | 172 | 172 | 1.26% | 1.37% | 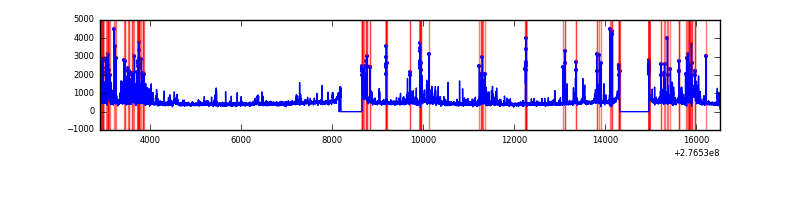 |
Top three noisy pixels from each quadrant. If the there are fewer than three noisy pixels in the level2.evt file, extra rows are filled as -1
| Pixel properties | Quadrant properties | ||||||
|---|---|---|---|---|---|---|---|
| Quadrant | DetID | PixID | Counts | Sigma | Mean | Median | Sigma |
| A | 15 | 174 | 1420368 | 4862.25 | 1454 | 1419 | 291.8 |
| A | 0 | 226 | 12808 | 39.03 | 1454 | 1419 | 291.8 |
| A | 12 | 194 | 10663 | 31.68 | 1454 | 1419 | 291.8 |
| B | 0 | 189 | 225372 | 785.28 | 1485 | 1442 | 285.2 |
| B | 15 | 35 | 129163 | 447.89 | 1485 | 1442 | 285.2 |
| B | 10 | 16 | 80348 | 276.71 | 1485 | 1442 | 285.2 |
| C | 0 | 207 | 255742 | 759.88 | 1432 | 1440 | 334.7 |
| C | 14 | 238 | 217947 | 646.94 | 1432 | 1440 | 334.7 |
| C | 3 | 233 | 146329 | 432.94 | 1432 | 1440 | 334.7 |
| D | 12 | 218 | 796443 | 2253.94 | 1443 | 1403 | 352.7 |
| D | 1 | 52 | 592294 | 1675.18 | 1443 | 1403 | 352.7 |
| D | 13 | 104 | 84366 | 235.2 | 1443 | 1403 | 352.7 |
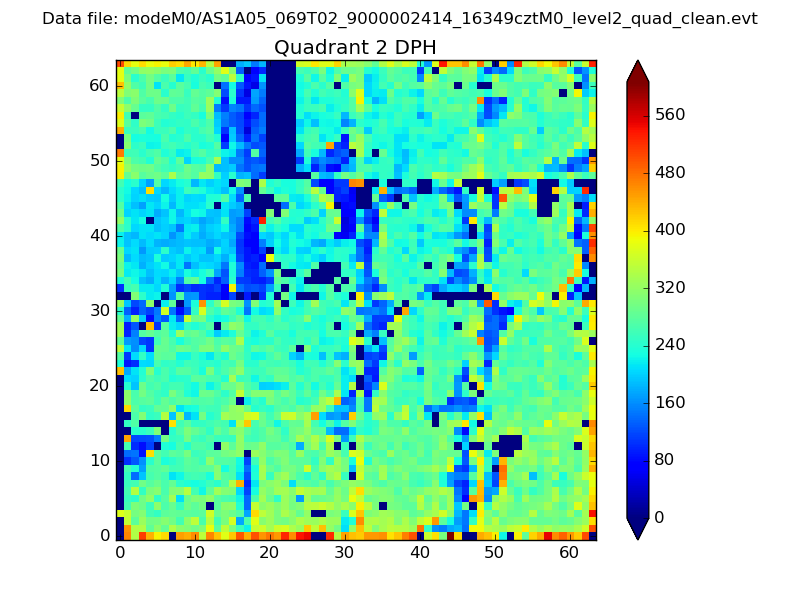
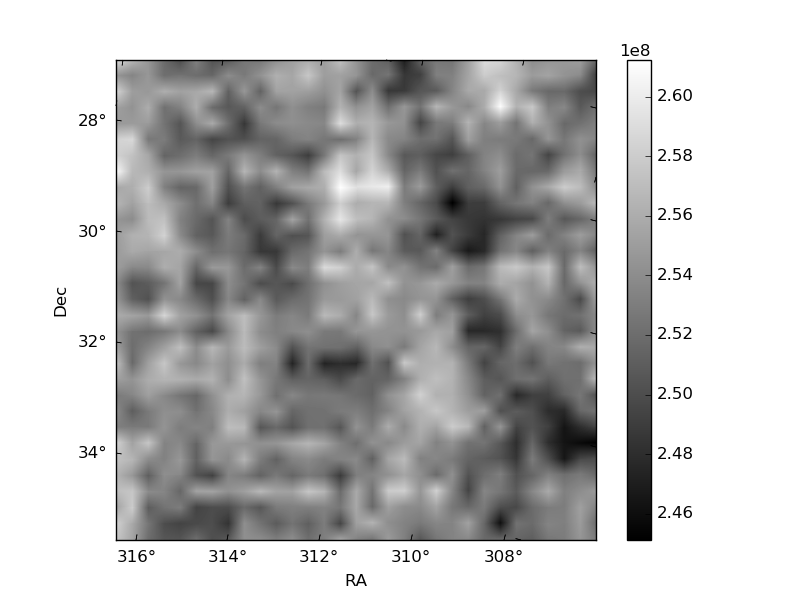
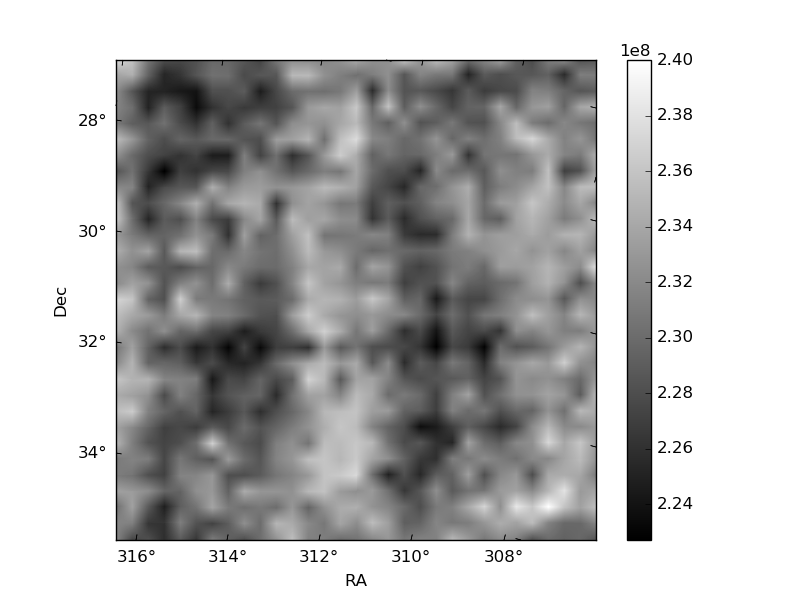
Histogram calculated using DETX and DETY for each event in the final _common_clean file
| Quadrant A | 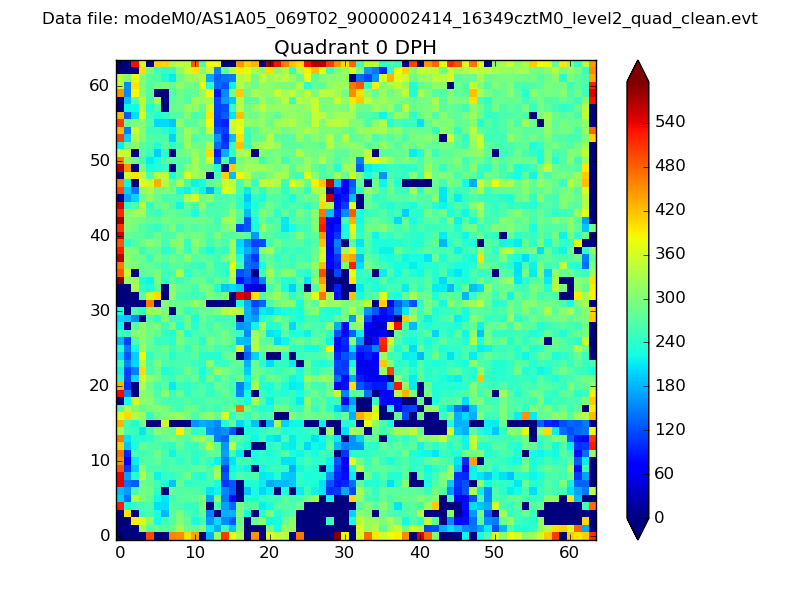 |
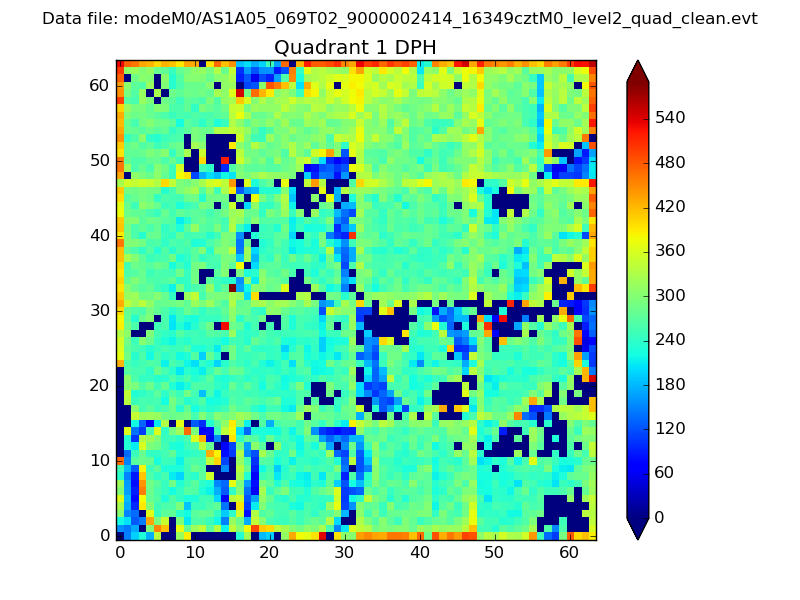 |
Quadrant B |
|---|---|---|---|
| Quadrant D | 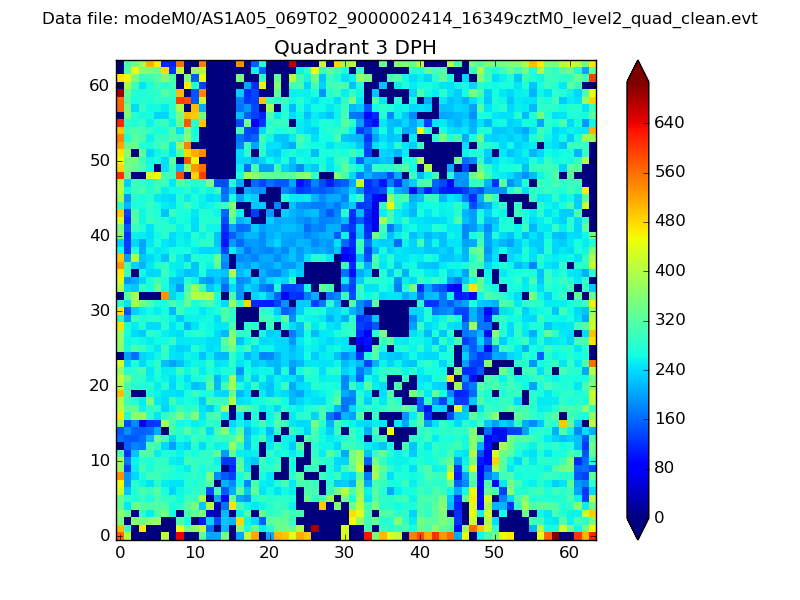 |
 |
Quadrant C |
| Plot type | Count rate plots | Images |
|---|---|---|
| Comparison with Poisson distribution Blue bars denote a histogram of data divided into 1 sec bins. Red curve is a Poisson curve with rate = median count rate of data. |
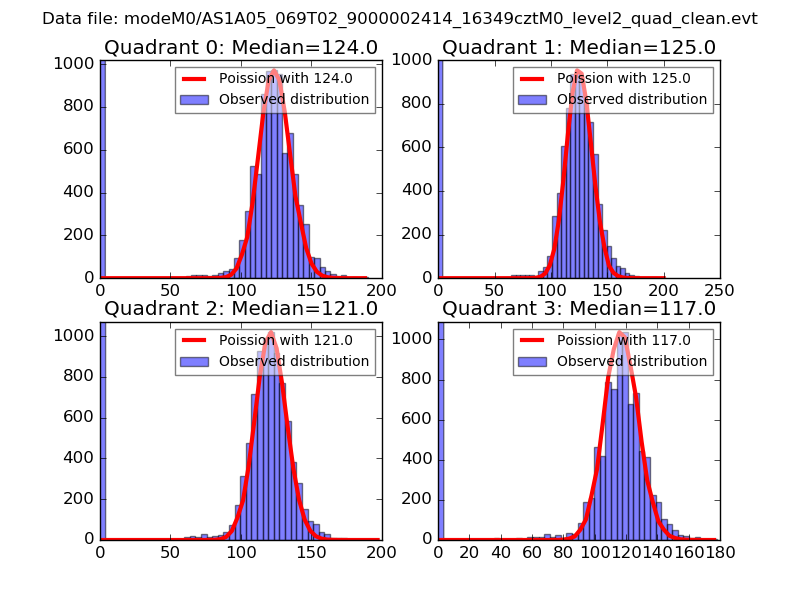 |
 |
| Quadrant-wise count rates Data is divided into 100 sec bins |
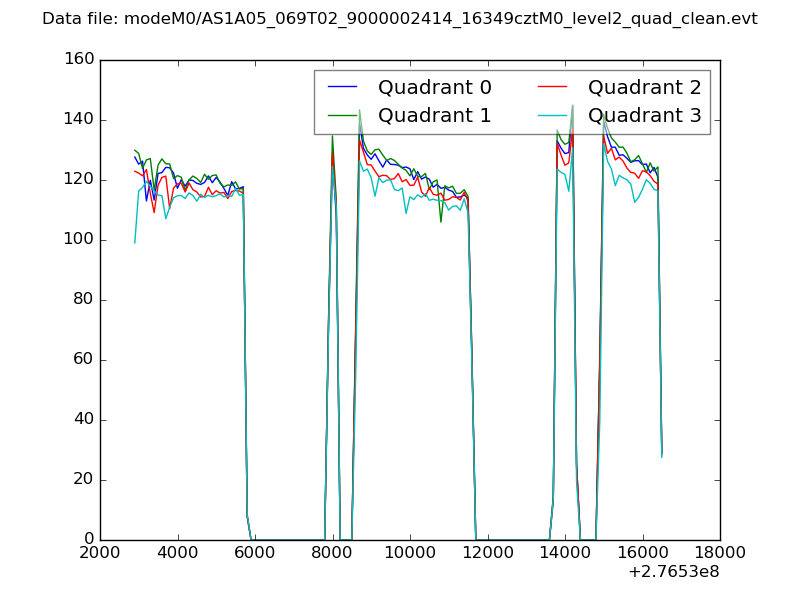 |
|
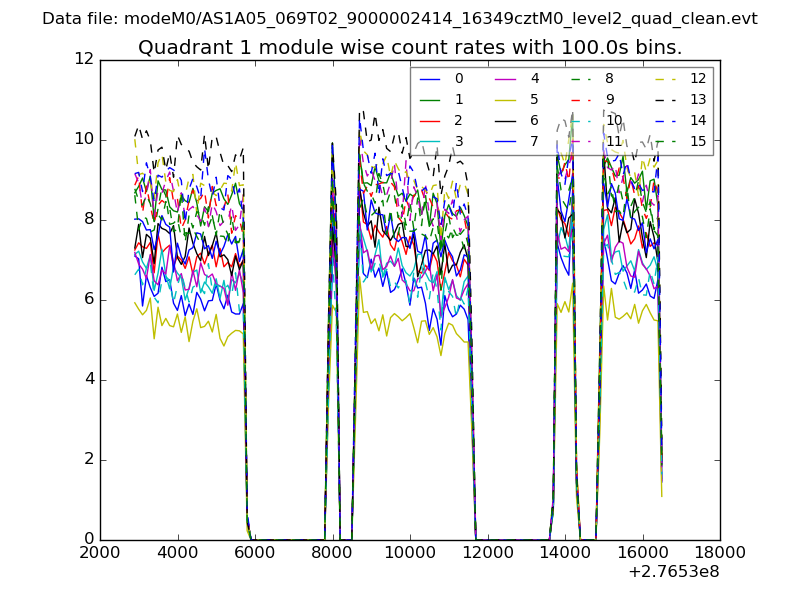
| Module-wise count rates for Quadrant A Data is divided into 100 sec bins |
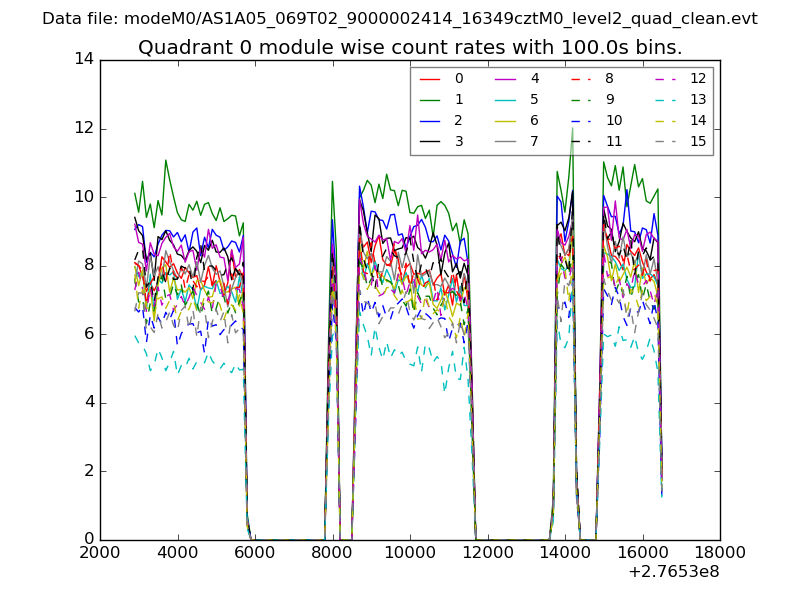 |
 |
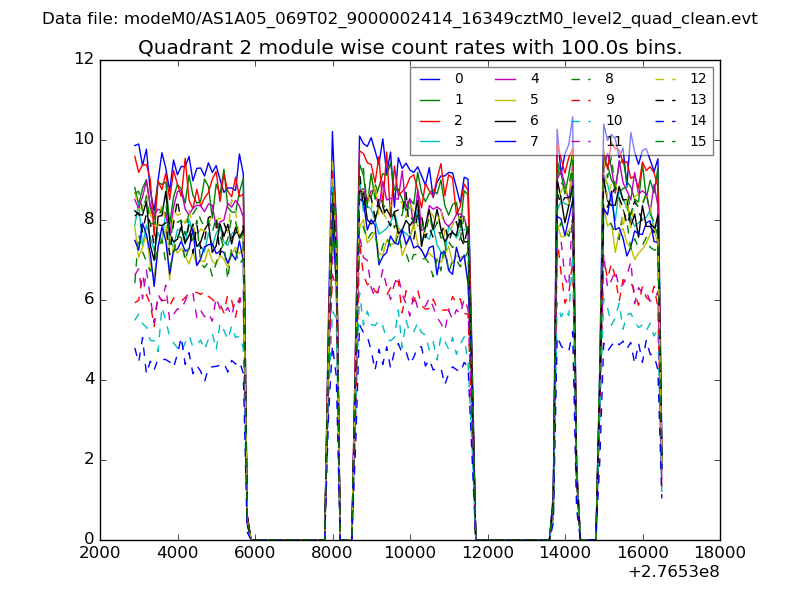
| Module-wise count rates for Quadrant B Data is divided into 100 sec bins |
 |
 |
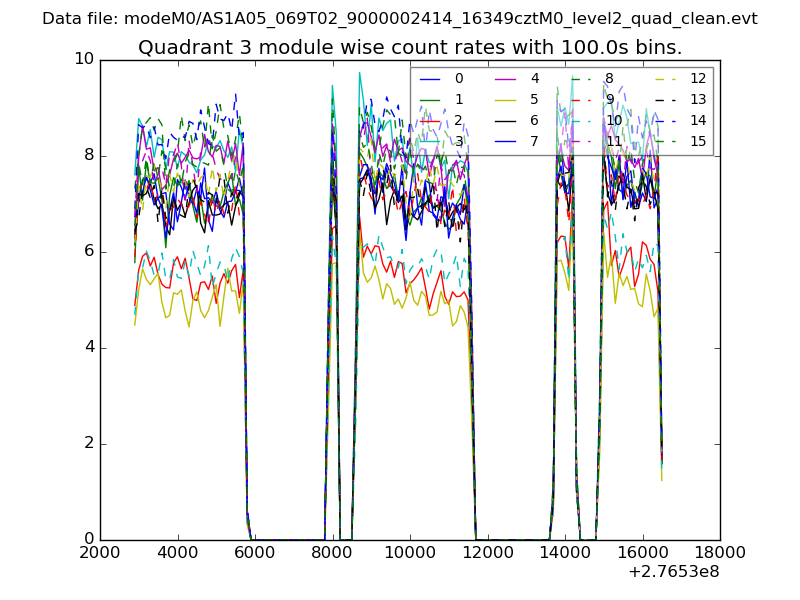
| Module-wise count rates for Quadrant C Data is divided into 100 sec bins |
 |
 |
| Module-wise count rates for Quadrant D Data is divided into 100 sec bins |
 |
 |
| Parameter | Plot |
|---|---|
| CZT HV Monitor | 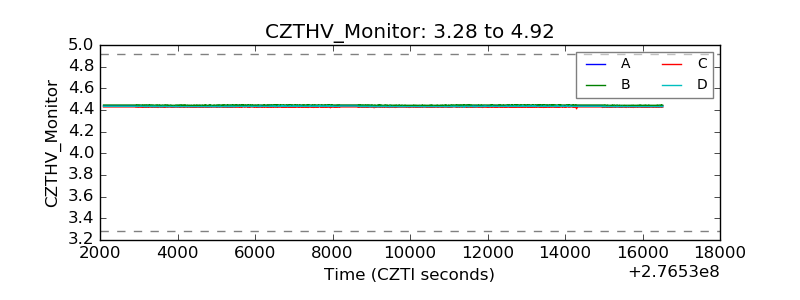 |
| D_VDD | 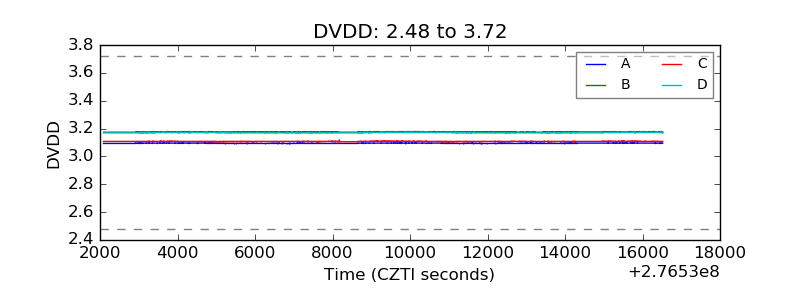 |
| Temperature 1 | 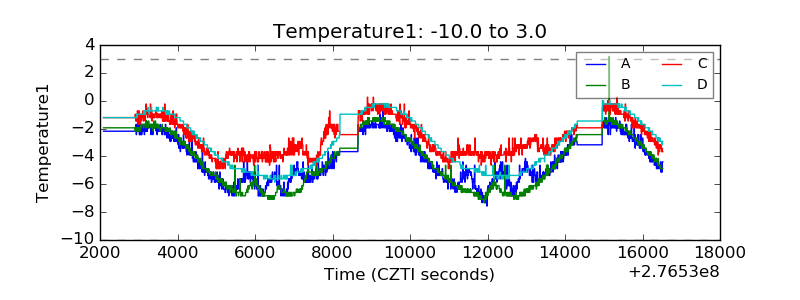 |
| Veto HV Monitor | 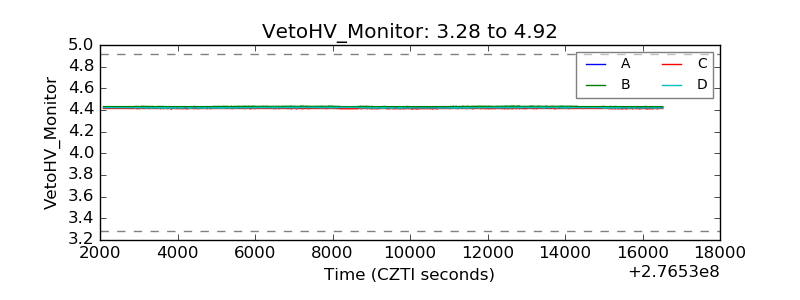 |
| Veto LLD | 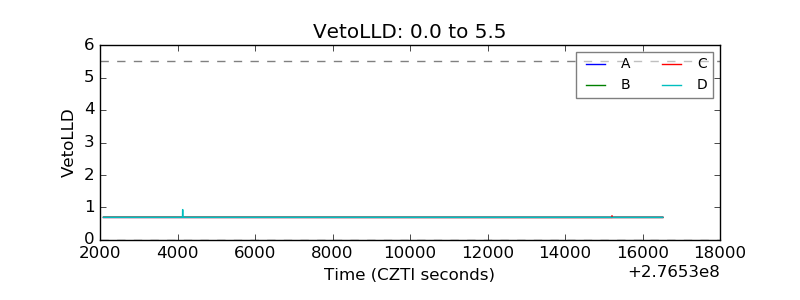 |
| Alpha Counter | 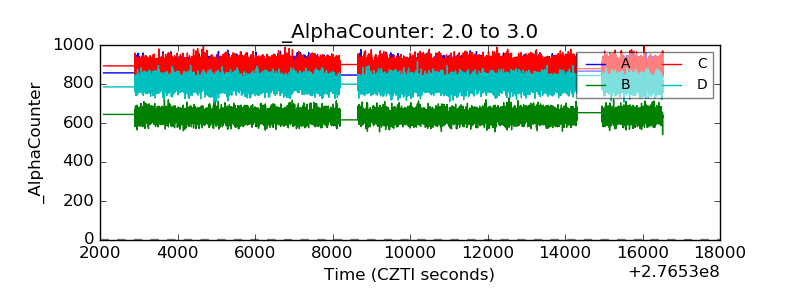 |
| _CPM_Rate | 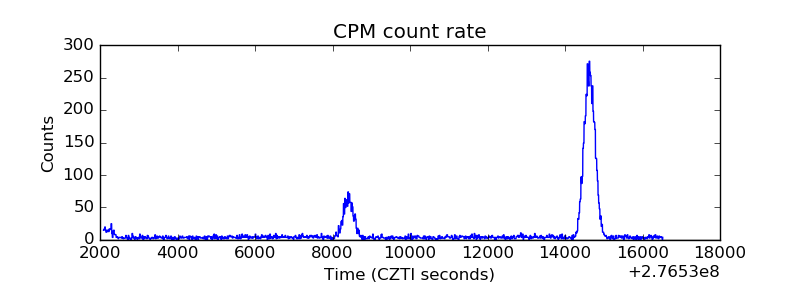 |
| CZT Counter | 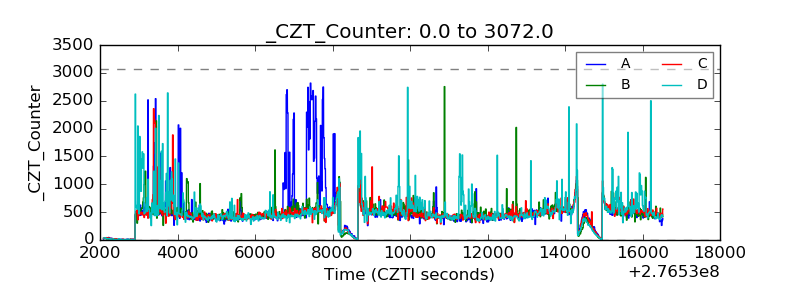 |
| +2.5 Volts monitor |  |
| +5 Volts monitor |  |
| _ROLL_ROT | 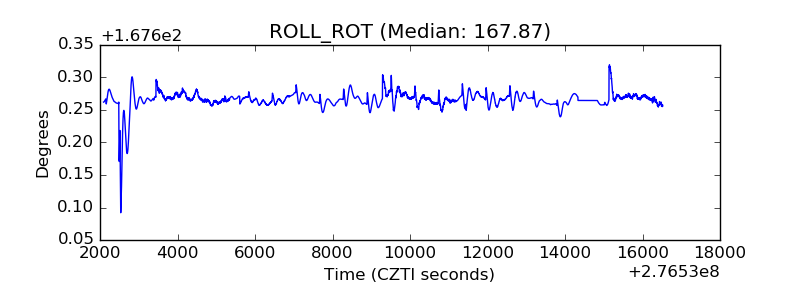 |
| _Roll_DEC | 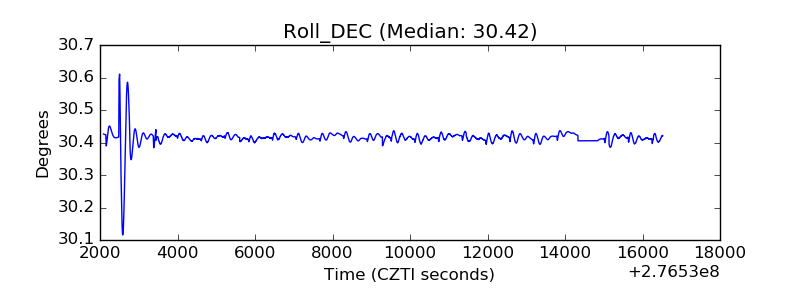 |
| _Roll_RA |  |
| Veto Counter | 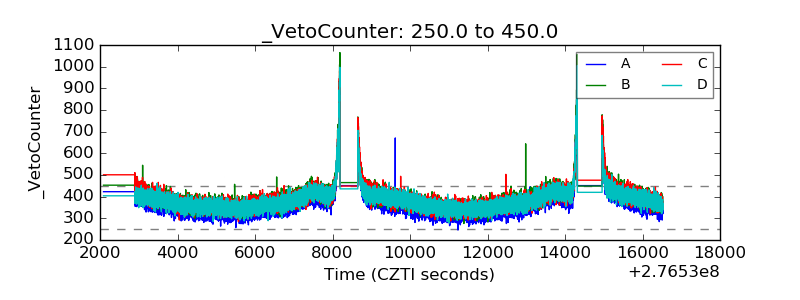 |