| Param | Original file | Final file |
|---|---|---|
| Filename | modeM0/AS1A05_069T02_9000002414_16350cztM0_level2.evt | modeM0/AS1A05_069T02_9000002414_16350cztM0_level2_quad_clean.evt |
| Size (bytes) | 469,226,880 | 93,211,200 |
| Size | 447.5 MB | 88.9 MB |
| Events in quadrant A | 3,172,224 | 598,242 |
| Events in quadrant B | 3,522,968 | 606,246 |
| Events in quadrant C | 3,301,116 | 582,157 |
| Events in quadrant D | 3,750,463 | 560,575 |
| Mode M0 | |||
|---|---|---|---|
| Quadrant | BADHDUFLAG | Total packets | Discarded packets |
| A | 0 | 13986 | 3 |
| B | 0 | 14920 | 2 |
| C | 0 | 14132 | 2 |
| D | 0 | 15852 | 2 |
| Mode M9 | |||
|---|---|---|---|
| Quadrant | BADHDUFLAG | Total packets | Discarded packets |
| A | 0 | 10 | 0 |
| B | 0 | 10 | 0 |
| C | 0 | 10 | 0 |
| D | 0 | 11 | 0 |
| Mode SS | |||
|---|---|---|---|
| Quadrant | BADHDUFLAG | Total packets | Discarded packets |
| A | 0 | 140 | 0 |
| B | 0 | 140 | 0 |
| C | 0 | 140 | 0 |
| D | 0 | 140 | 0 |
| Quadrant | Total seconds | Saturated seconds | Saturation percentage |
|---|---|---|---|
| A | 6819 | 25 | 0.366623% |
| B | 6819 | 69 | 1.011879% |
| C | 6819 | 63 | 0.923889% |
| D | 6819 | 126 | 1.847778% |
Noise dominated data is calculated using 1-second bins in cleaned event files. If a bin has >2000 counts, and if more than 50% of those come from <1% of pixels, then it is considered to be noise-dominated and hence unusable.
| Quadrant | # 1 sec bins | Bins with >0 counts | Bins with >2000 counts | High rate bins dominated by noise | Noise dominated (total time) | Noise dominated (detector-on time) | Marked lightcurve |
|---|---|---|---|---|---|---|---|
| A | 7675 | 6821 | 0 | 0 | 0.00% | 0.00% | 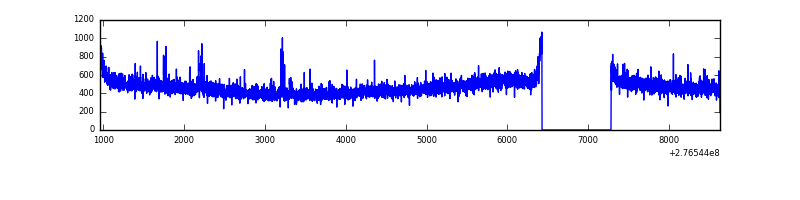 |
| B | 7675 | 6821 | 20 | 20 | 0.26% | 0.29% | 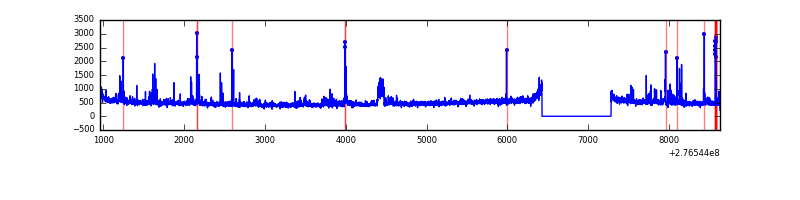 |
| C | 7675 | 6821 | 2 | 2 | 0.03% | 0.03% | 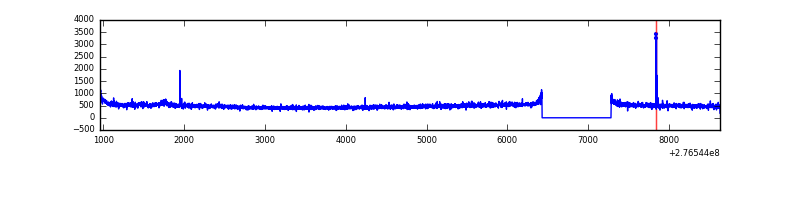 |
| D | 7675 | 6821 | 91 | 91 | 1.19% | 1.33% | 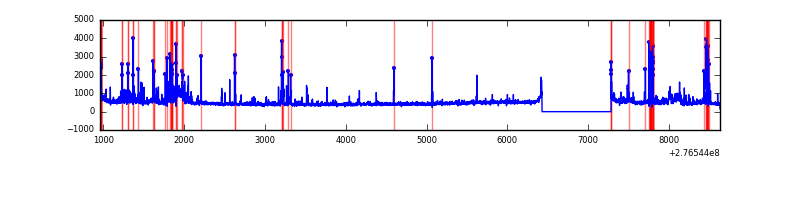 |
Top three noisy pixels from each quadrant. If the there are fewer than three noisy pixels in the level2.evt file, extra rows are filled as -1
| Pixel properties | Quadrant properties | ||||||
|---|---|---|---|---|---|---|---|
| Quadrant | DetID | PixID | Counts | Sigma | Mean | Median | Sigma |
| A | 15 | 174 | 44926 | 268.61 | 812 | 794 | 164.3 |
| A | 0 | 226 | 6919 | 37.28 | 812 | 794 | 164.3 |
| A | 15 | 223 | 6643 | 35.6 | 812 | 794 | 164.3 |
| B | 0 | 189 | 104541 | 665.3 | 813 | 793 | 155.9 |
| B | 15 | 35 | 87478 | 555.88 | 813 | 793 | 155.9 |
| B | 0 | 219 | 43431 | 273.42 | 813 | 793 | 155.9 |
| C | 14 | 238 | 118341 | 636.0 | 783 | 788 | 184.8 |
| C | 3 | 233 | 87676 | 470.09 | 783 | 788 | 184.8 |
| C | 7 | 247 | 20139 | 104.69 | 783 | 788 | 184.8 |
| D | 12 | 218 | 461416 | 2379.25 | 788 | 763 | 193.6 |
| D | 1 | 52 | 121549 | 623.85 | 788 | 763 | 193.6 |
| D | 13 | 104 | 91367 | 467.96 | 788 | 763 | 193.6 |
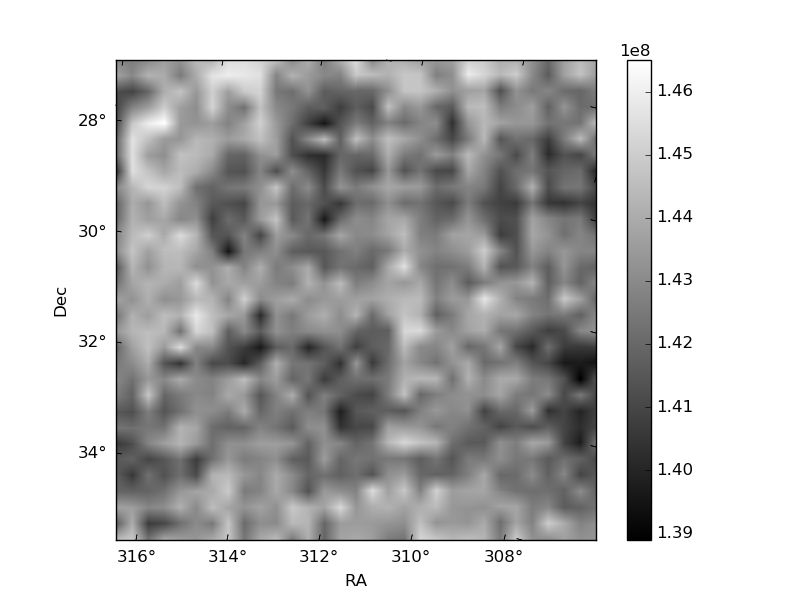
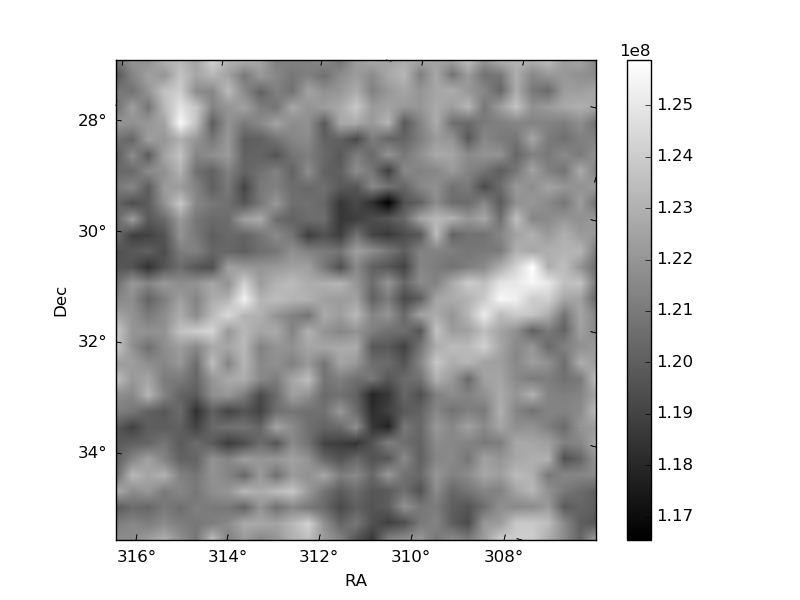
Histogram calculated using DETX and DETY for each event in the final _common_clean file
| Quadrant A | 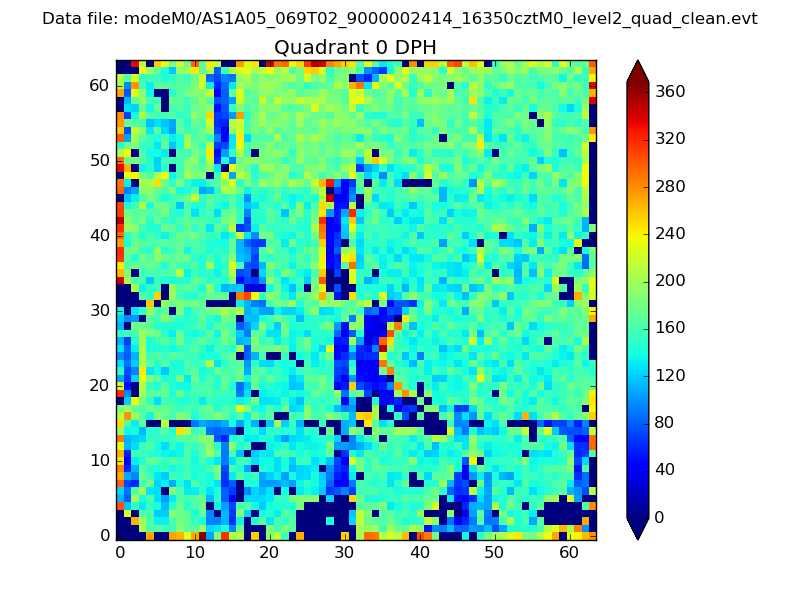 |
 |
Quadrant B |
|---|---|---|---|
| Quadrant D |  |
 |
Quadrant C |
| Plot type | Count rate plots | Images |
|---|---|---|
| Comparison with Poisson distribution Blue bars denote a histogram of data divided into 1 sec bins. Red curve is a Poisson curve with rate = median count rate of data. |
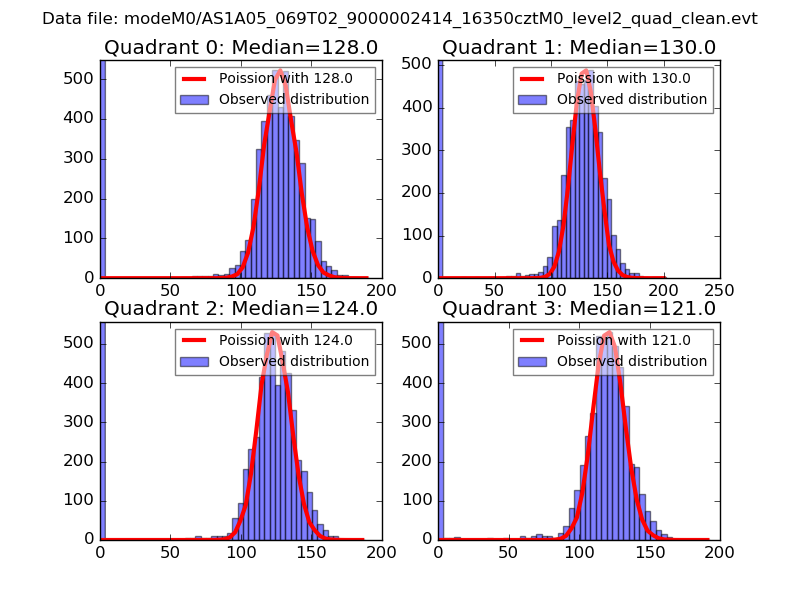 |
 |
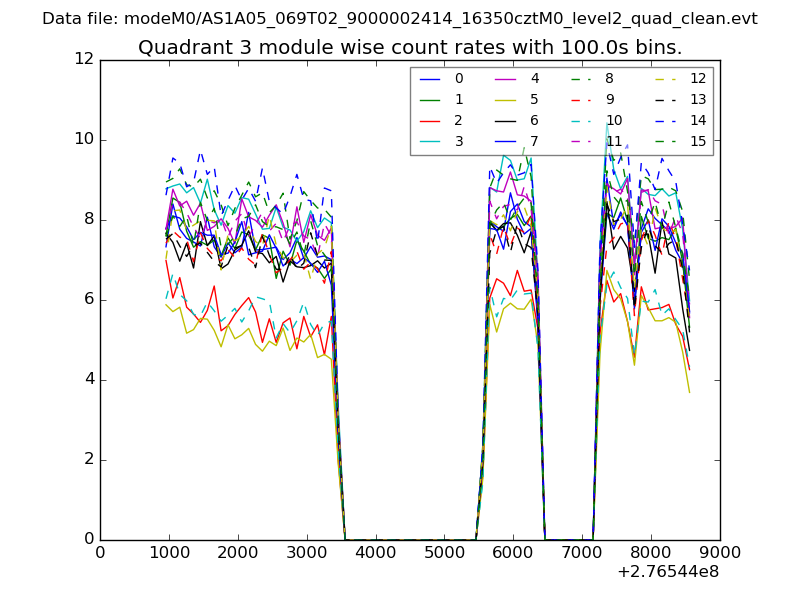
| Quadrant-wise count rates Data is divided into 100 sec bins |
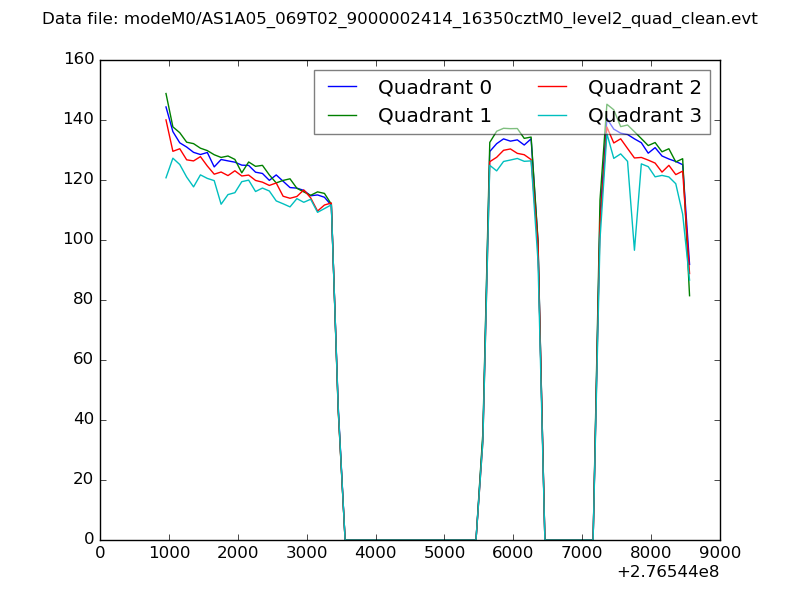 |
|
| Module-wise count rates for Quadrant A Data is divided into 100 sec bins |
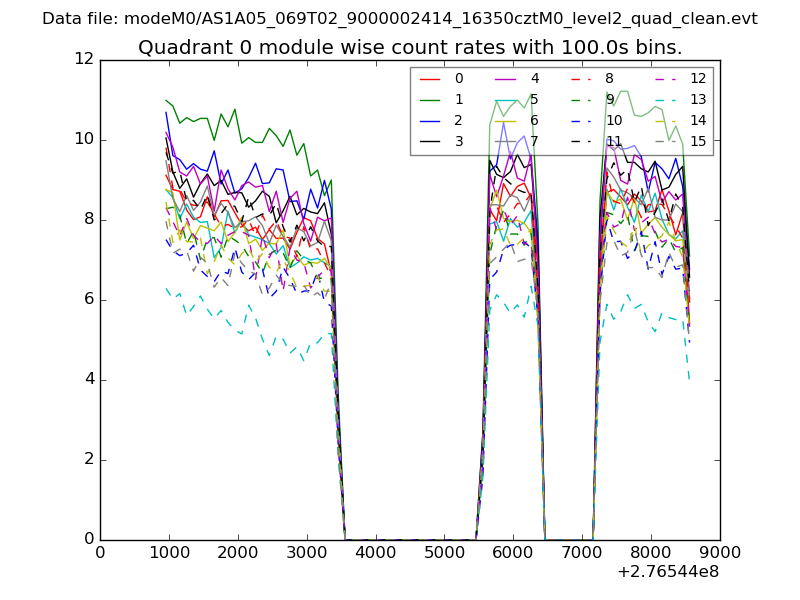 |
 |
| Module-wise count rates for Quadrant B Data is divided into 100 sec bins |
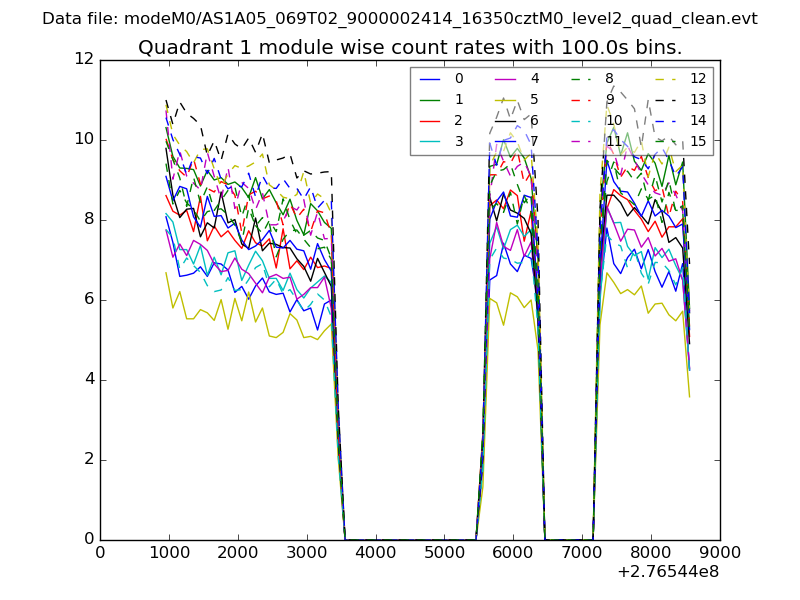 |
 |
| Module-wise count rates for Quadrant C Data is divided into 100 sec bins |
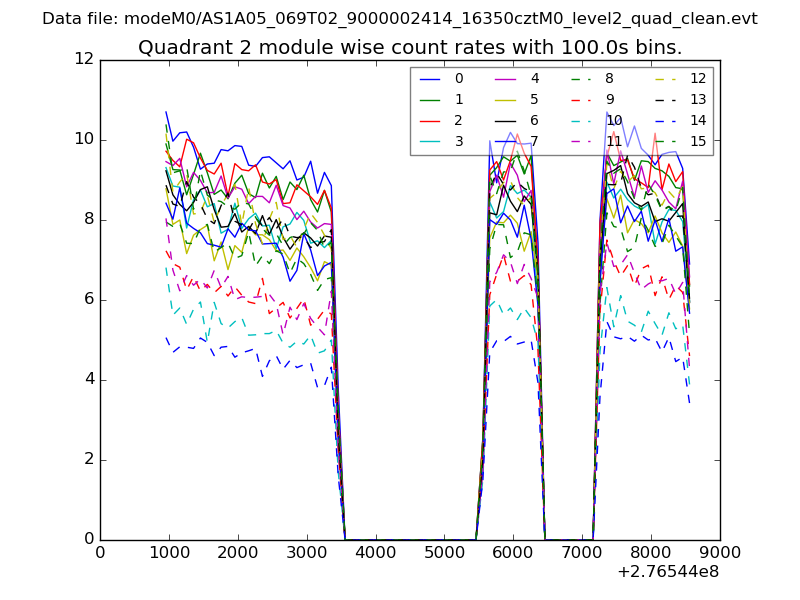 |
 |
| Module-wise count rates for Quadrant D Data is divided into 100 sec bins |
 |
 |
| Parameter | Plot |
|---|---|
| CZT HV Monitor | 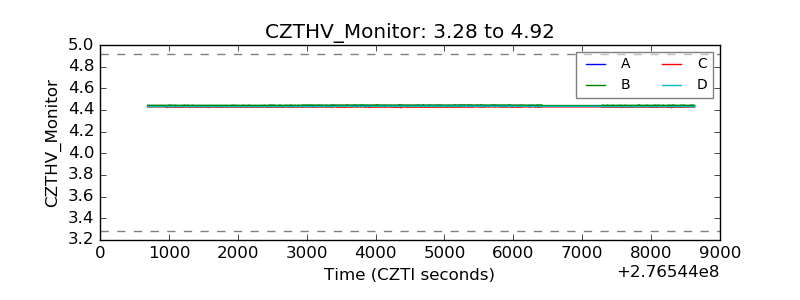 |
| D_VDD | 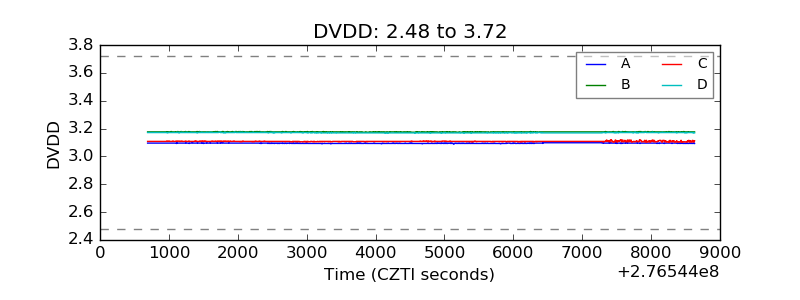 |
| Temperature 1 | 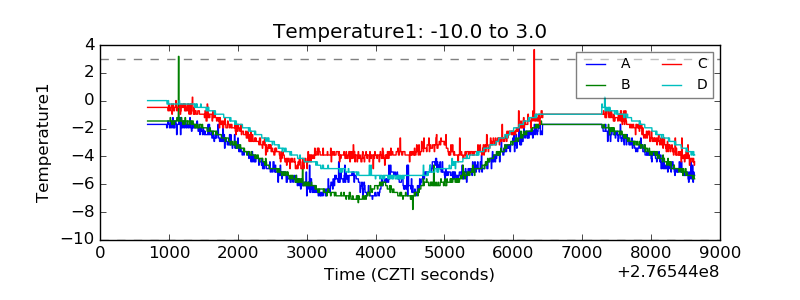 |
| Veto HV Monitor | 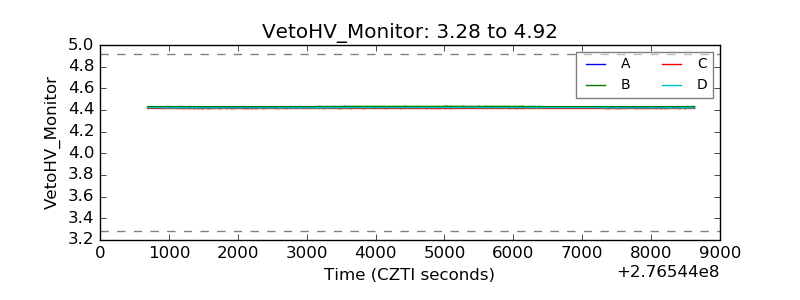 |
| Veto LLD | 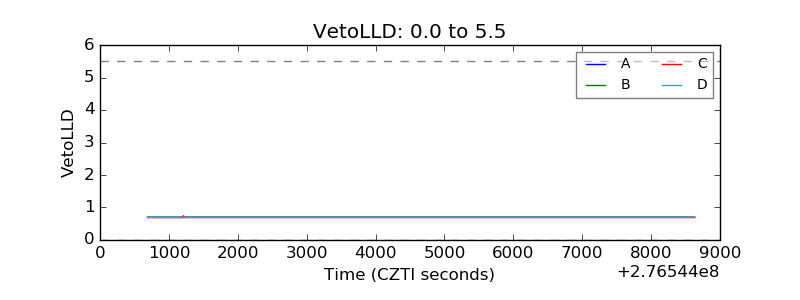 |
| Alpha Counter | 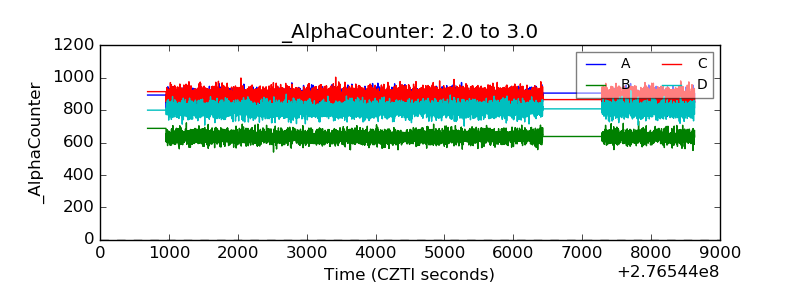 |
| _CPM_Rate | 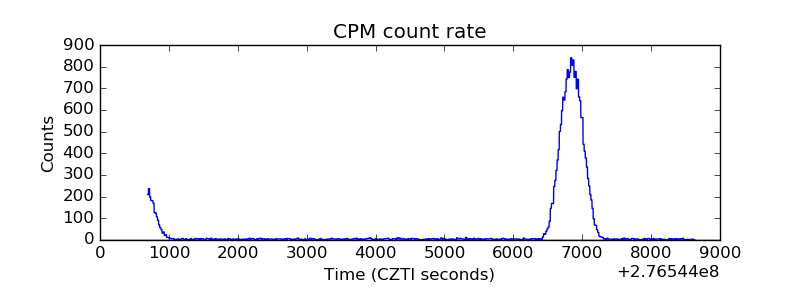 |
| CZT Counter |  |
| +2.5 Volts monitor |  |
| +5 Volts monitor |  |
| _ROLL_ROT | 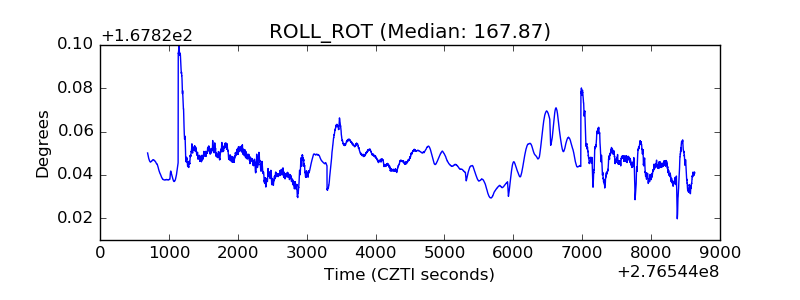 |
| _Roll_DEC | 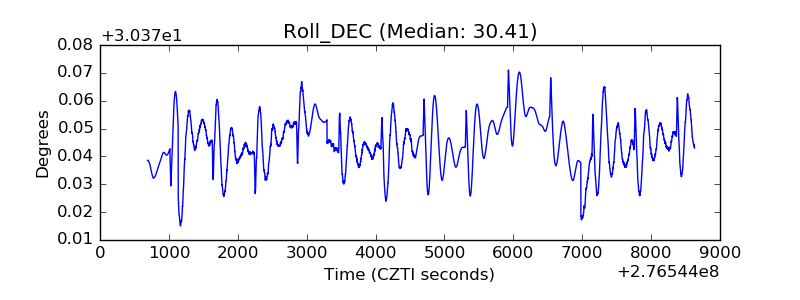 |
| _Roll_RA | 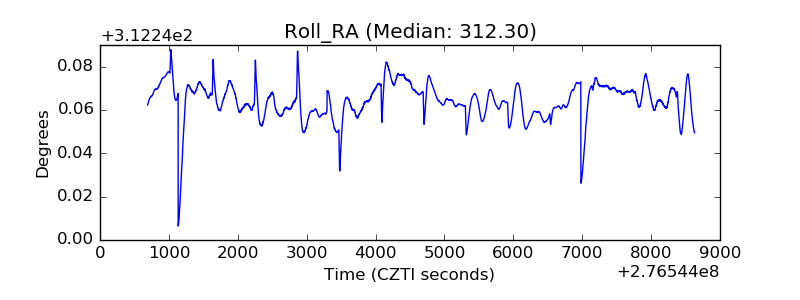 |
| Veto Counter | 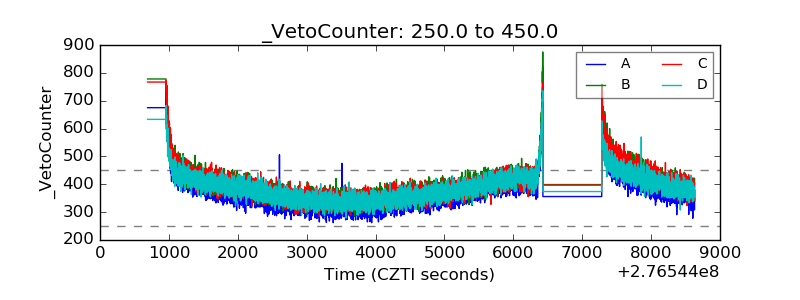 |