| Param | Original file | Final file |
|---|---|---|
| Filename | modeM0/AS1A05_069T02_9000002414_16351cztM0_level2.evt | modeM0/AS1A05_069T02_9000002414_16351cztM0_level2_quad_clean.evt |
| Size (bytes) | 490,872,960 | 96,756,480 |
| Size | 468.1 MB | 92.3 MB |
| Events in quadrant A | 3,424,869 | 620,362 |
| Events in quadrant B | 3,638,904 | 636,306 |
| Events in quadrant C | 3,406,312 | 609,041 |
| Events in quadrant D | 3,928,982 | 585,204 |
| Mode M0 | |||
|---|---|---|---|
| Quadrant | BADHDUFLAG | Total packets | Discarded packets |
| A | 0 | 14685 | 3 |
| B | 0 | 15330 | 2 |
| C | 0 | 14406 | 2 |
| D | 0 | 16368 | 2 |
| Mode M9 | |||
|---|---|---|---|
| Quadrant | BADHDUFLAG | Total packets | Discarded packets |
| A | 0 | 18 | 0 |
| B | 0 | 18 | 0 |
| C | 0 | 18 | 0 |
| D | 0 | 18 | 0 |
| Mode SS | |||
|---|---|---|---|
| Quadrant | BADHDUFLAG | Total packets | Discarded packets |
| A | 0 | 142 | 0 |
| B | 0 | 142 | 0 |
| C | 0 | 142 | 0 |
| D | 0 | 142 | 0 |
| Quadrant | Total seconds | Saturated seconds | Saturation percentage |
|---|---|---|---|
| A | 6875 | 120 | 1.745455% |
| B | 6875 | 98 | 1.425455% |
| C | 6875 | 84 | 1.221818% |
| D | 6875 | 179 | 2.603636% |
Noise dominated data is calculated using 1-second bins in cleaned event files. If a bin has >2000 counts, and if more than 50% of those come from <1% of pixels, then it is considered to be noise-dominated and hence unusable.
| Quadrant | # 1 sec bins | Bins with >0 counts | Bins with >2000 counts | High rate bins dominated by noise | Noise dominated (total time) | Noise dominated (detector-on time) | Marked lightcurve |
|---|---|---|---|---|---|---|---|
| A | 8746 | 6878 | 57 | 57 | 0.65% | 0.83% |  |
| B | 8746 | 6878 | 32 | 32 | 0.37% | 0.47% | 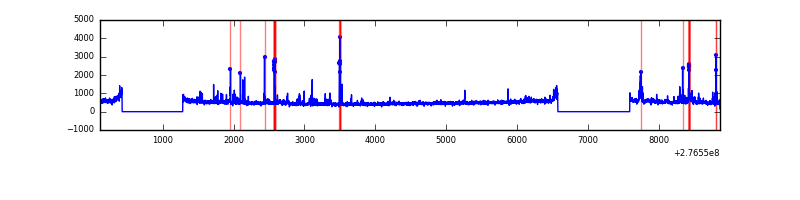 |
| C | 8746 | 6878 | 6 | 6 | 0.07% | 0.09% | 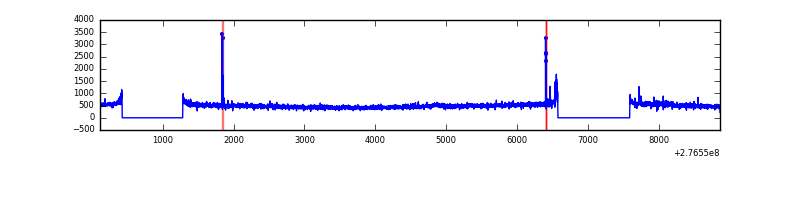 |
| D | 8746 | 6878 | 110 | 110 | 1.26% | 1.60% | 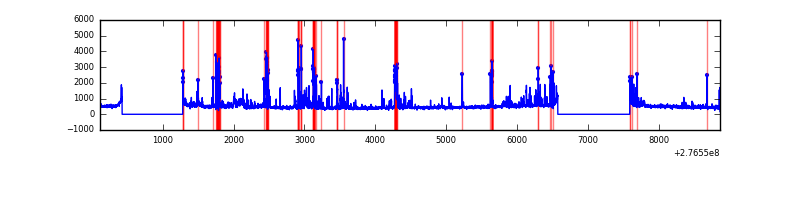 |
Top three noisy pixels from each quadrant. If the there are fewer than three noisy pixels in the level2.evt file, extra rows are filled as -1
| Pixel properties | Quadrant properties | ||||||
|---|---|---|---|---|---|---|---|
| Quadrant | DetID | PixID | Counts | Sigma | Mean | Median | Sigma |
| A | 15 | 174 | 231694 | 1384.95 | 829 | 809 | 166.7 |
| A | 0 | 226 | 7078 | 37.6 | 829 | 809 | 166.7 |
| A | 12 | 194 | 6068 | 31.55 | 829 | 809 | 166.7 |
| B | 0 | 189 | 132960 | 822.43 | 835 | 813 | 160.7 |
| B | 0 | 219 | 57568 | 353.22 | 835 | 813 | 160.7 |
| B | 0 | 229 | 39837 | 242.87 | 835 | 813 | 160.7 |
| C | 14 | 238 | 123394 | 647.58 | 803 | 808 | 189.3 |
| C | 3 | 233 | 59074 | 307.8 | 803 | 808 | 189.3 |
| C | 0 | 207 | 47947 | 249.02 | 803 | 808 | 189.3 |
| D | 12 | 218 | 683428 | 3479.31 | 805 | 779 | 196.2 |
| D | 10 | 70 | 64007 | 322.26 | 805 | 779 | 196.2 |
| D | 1 | 52 | 60719 | 305.5 | 805 | 779 | 196.2 |
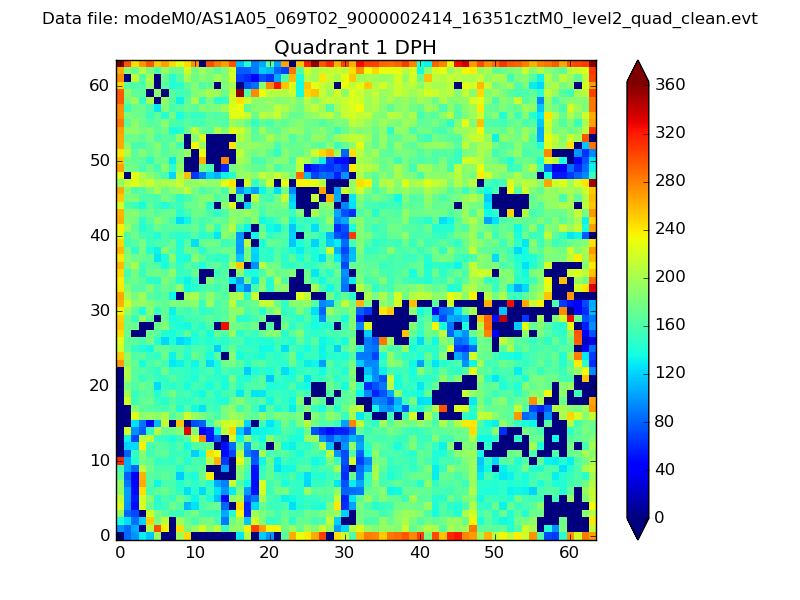
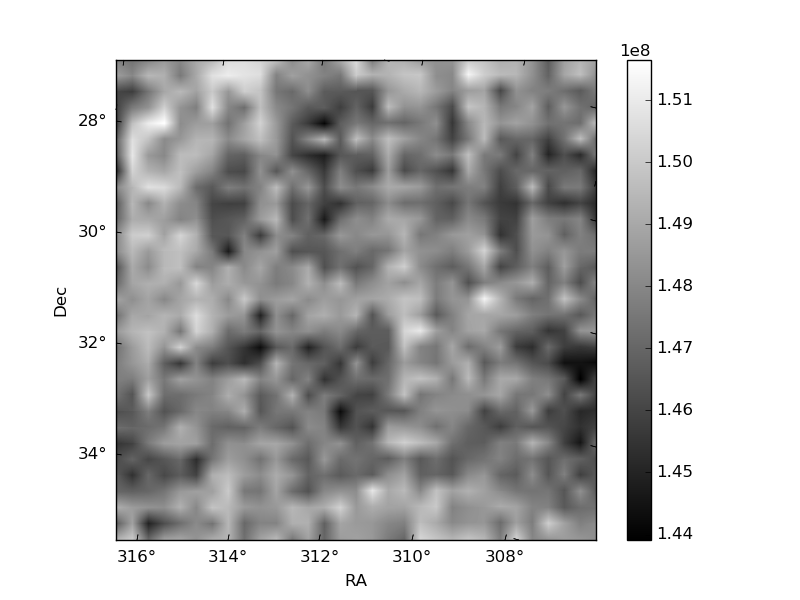
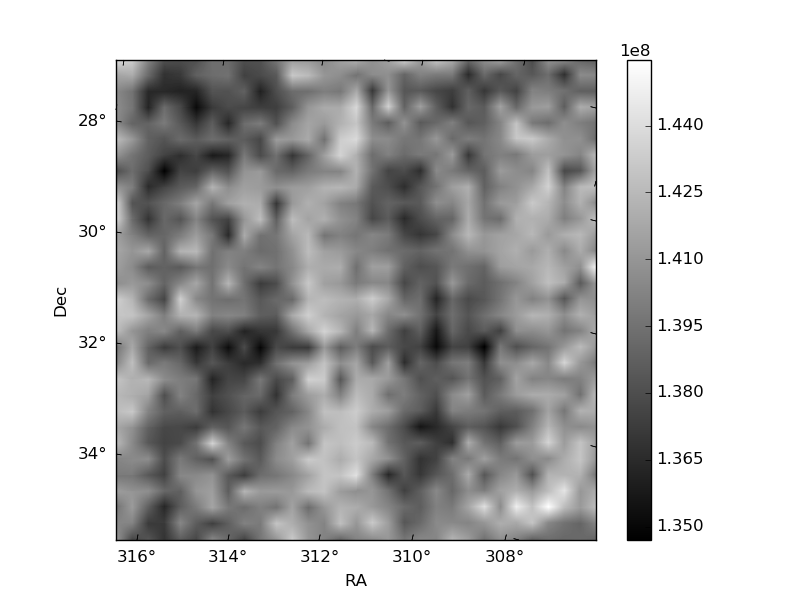
Histogram calculated using DETX and DETY for each event in the final _common_clean file
| Quadrant A |  |
 |
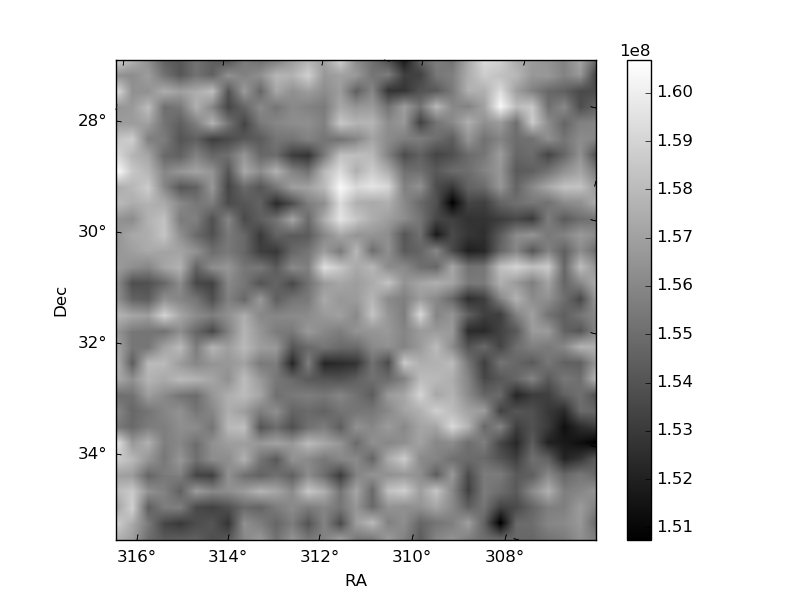
Quadrant B |
|---|---|---|---|
| Quadrant D | 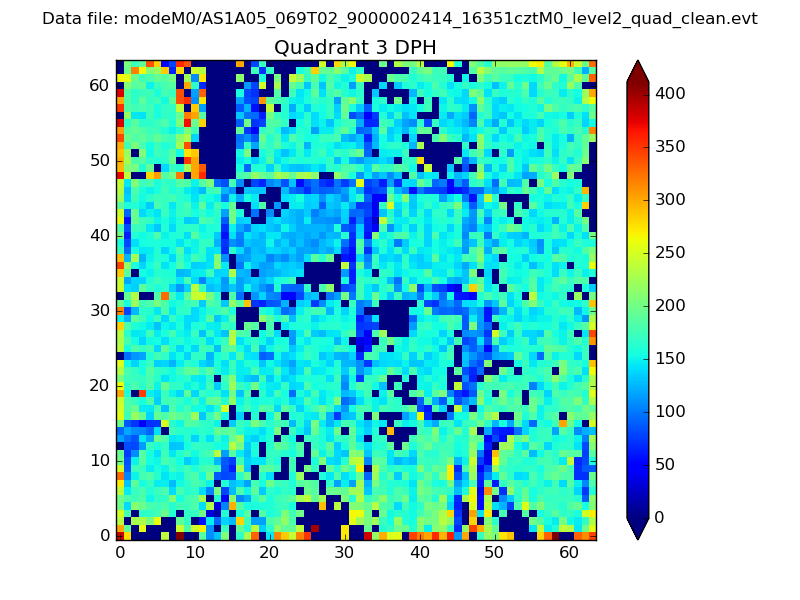 |
 |
Quadrant C |
| Plot type | Count rate plots | Images |
|---|---|---|
| Comparison with Poisson distribution Blue bars denote a histogram of data divided into 1 sec bins. Red curve is a Poisson curve with rate = median count rate of data. |
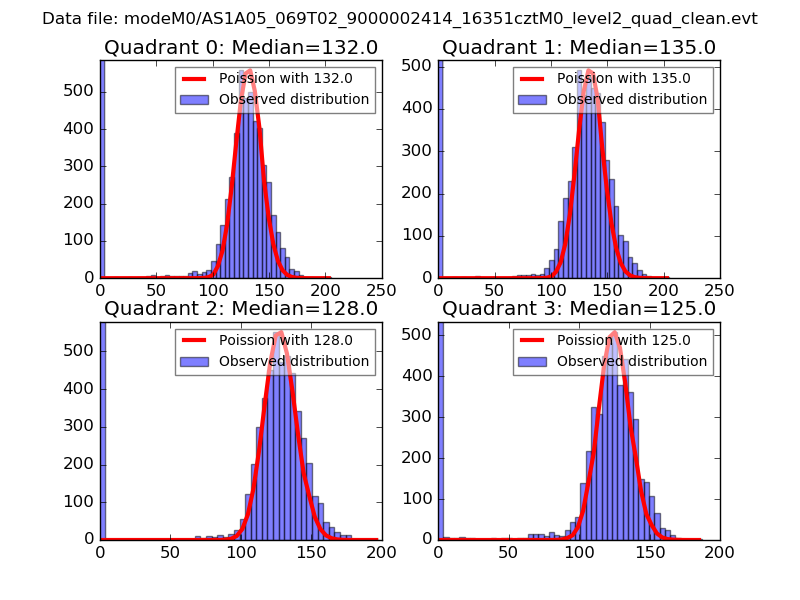 |
 |
| Quadrant-wise count rates Data is divided into 100 sec bins |
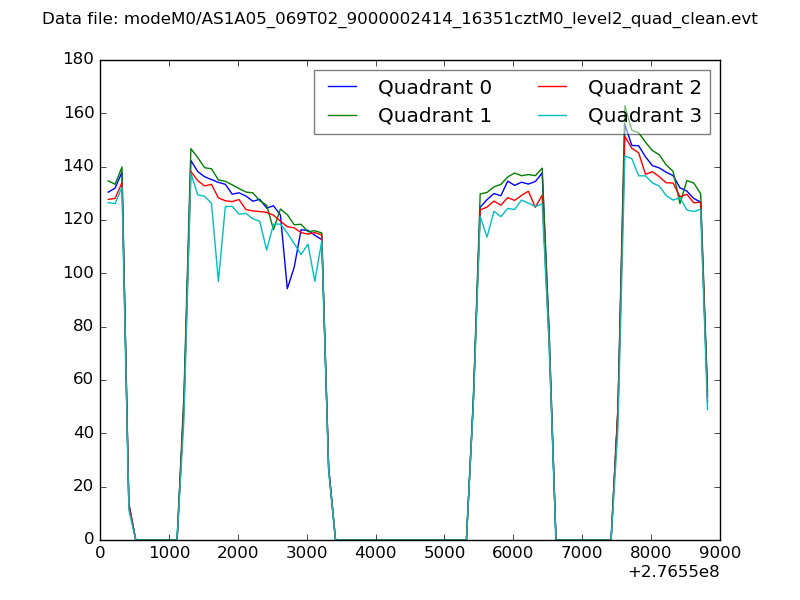 |
|
| Module-wise count rates for Quadrant A Data is divided into 100 sec bins |
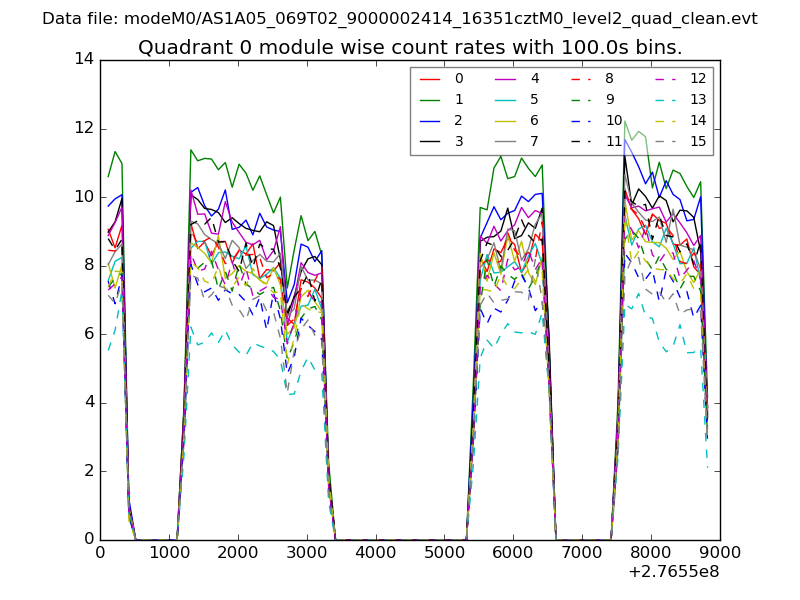 |
 |
| Module-wise count rates for Quadrant B Data is divided into 100 sec bins |
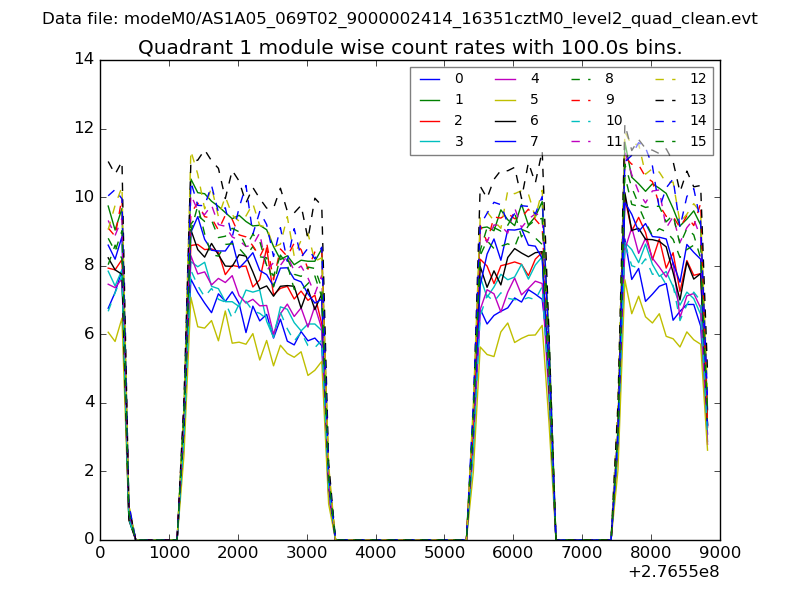 |
 |
| Module-wise count rates for Quadrant C Data is divided into 100 sec bins |
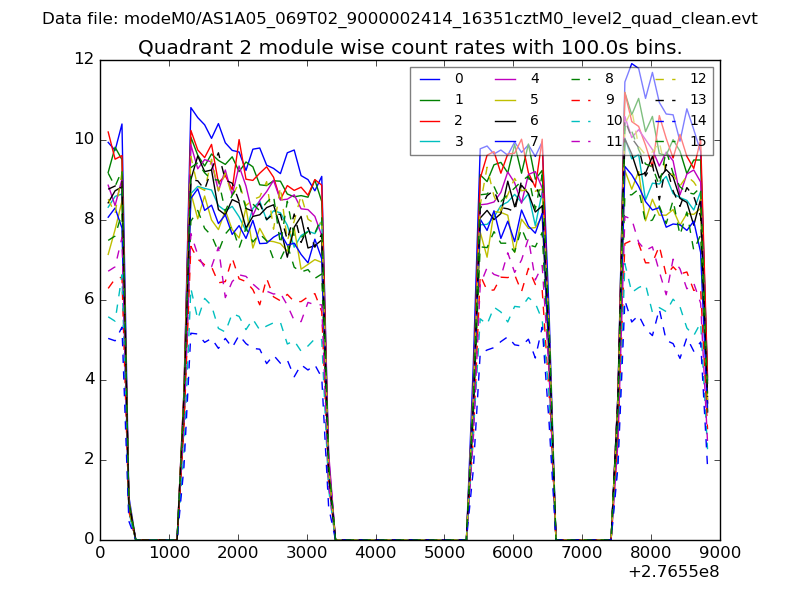 |
 |
| Module-wise count rates for Quadrant D Data is divided into 100 sec bins |
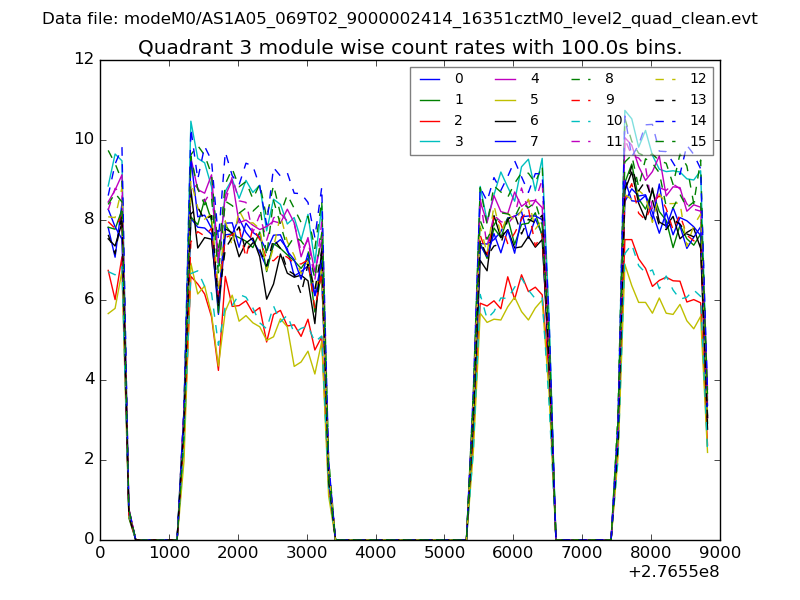 |
 |
| Parameter | Plot |
|---|---|
| CZT HV Monitor | 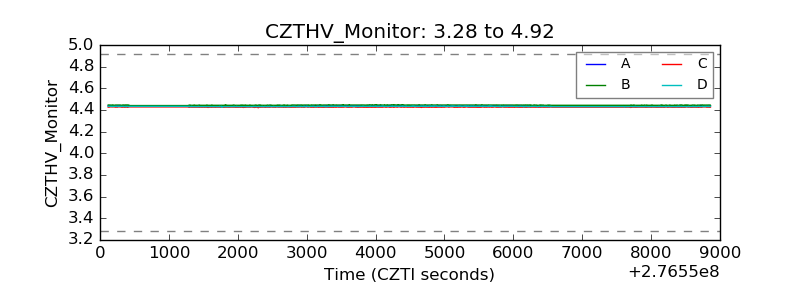 |
| D_VDD | 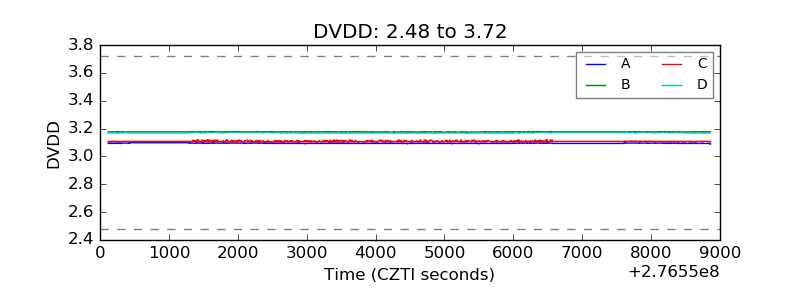 |
| Temperature 1 | 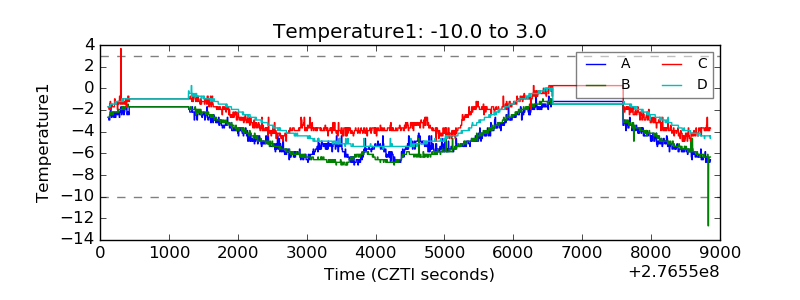 |
| Veto HV Monitor | 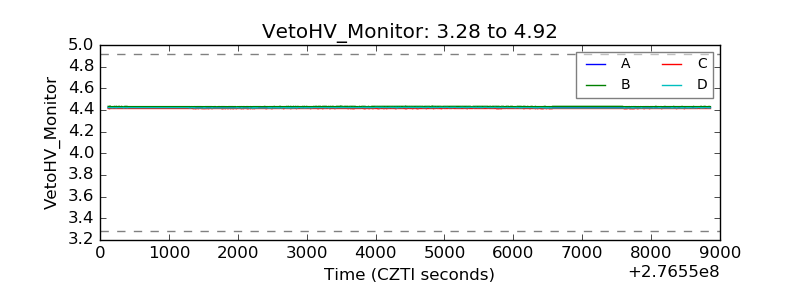 |
| Veto LLD | 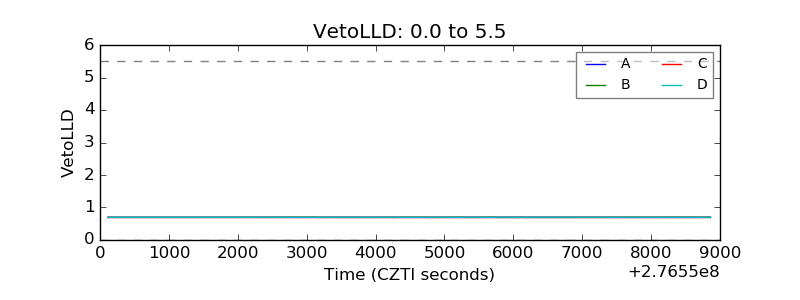 |
| Alpha Counter | 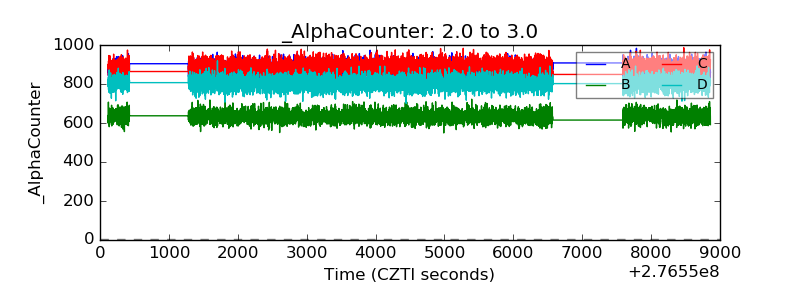 |
| _CPM_Rate | 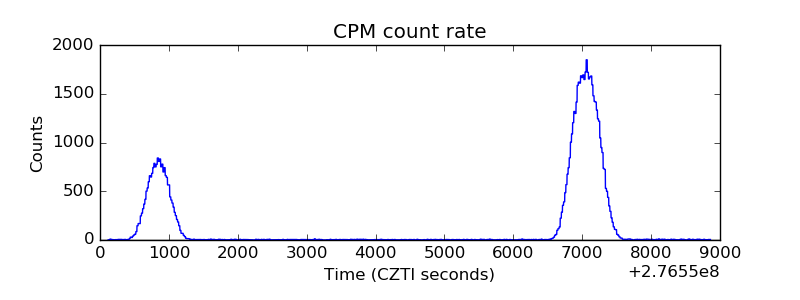 |
| CZT Counter | 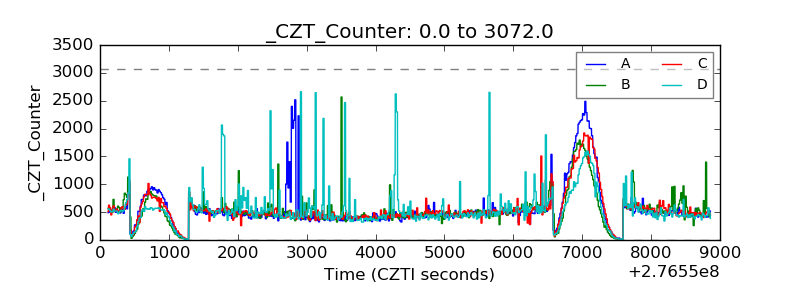 |
| +2.5 Volts monitor |  |
| +5 Volts monitor |  |
| _ROLL_ROT | 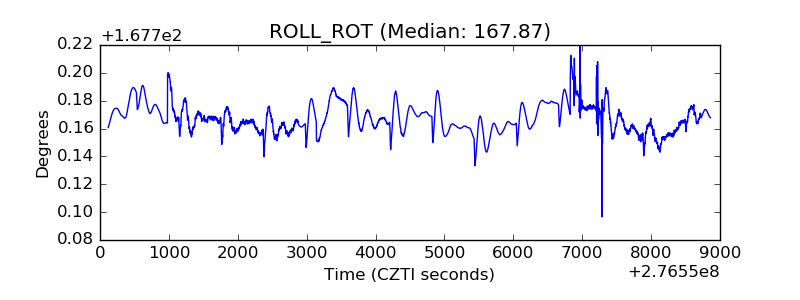 |
| _Roll_DEC | 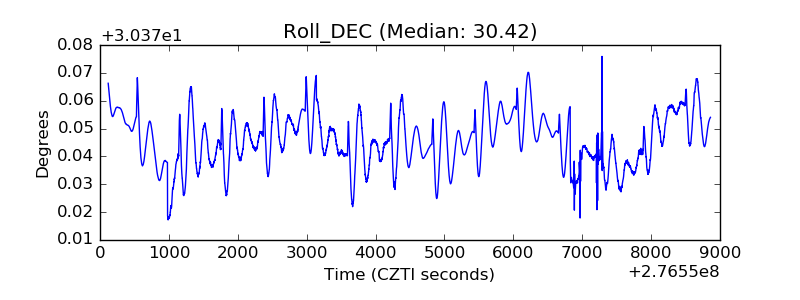 |
| _Roll_RA |  |
| Veto Counter | 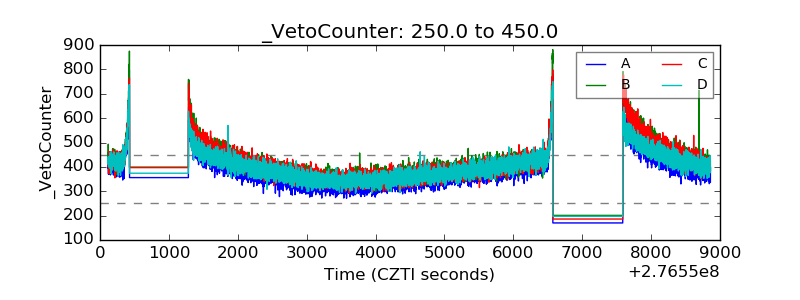 |