| Param | Original file | Final file |
|---|---|---|
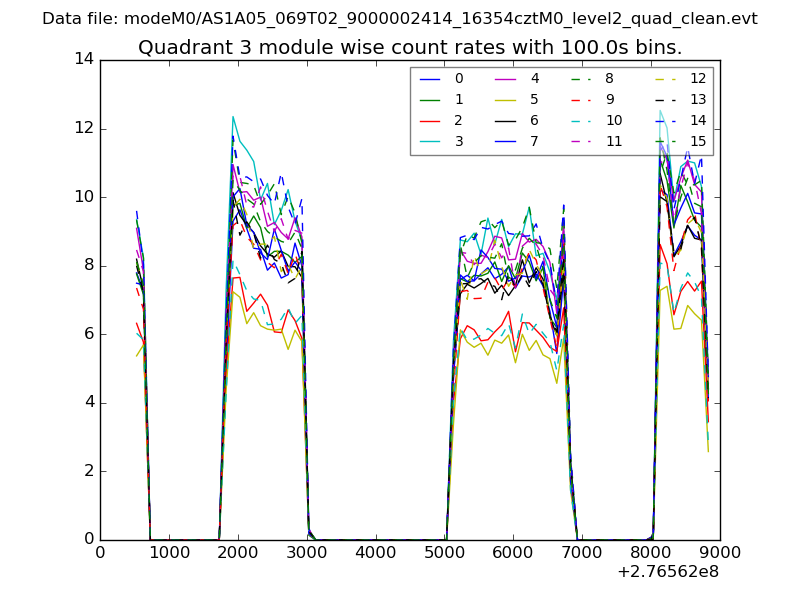
| Filename | modeM0/AS1A05_069T02_9000002414_16354cztM0_level2.evt | modeM0/AS1A05_069T02_9000002414_16354cztM0_level2_quad_clean.evt |
| Size (bytes) | 490,985,280 | 86,898,240 |
| Size | 468.2 MB | 82.9 MB |
| Events in quadrant A | 3,164,407 | 561,774 |
| Events in quadrant B | 3,519,470 | 576,172 |
| Events in quadrant C | 3,228,385 | 543,078 |
| Events in quadrant D | 4,524,386 | 505,369 |
| Mode M0 | |||
|---|---|---|---|
| Quadrant | BADHDUFLAG | Total packets | Discarded packets |
| A | 0 | 13376 | 3 |
| B | 0 | 14464 | 2 |
| C | 0 | 13507 | 2 |
| D | 0 | 17794 | 2 |
| Mode M9 | |||
|---|---|---|---|
| Quadrant | BADHDUFLAG | Total packets | Discarded packets |
| A | 0 | 24 | 0 |
| B | 0 | 24 | 0 |
| C | 0 | 24 | 0 |
| D | 0 | 24 | 0 |
| Mode SS | |||
|---|---|---|---|
| Quadrant | BADHDUFLAG | Total packets | Discarded packets |
| A | 0 | 132 | 0 |
| B | 0 | 132 | 0 |
| C | 0 | 132 | 0 |
| D | 0 | 132 | 0 |
| Quadrant | Total seconds | Saturated seconds | Saturation percentage |
|---|---|---|---|
| A | 6378 | 26 | 0.407651% |
| B | 6378 | 70 | 1.097523% |
| C | 6378 | 59 | 0.925055% |
| D | 6378 | 276 | 4.327375% |
Noise dominated data is calculated using 1-second bins in cleaned event files. If a bin has >2000 counts, and if more than 50% of those come from <1% of pixels, then it is considered to be noise-dominated and hence unusable.
| Quadrant | # 1 sec bins | Bins with >0 counts | Bins with >2000 counts | High rate bins dominated by noise | Noise dominated (total time) | Noise dominated (detector-on time) | Marked lightcurve |
|---|---|---|---|---|---|---|---|
| A | 8809 | 6381 | 0 | 0 | 0.00% | 0.00% | 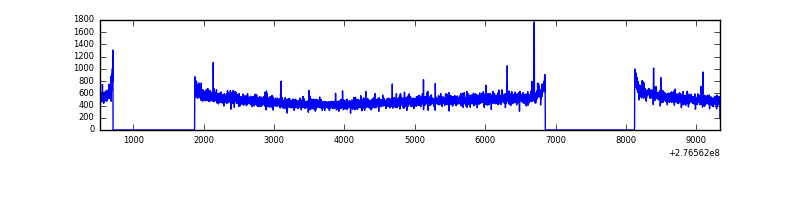 |
| B | 8809 | 6381 | 8 | 8 | 0.09% | 0.13% | 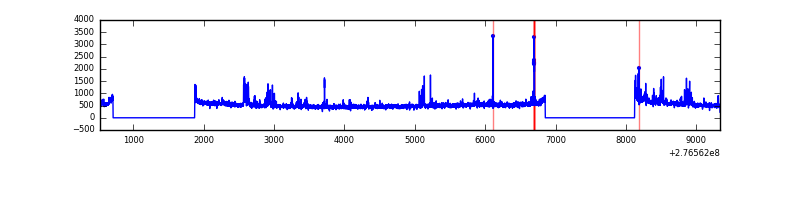 |
| C | 8809 | 6381 | 0 | 0 | 0.00% | 0.00% | 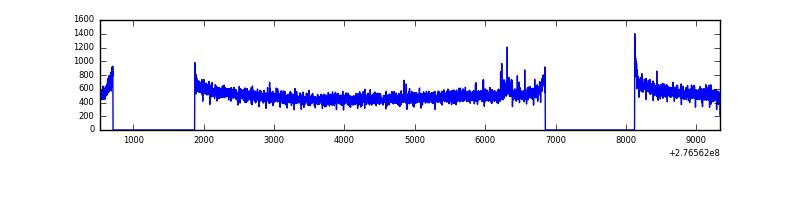 |
| D | 8809 | 6381 | 225 | 225 | 2.55% | 3.53% | 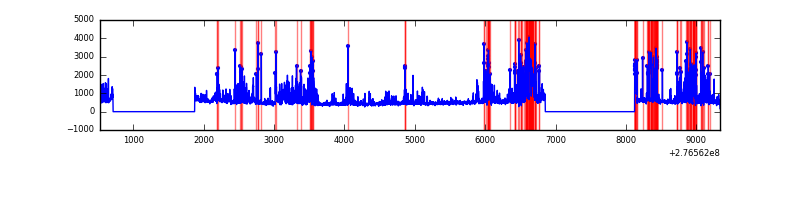 |
Top three noisy pixels from each quadrant. If the there are fewer than three noisy pixels in the level2.evt file, extra rows are filled as -1
| Pixel properties | Quadrant properties | ||||||
|---|---|---|---|---|---|---|---|
| Quadrant | DetID | PixID | Counts | Sigma | Mean | Median | Sigma |
| A | 15 | 174 | 18670 | 109.13 | 814 | 798 | 163.8 |
| A | 15 | 223 | 8648 | 47.93 | 814 | 798 | 163.8 |
| A | 3 | 1 | 8167 | 45.0 | 814 | 798 | 163.8 |
| B | 15 | 35 | 128185 | 826.52 | 823 | 803 | 154.1 |
| B | 0 | 189 | 44431 | 283.08 | 823 | 803 | 154.1 |
| B | 0 | 219 | 37832 | 240.26 | 823 | 803 | 154.1 |
| C | 14 | 238 | 122906 | 673.03 | 785 | 792 | 181.4 |
| C | 3 | 233 | 30999 | 166.49 | 785 | 792 | 181.4 |
| C | 0 | 207 | 9499 | 47.99 | 785 | 792 | 181.4 |
| D | 12 | 218 | 1119406 | 5959.82 | 769 | 748 | 187.7 |
| D | 1 | 52 | 371426 | 1974.84 | 769 | 748 | 187.7 |
| D | 12 | 250 | 34691 | 180.84 | 769 | 748 | 187.7 |
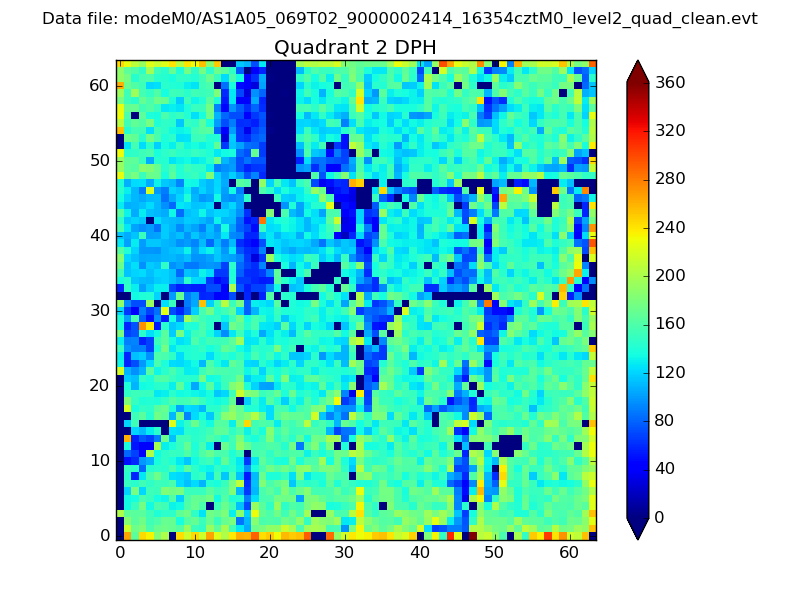
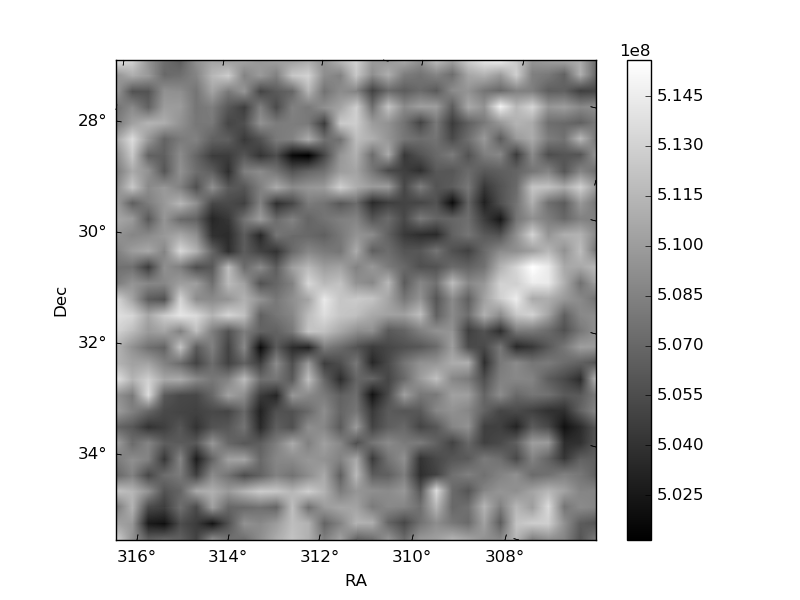
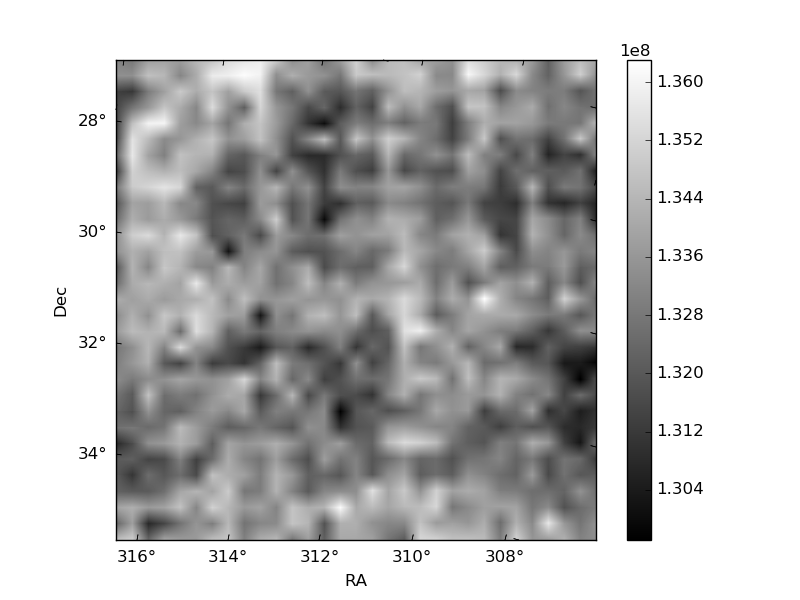
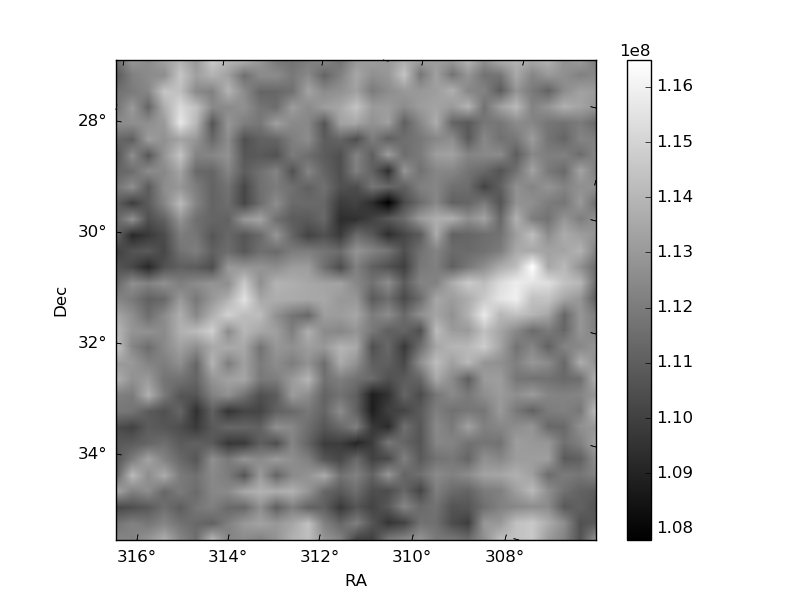
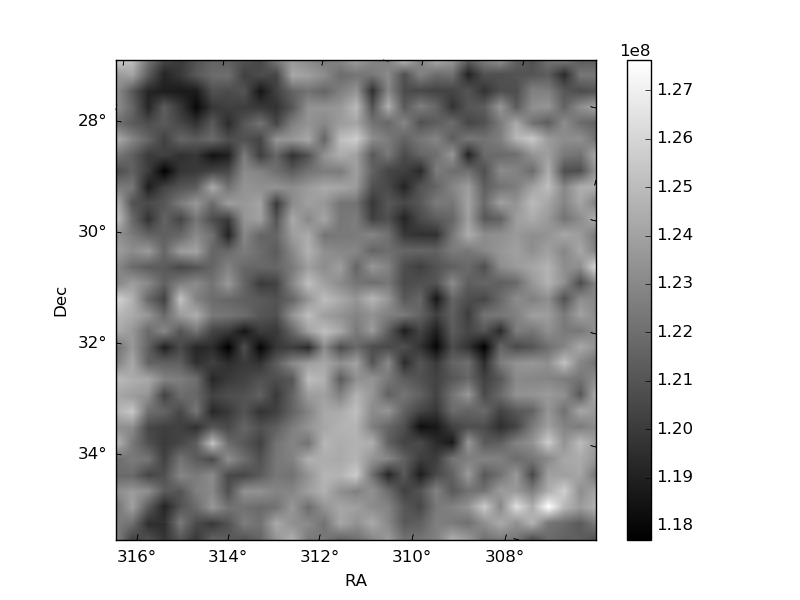
Histogram calculated using DETX and DETY for each event in the final _common_clean file
| Quadrant A | 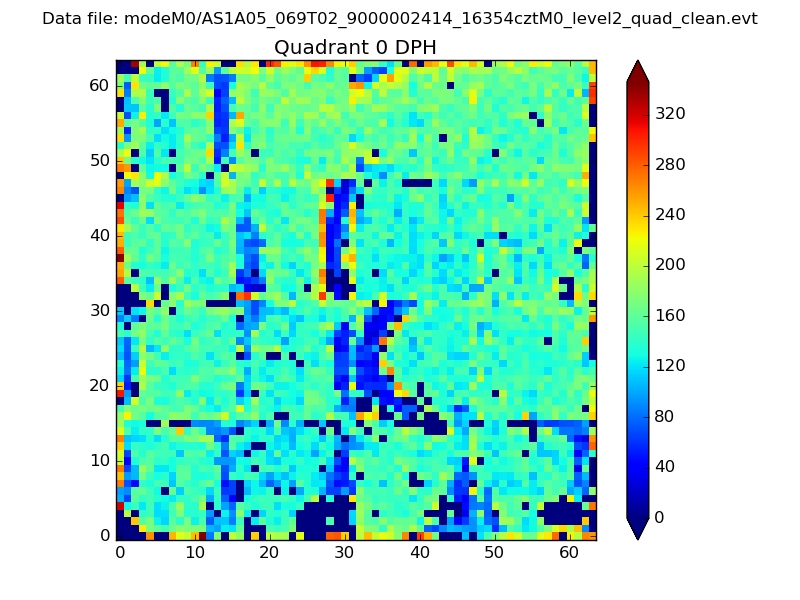 |
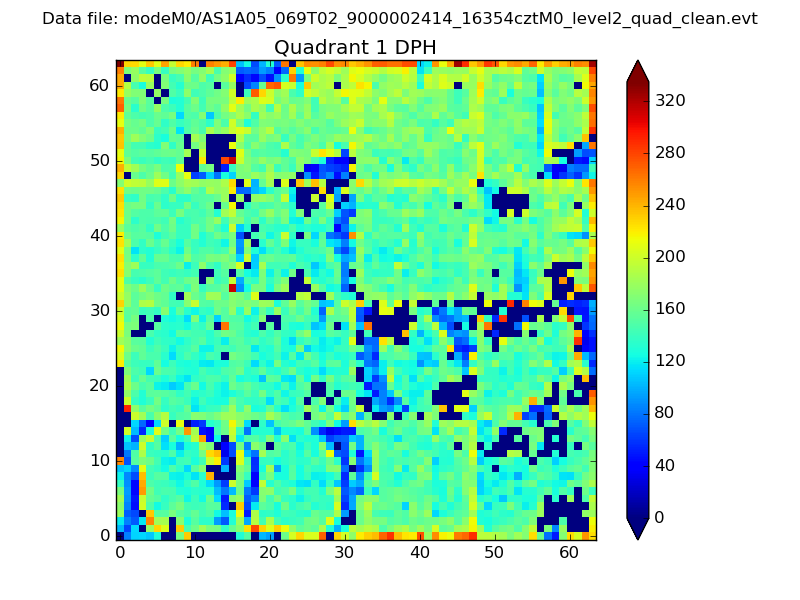 |
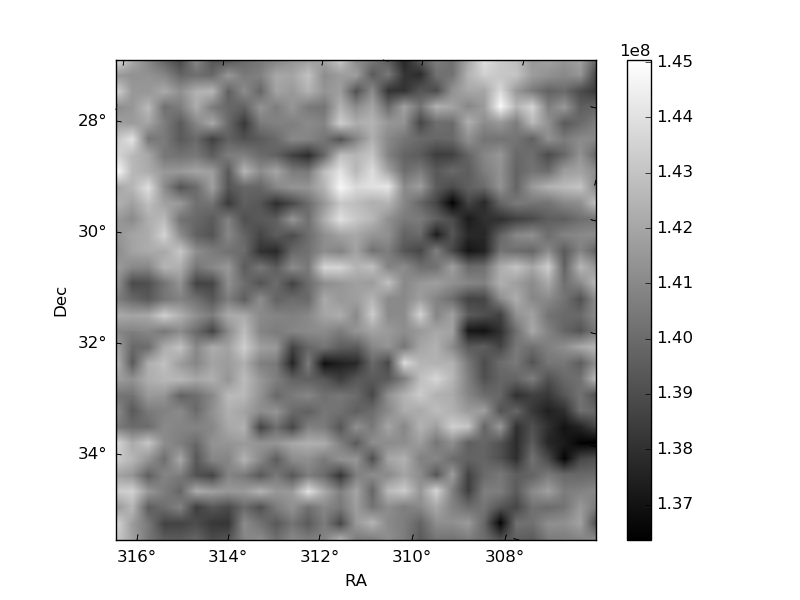
Quadrant B |
|---|---|---|---|
| Quadrant D | 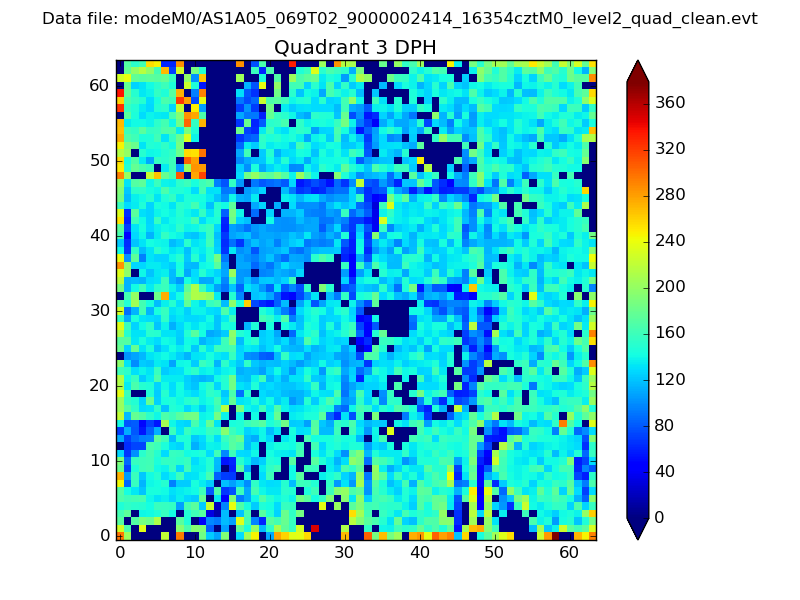 |
 |
Quadrant C |
| Plot type | Count rate plots | Images |
|---|---|---|
| Comparison with Poisson distribution Blue bars denote a histogram of data divided into 1 sec bins. Red curve is a Poisson curve with rate = median count rate of data. |
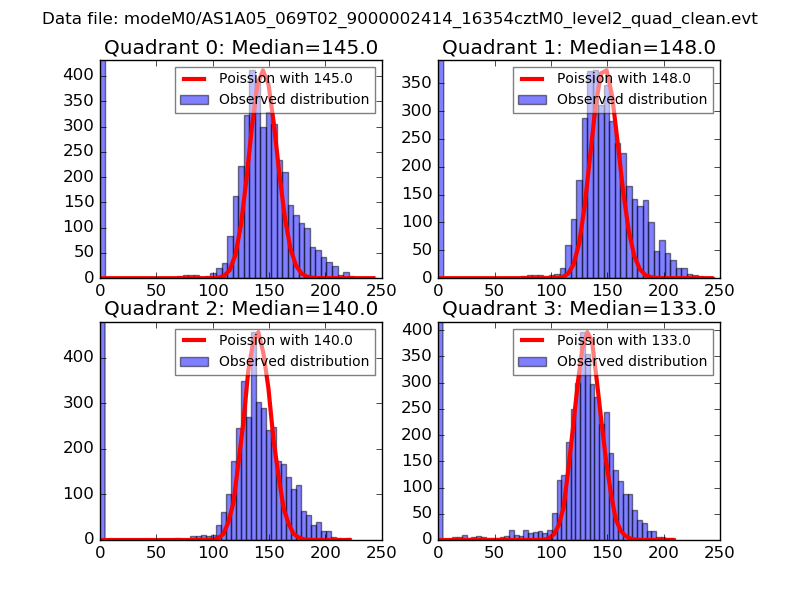 |
 |
| Quadrant-wise count rates Data is divided into 100 sec bins |
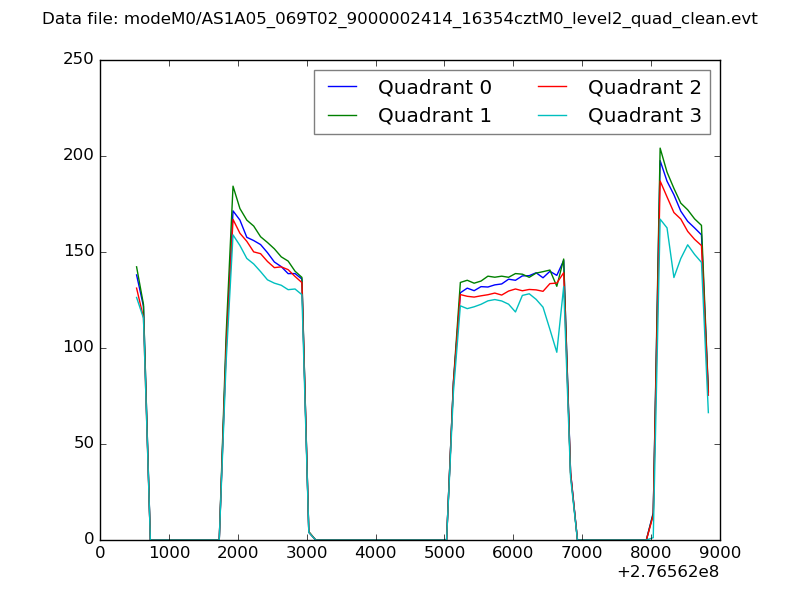 |
|
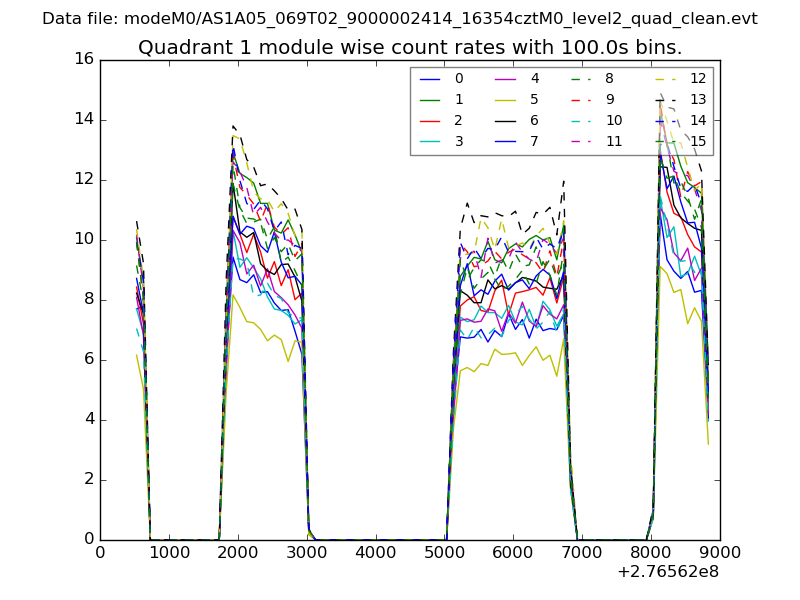
| Module-wise count rates for Quadrant A Data is divided into 100 sec bins |
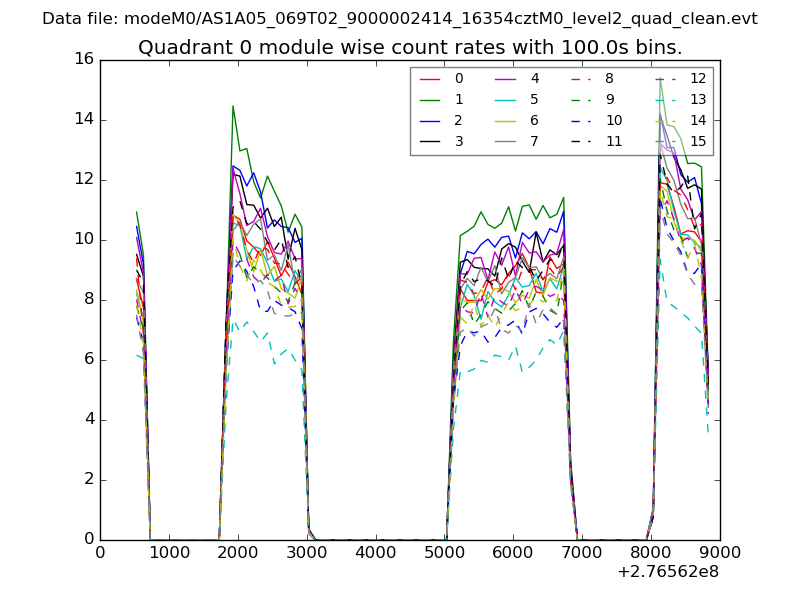 |
 |
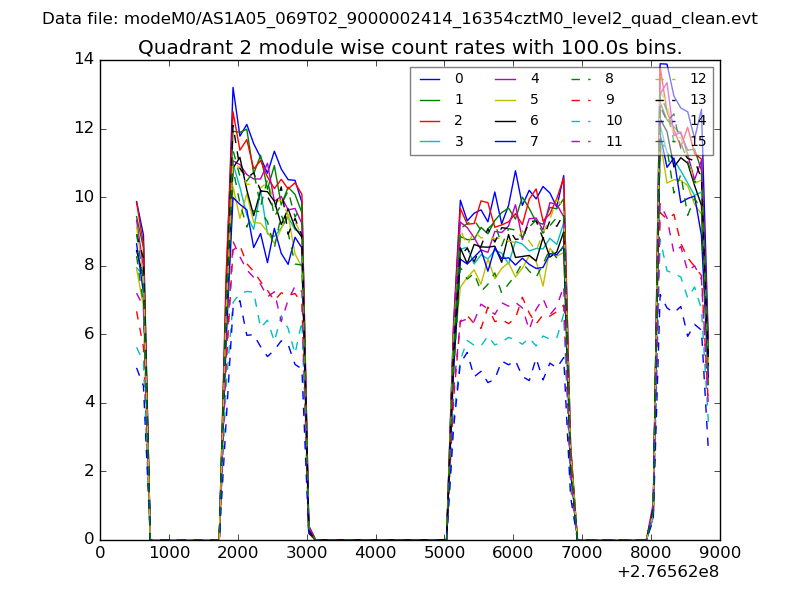
| Module-wise count rates for Quadrant B Data is divided into 100 sec bins |
 |
 |
| Module-wise count rates for Quadrant C Data is divided into 100 sec bins |
 |
 |
| Module-wise count rates for Quadrant D Data is divided into 100 sec bins |
 |
 |
| Parameter | Plot |
|---|---|
| CZT HV Monitor | 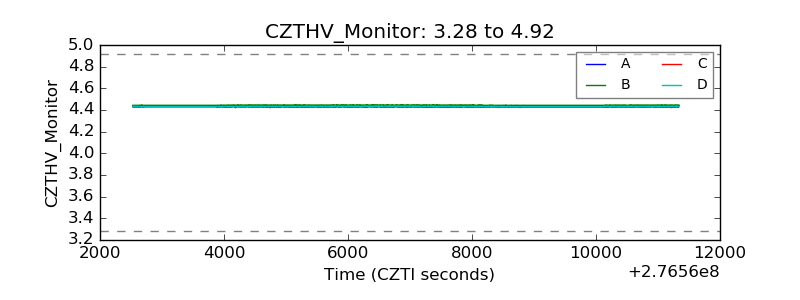 |
| D_VDD | 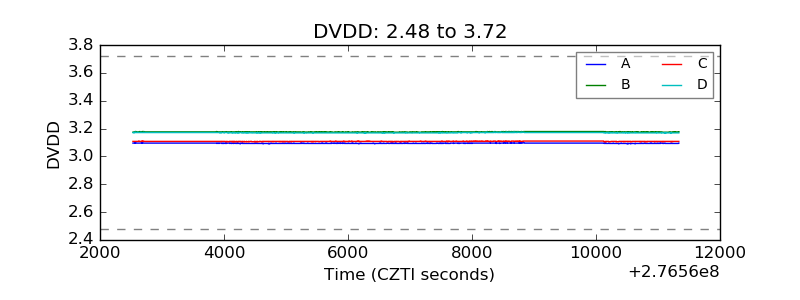 |
| Temperature 1 | 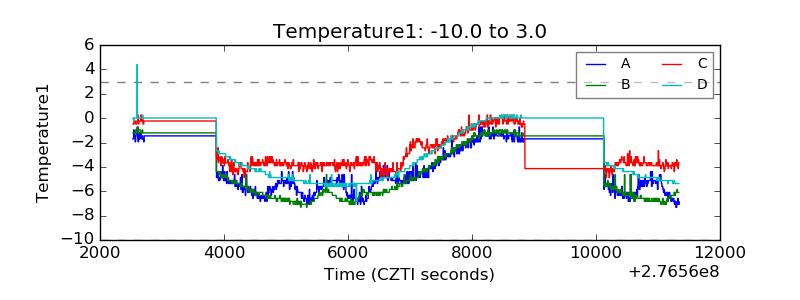 |
| Veto HV Monitor | 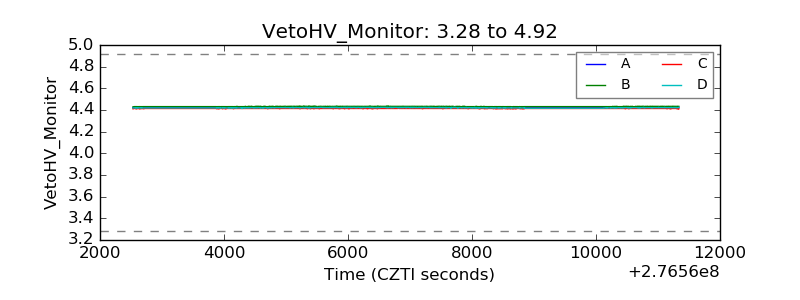 |
| Veto LLD | 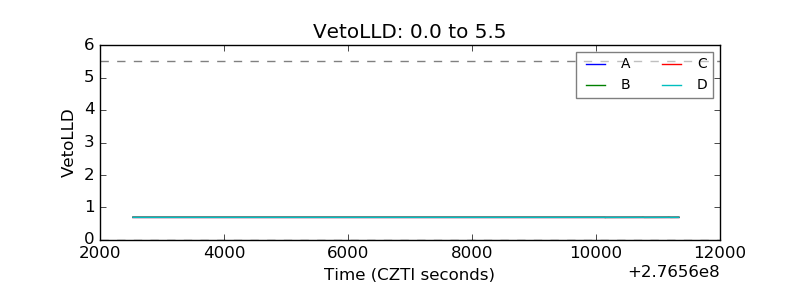 |
| Alpha Counter | 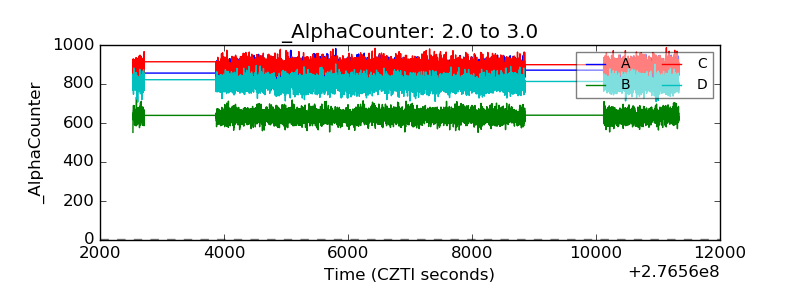 |
| _CPM_Rate | 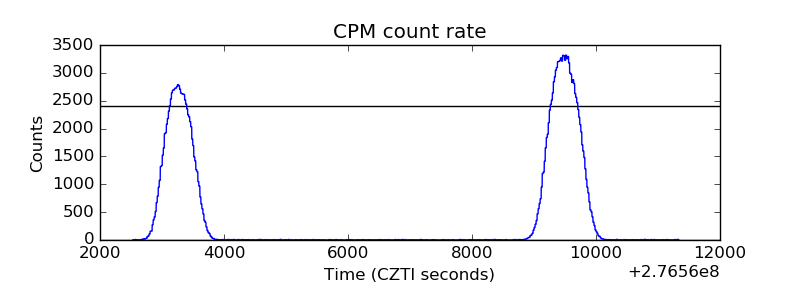 |
| CZT Counter | 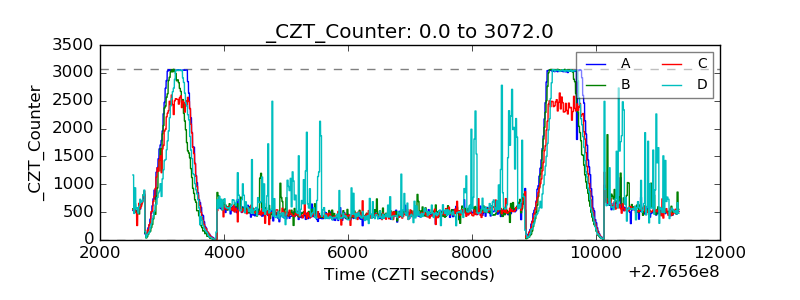 |
| +2.5 Volts monitor |  |
| +5 Volts monitor | 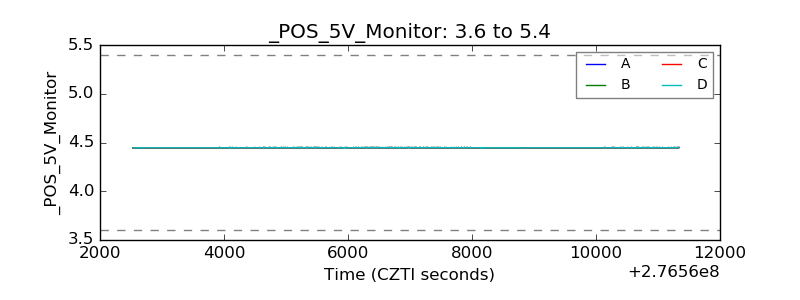 |
| _ROLL_ROT | 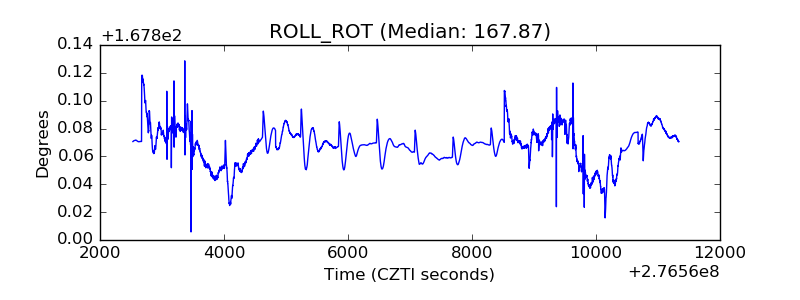 |
| _Roll_DEC | 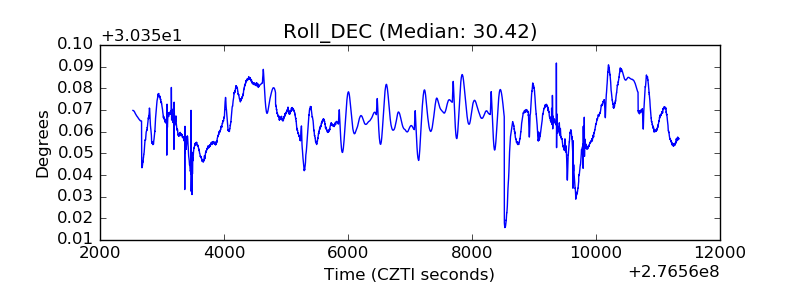 |
| _Roll_RA | 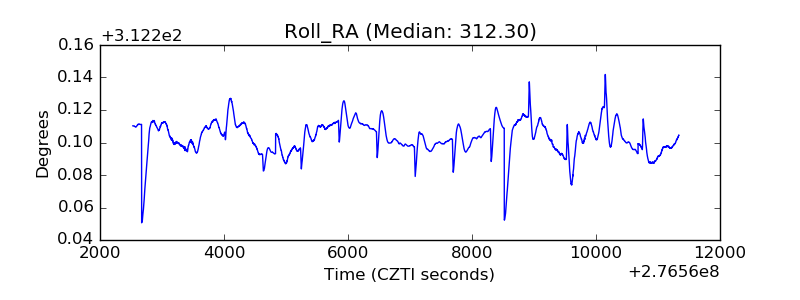 |
| Veto Counter | 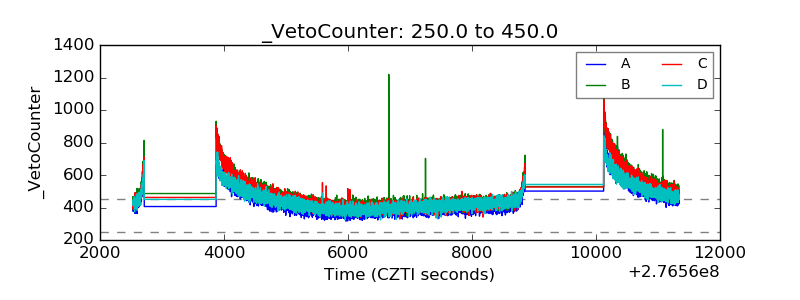 |