| Param | Original file | Final file |
|---|---|---|
| Filename | modeM0/AS1A05_069T02_9000002414_16356cztM0_level2.evt | modeM0/AS1A05_069T02_9000002414_16356cztM0_level2_quad_clean.evt |
| Size (bytes) | 470,796,480 | 65,468,160 |
| Size | 449.0 MB | 62.4 MB |
| Events in quadrant A | 3,306,548 | 393,187 |
| Events in quadrant B | 3,577,395 | 403,391 |
| Events in quadrant C | 3,453,177 | 375,927 |
| Events in quadrant D | 3,488,136 | 364,659 |
| Mode M0 | |||
|---|---|---|---|
| Quadrant | BADHDUFLAG | Total packets | Discarded packets |
| A | 0 | 13470 | 2 |
| B | 0 | 14364 | 1 |
| C | 0 | 13929 | 1 |
| D | 0 | 14416 | 1 |
| Mode M9 | |||
|---|---|---|---|
| Quadrant | BADHDUFLAG | Total packets | Discarded packets |
| A | 0 | 14 | 0 |
| B | 0 | 14 | 0 |
| C | 0 | 14 | 0 |
| D | 0 | 14 | 0 |
| Mode SS | |||
|---|---|---|---|
| Quadrant | BADHDUFLAG | Total packets | Discarded packets |
| A | 0 | 128 | 0 |
| B | 0 | 128 | 0 |
| C | 0 | 128 | 0 |
| D | 0 | 128 | 0 |
| Quadrant | Total seconds | Saturated seconds | Saturation percentage |
|---|---|---|---|
| A | 6382 | 57 | 0.893137% |
| B | 6382 | 95 | 1.488562% |
| C | 6382 | 92 | 1.441554% |
| D | 6382 | 50 | 0.783453% |
Noise dominated data is calculated using 1-second bins in cleaned event files. If a bin has >2000 counts, and if more than 50% of those come from <1% of pixels, then it is considered to be noise-dominated and hence unusable.
| Quadrant | # 1 sec bins | Bins with >0 counts | Bins with >2000 counts | High rate bins dominated by noise | Noise dominated (total time) | Noise dominated (detector-on time) | Marked lightcurve |
|---|---|---|---|---|---|---|---|
| A | 7748 | 6384 | 0 | 0 | 0.00% | 0.00% | 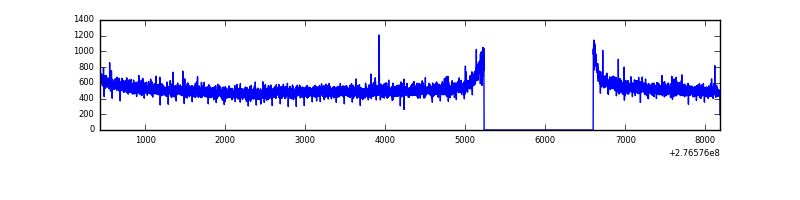 |
| B | 7748 | 6384 | 17 | 17 | 0.22% | 0.27% | 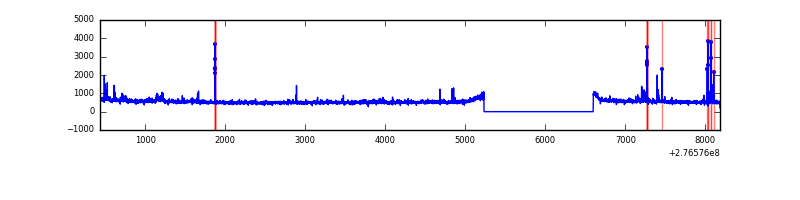 |
| C | 7748 | 6384 | 2 | 2 | 0.03% | 0.03% | 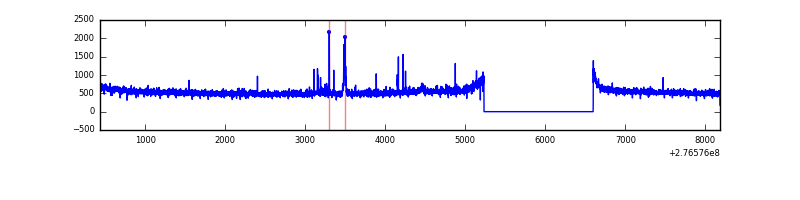 |
| D | 7748 | 6384 | 22 | 22 | 0.28% | 0.34% | 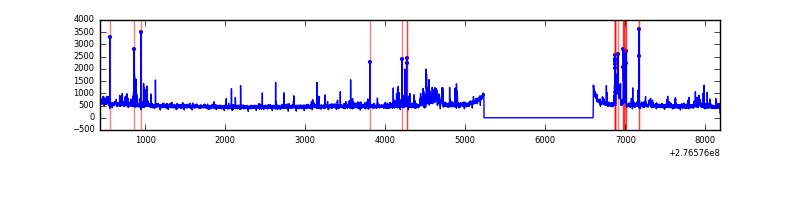 |
Top three noisy pixels from each quadrant. If the there are fewer than three noisy pixels in the level2.evt file, extra rows are filled as -1
| Pixel properties | Quadrant properties | ||||||
|---|---|---|---|---|---|---|---|
| Quadrant | DetID | PixID | Counts | Sigma | Mean | Median | Sigma |
| A | 0 | 226 | 7532 | 39.74 | 857 | 843 | 168.3 |
| A | 12 | 194 | 6294 | 32.38 | 857 | 843 | 168.3 |
| A | 3 | 137 | 5499 | 27.66 | 857 | 843 | 168.3 |
| B | 15 | 35 | 77431 | 481.29 | 861 | 842 | 159.1 |
| B | 4 | 173 | 43314 | 266.9 | 861 | 842 | 159.1 |
| B | 10 | 16 | 31260 | 191.15 | 861 | 842 | 159.1 |
| C | 14 | 238 | 130085 | 691.3 | 814 | 823 | 187.0 |
| C | 3 | 233 | 93505 | 495.67 | 814 | 823 | 187.0 |
| C | 10 | 169 | 45240 | 237.55 | 814 | 823 | 187.0 |
| D | 2 | 122 | 102045 | 512.39 | 817 | 795 | 197.6 |
| D | 1 | 52 | 98415 | 494.02 | 817 | 795 | 197.6 |
| D | 12 | 218 | 69995 | 350.19 | 817 | 795 | 197.6 |
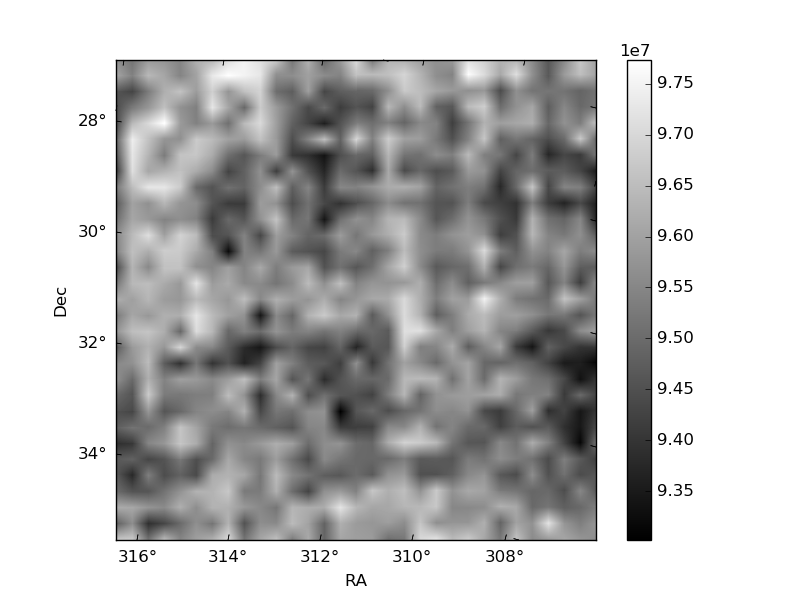
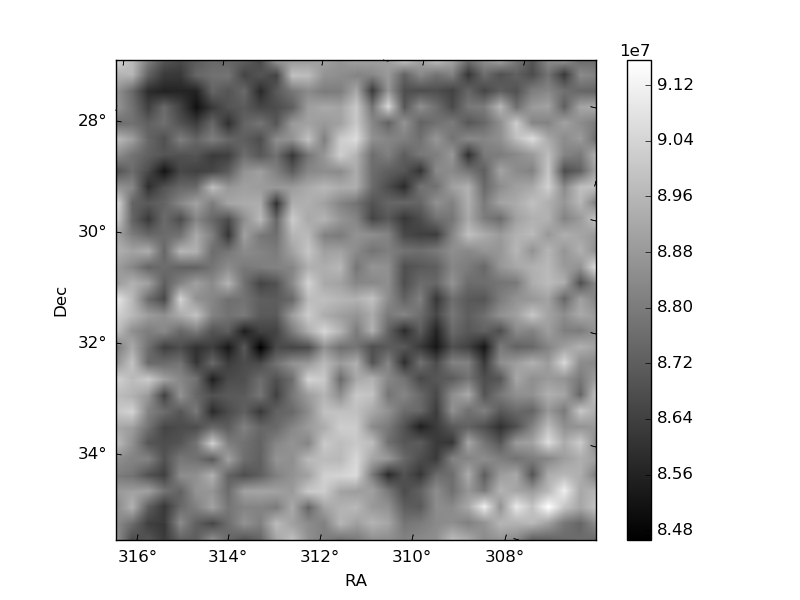
Histogram calculated using DETX and DETY for each event in the final _common_clean file
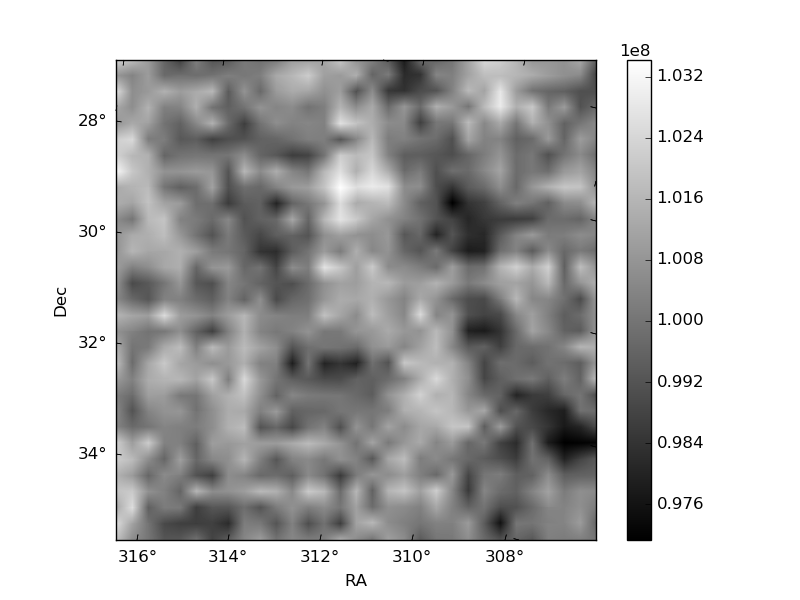
| Quadrant A | 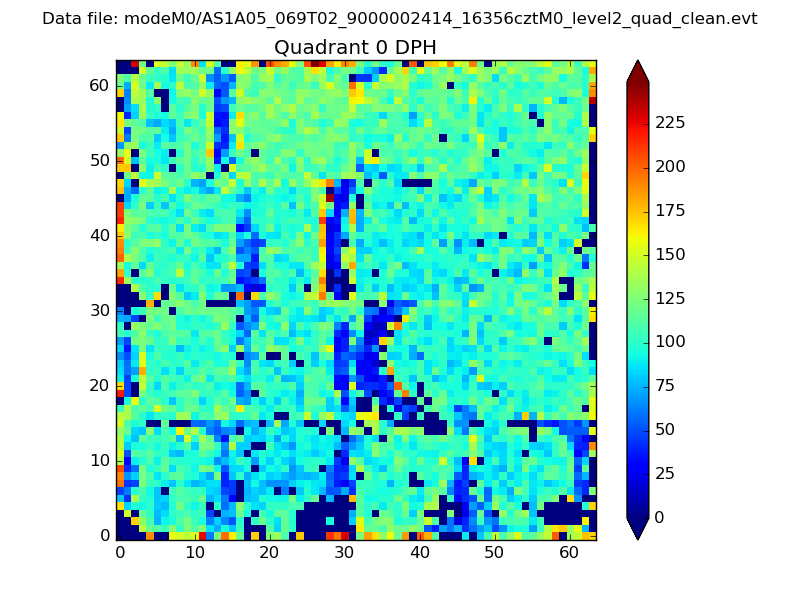 |
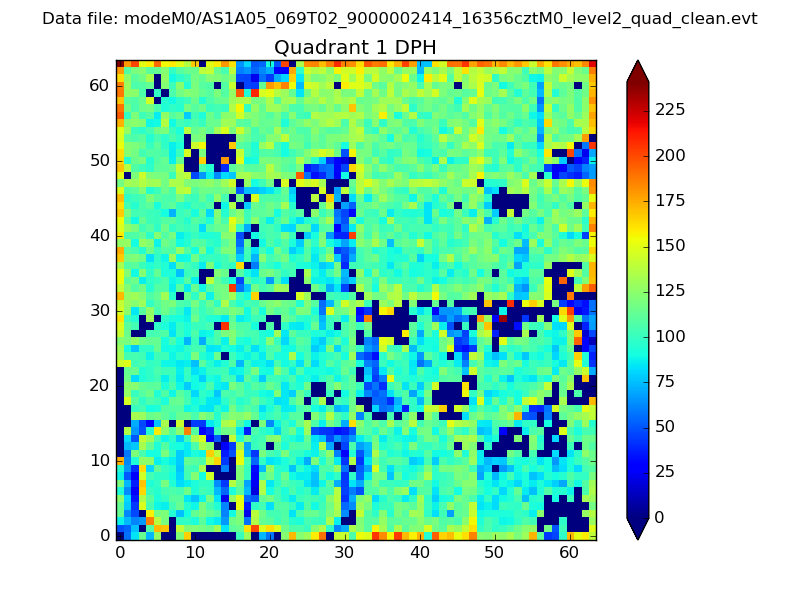 |
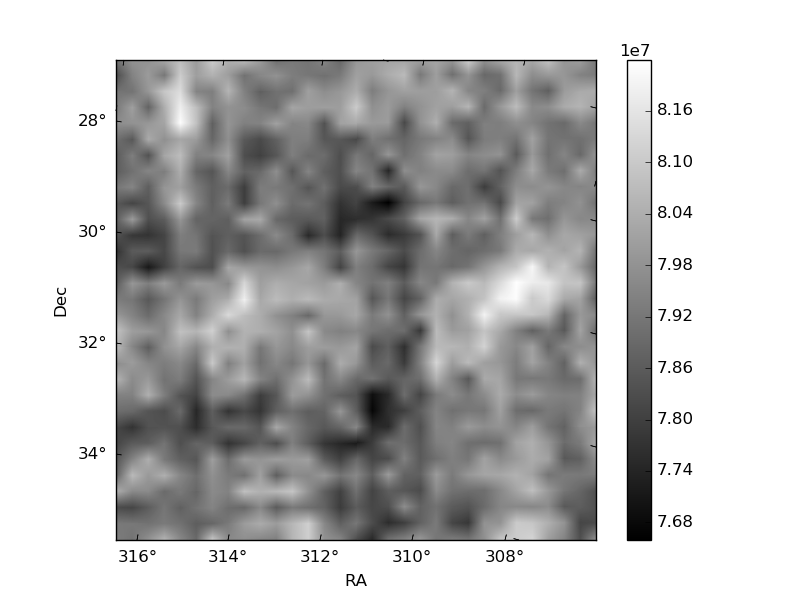
Quadrant B |
|---|---|---|---|
| Quadrant D | 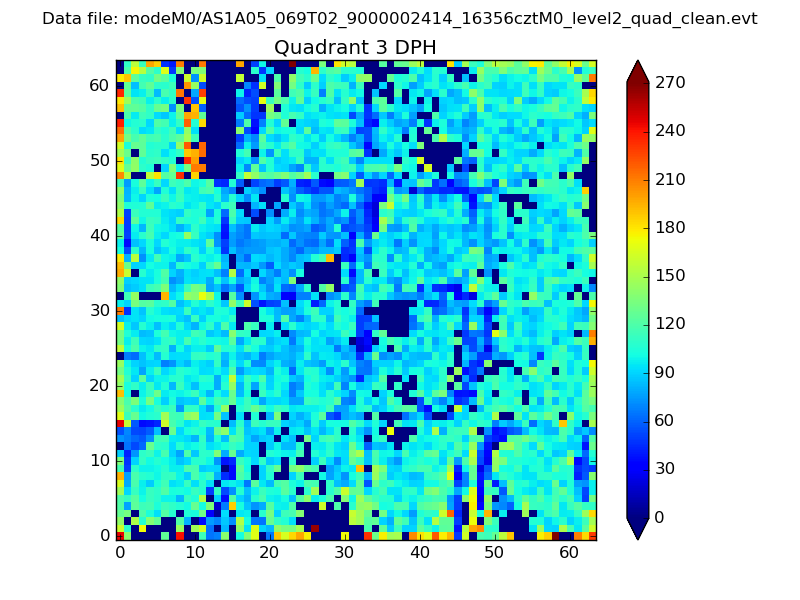 |
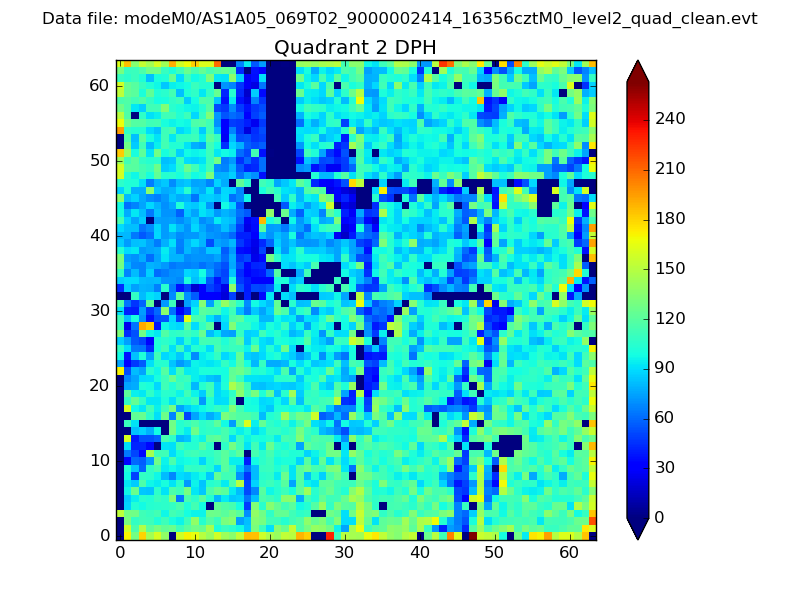 |
Quadrant C |
| Plot type | Count rate plots | Images |
|---|---|---|
| Comparison with Poisson distribution Blue bars denote a histogram of data divided into 1 sec bins. Red curve is a Poisson curve with rate = median count rate of data. |
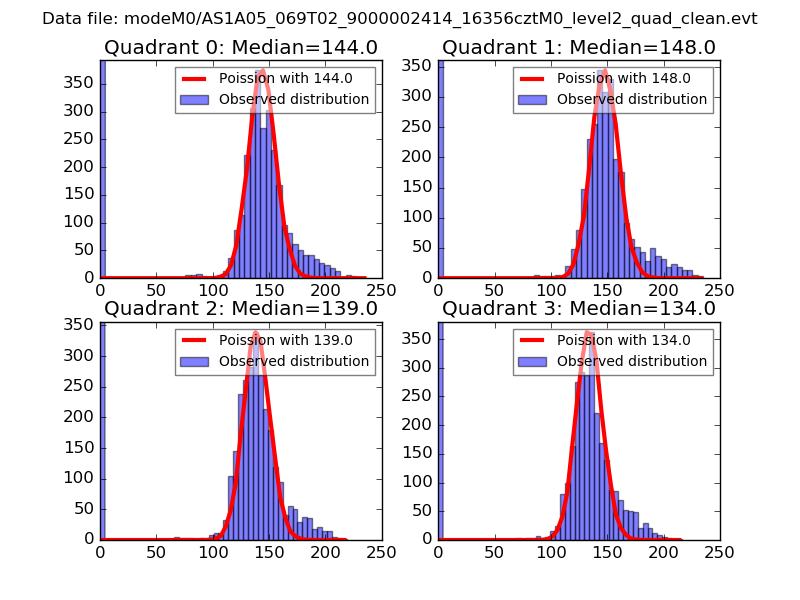 |
 |
| Quadrant-wise count rates Data is divided into 100 sec bins |
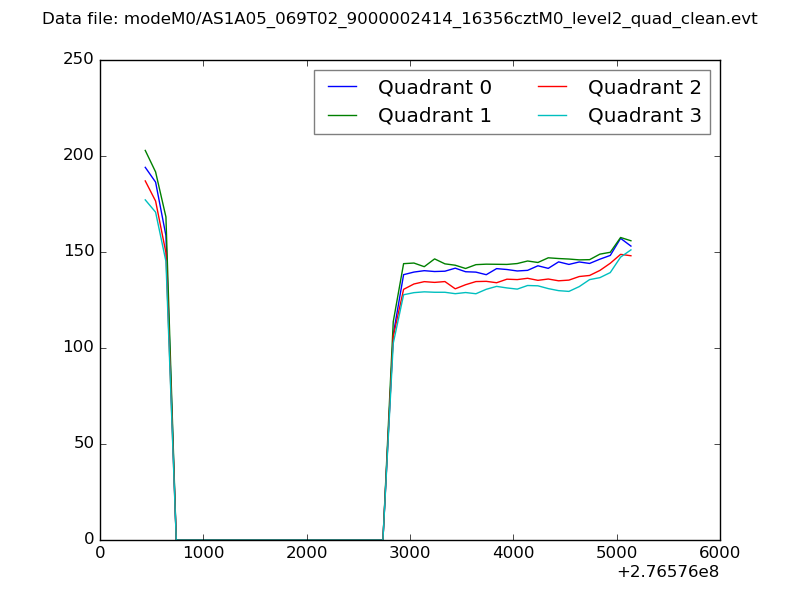 |
|
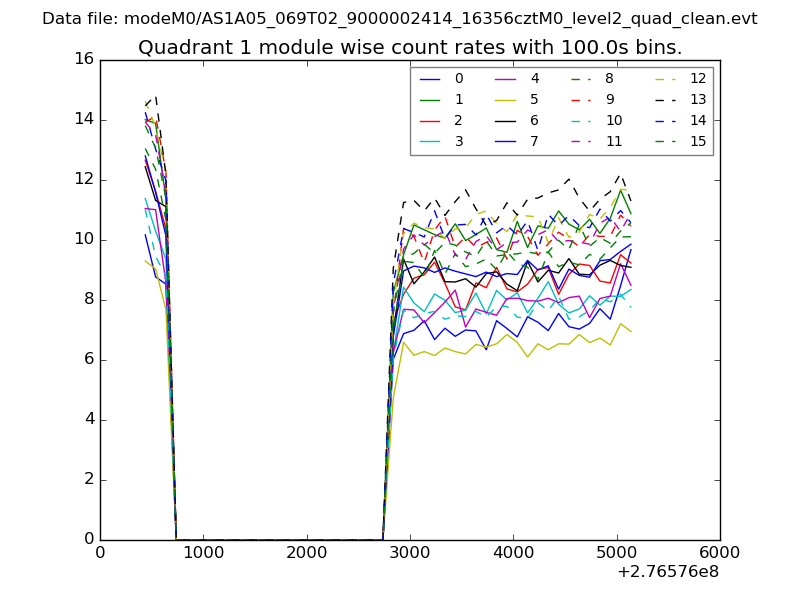
| Module-wise count rates for Quadrant A Data is divided into 100 sec bins |
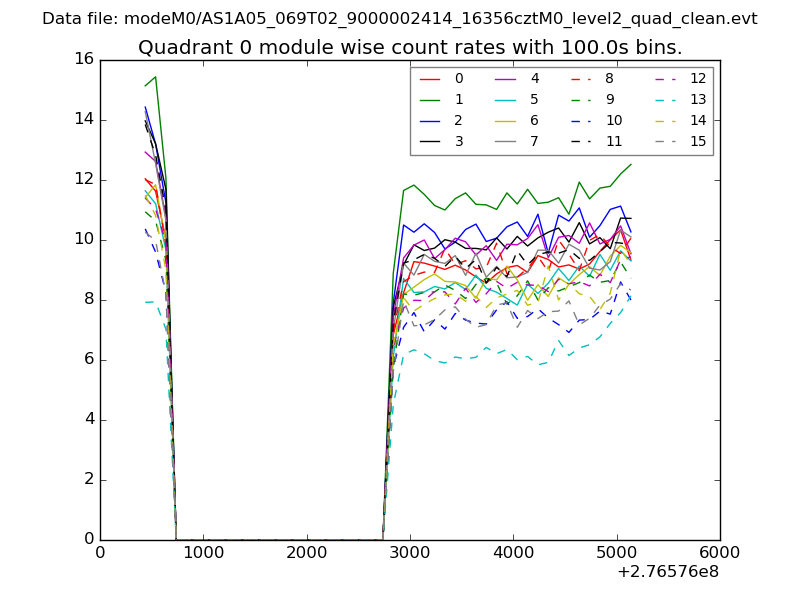 |
 |
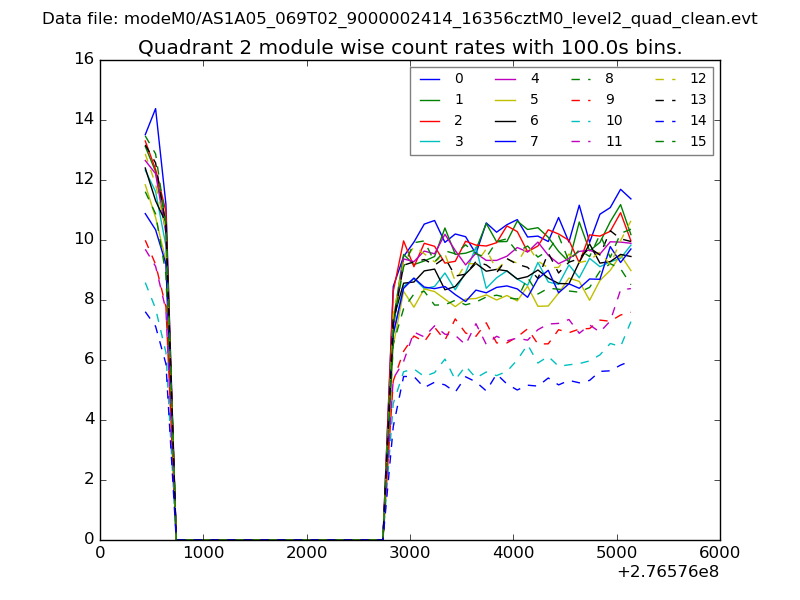
| Module-wise count rates for Quadrant B Data is divided into 100 sec bins |
 |
 |
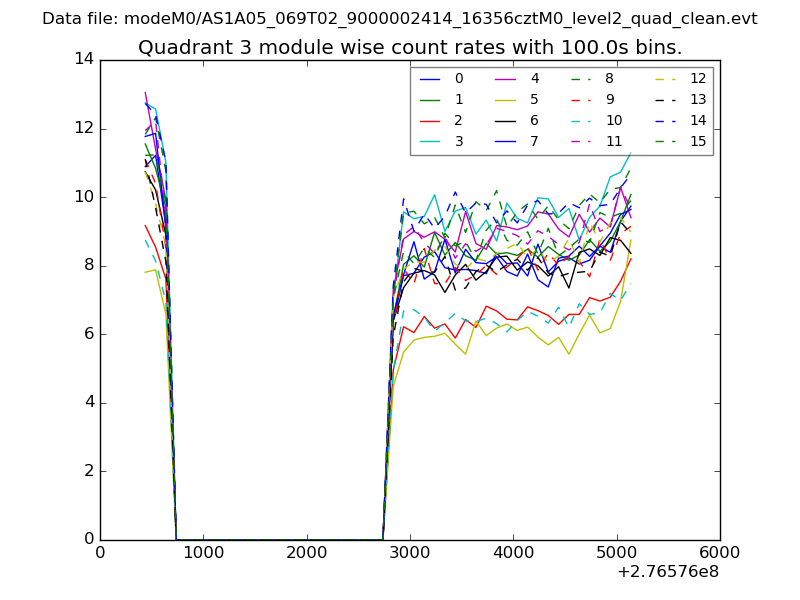
| Module-wise count rates for Quadrant C Data is divided into 100 sec bins |
 |
 |
| Module-wise count rates for Quadrant D Data is divided into 100 sec bins |
 |
 |
| Parameter | Plot |
|---|---|
| CZT HV Monitor | 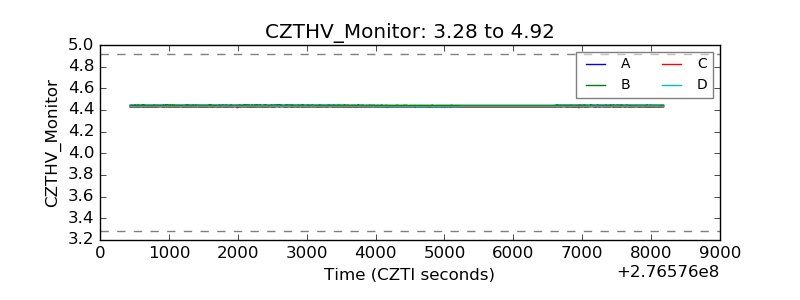 |
| D_VDD |  |
| Temperature 1 | 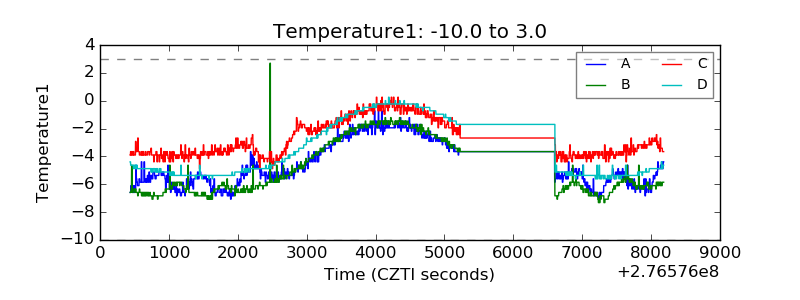 |
| Veto HV Monitor | 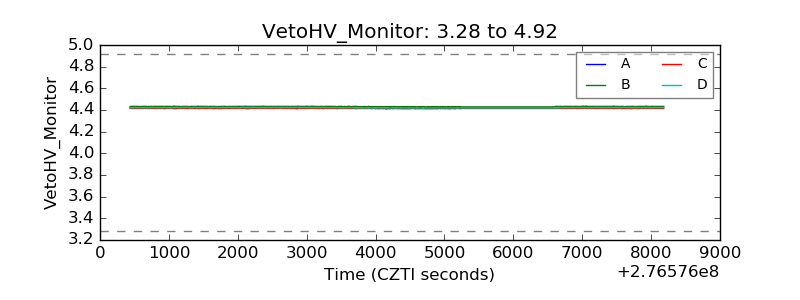 |
| Veto LLD | 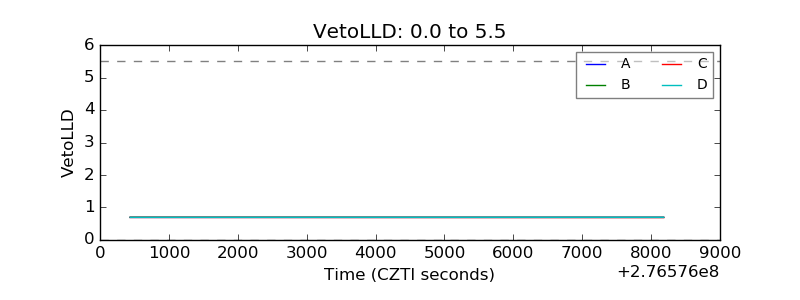 |
| Alpha Counter | 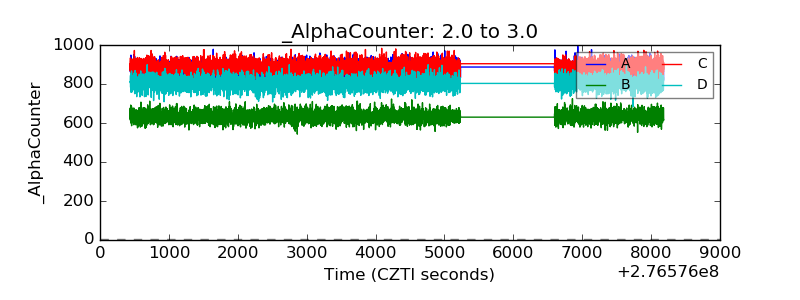 |
| _CPM_Rate |  |
| CZT Counter | 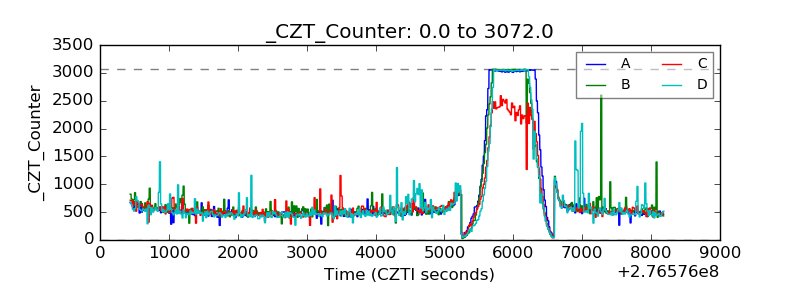 |
| +2.5 Volts monitor |  |
| +5 Volts monitor |  |
| _ROLL_ROT | 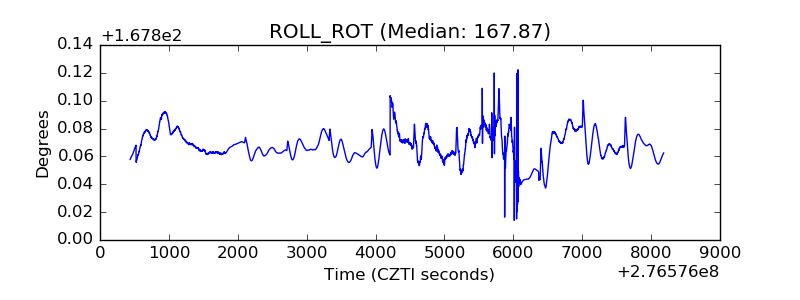 |
| _Roll_DEC | 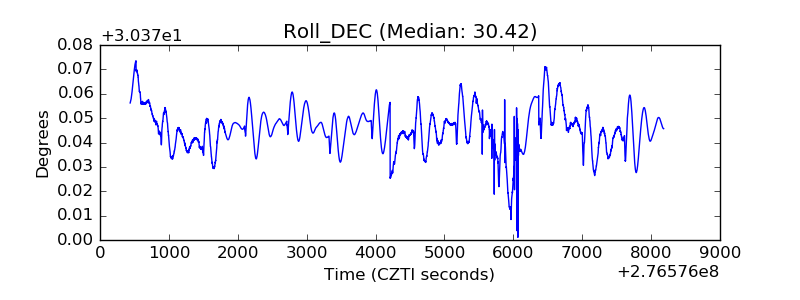 |
| _Roll_RA |  |
| Veto Counter | 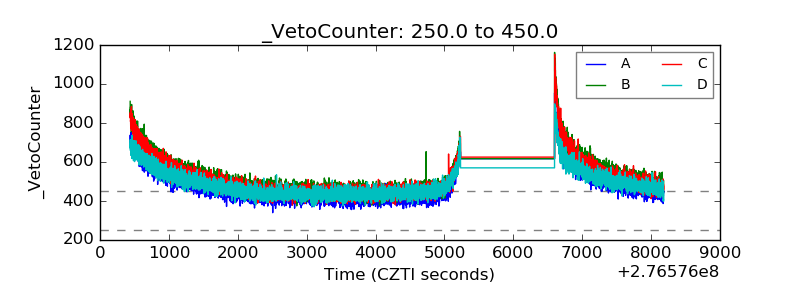 |