| Param | Original file | Final file |
|---|---|---|
| Filename | modeM0/AS1A05_069T02_9000002414_16357cztM0_level2.evt | modeM0/AS1A05_069T02_9000002414_16357cztM0_level2_quad_clean.evt |
| Size (bytes) | 329,708,160 | 55,601,280 |
| Size | 314.4 MB | 53.0 MB |
| Events in quadrant A | 2,248,246 | 351,372 |
| Events in quadrant B | 2,410,815 | 360,053 |
| Events in quadrant C | 2,398,270 | 335,042 |
| Events in quadrant D | 2,622,225 | 321,487 |
| Mode M0 | |||
|---|---|---|---|
| Quadrant | BADHDUFLAG | Total packets | Discarded packets |
| A | 0 | 9217 | 0 |
| B | 0 | 9682 | 0 |
| C | 0 | 9693 | 0 |
| D | 0 | 10644 | 0 |
| Mode SS | |||
|---|---|---|---|
| Quadrant | BADHDUFLAG | Total packets | Discarded packets |
| A | 0 | 90 | 0 |
| B | 0 | 90 | 0 |
| C | 0 | 90 | 0 |
| D | 0 | 90 | 0 |
| Quadrant | Total seconds | Saturated seconds | Saturation percentage |
|---|---|---|---|
| A | 4482 | 15 | 0.334672% |
| B | 4482 | 22 | 0.490852% |
| C | 4482 | 19 | 0.423918% |
| D | 4482 | 84 | 1.874163% |
Noise dominated data is calculated using 1-second bins in cleaned event files. If a bin has >2000 counts, and if more than 50% of those come from <1% of pixels, then it is considered to be noise-dominated and hence unusable.
| Quadrant | # 1 sec bins | Bins with >0 counts | Bins with >2000 counts | High rate bins dominated by noise | Noise dominated (total time) | Noise dominated (detector-on time) | Marked lightcurve |
|---|---|---|---|---|---|---|---|
| A | 4483 | 4483 | 6 | 6 | 0.13% | 0.13% | 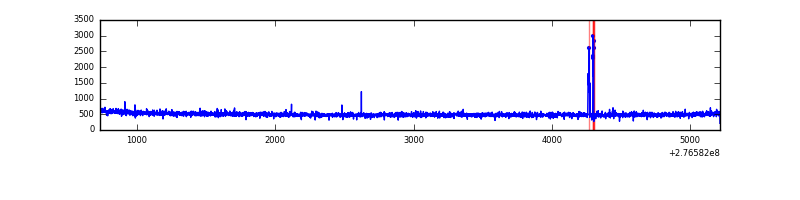 |
| B | 4483 | 4483 | 12 | 12 | 0.27% | 0.27% | 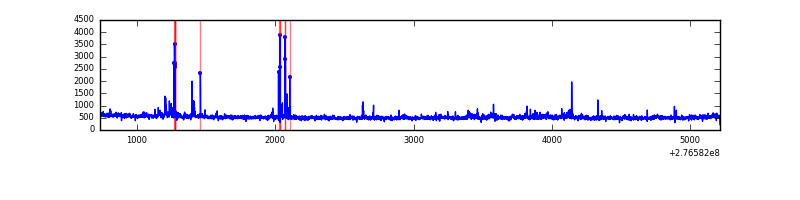 |
| C | 4483 | 4483 | 3 | 3 | 0.07% | 0.07% | 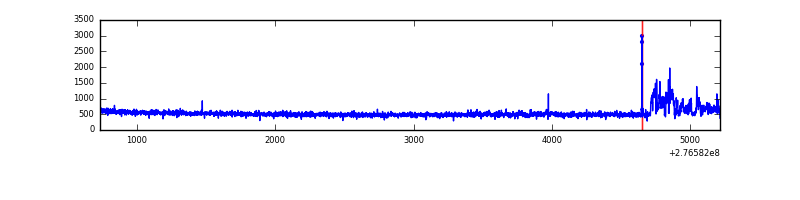 |
| D | 4483 | 4483 | 70 | 70 | 1.56% | 1.56% | 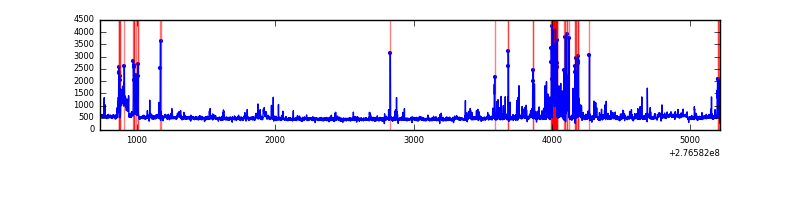 |
Top three noisy pixels from each quadrant. If the there are fewer than three noisy pixels in the level2.evt file, extra rows are filled as -1
| Pixel properties | Quadrant properties | ||||||
|---|---|---|---|---|---|---|---|
| Quadrant | DetID | PixID | Counts | Sigma | Mean | Median | Sigma |
| A | 15 | 174 | 31429 | 268.08 | 576 | 567 | 115.1 |
| A | 0 | 226 | 5042 | 38.87 | 576 | 567 | 115.1 |
| A | 12 | 194 | 4190 | 31.47 | 576 | 567 | 115.1 |
| B | 4 | 173 | 31485 | 286.06 | 575 | 562 | 108.1 |
| B | 10 | 16 | 30755 | 279.31 | 575 | 562 | 108.1 |
| B | 15 | 35 | 25174 | 227.68 | 575 | 562 | 108.1 |
| C | 3 | 233 | 174773 | 1391.6 | 543 | 547 | 125.2 |
| C | 14 | 238 | 87142 | 691.66 | 543 | 547 | 125.2 |
| C | 0 | 207 | 12648 | 96.65 | 543 | 547 | 125.2 |
| D | 12 | 110 | 220621 | 1680.91 | 544 | 528 | 130.9 |
| D | 2 | 122 | 102805 | 781.12 | 544 | 528 | 130.9 |
| D | 10 | 70 | 91364 | 693.74 | 544 | 528 | 130.9 |
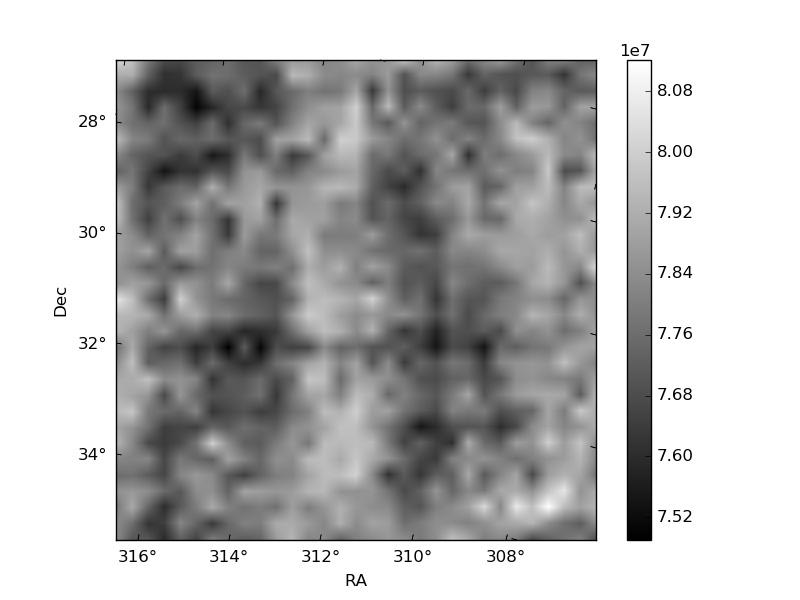
Histogram calculated using DETX and DETY for each event in the final _common_clean file
| Quadrant A | 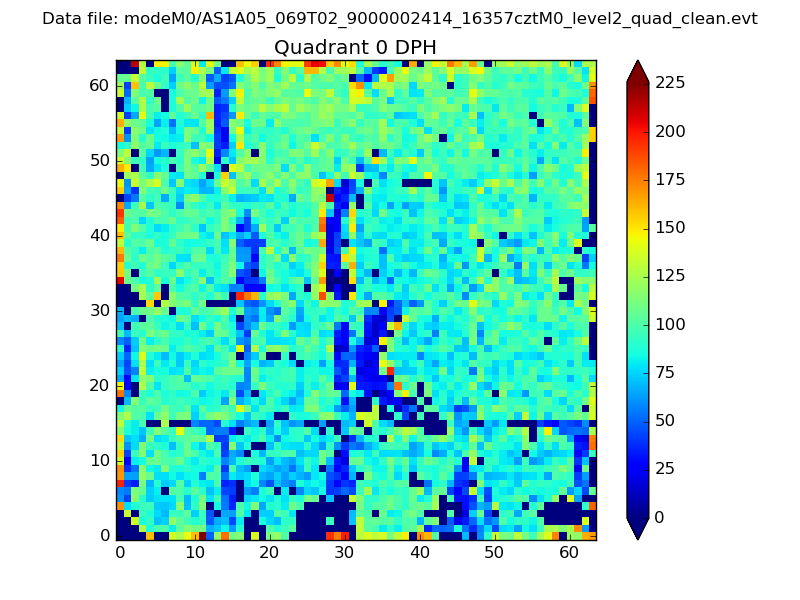 |
 |
Quadrant B |
|---|---|---|---|
| Quadrant D |  |
 |
Quadrant C |
| Plot type | Count rate plots | Images |
|---|---|---|
| Comparison with Poisson distribution Blue bars denote a histogram of data divided into 1 sec bins. Red curve is a Poisson curve with rate = median count rate of data. |
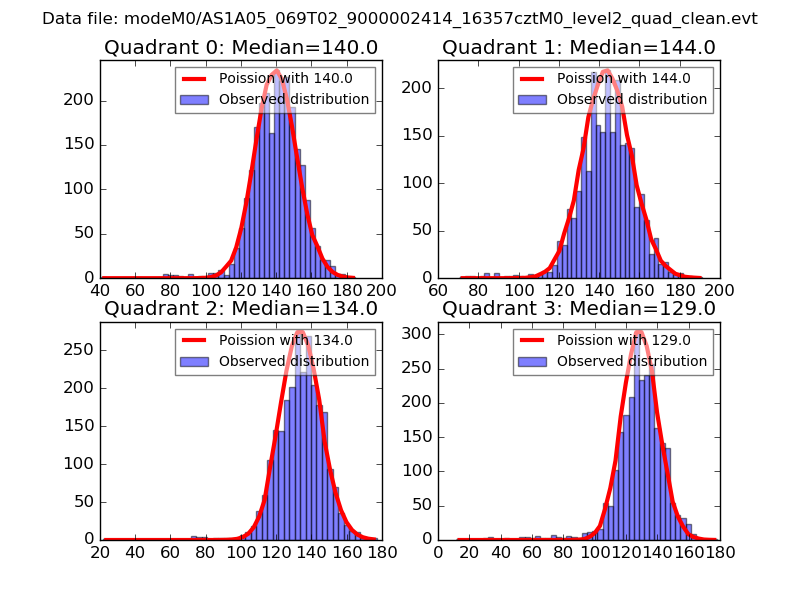 |
 |
| Quadrant-wise count rates Data is divided into 100 sec bins |
 |
|
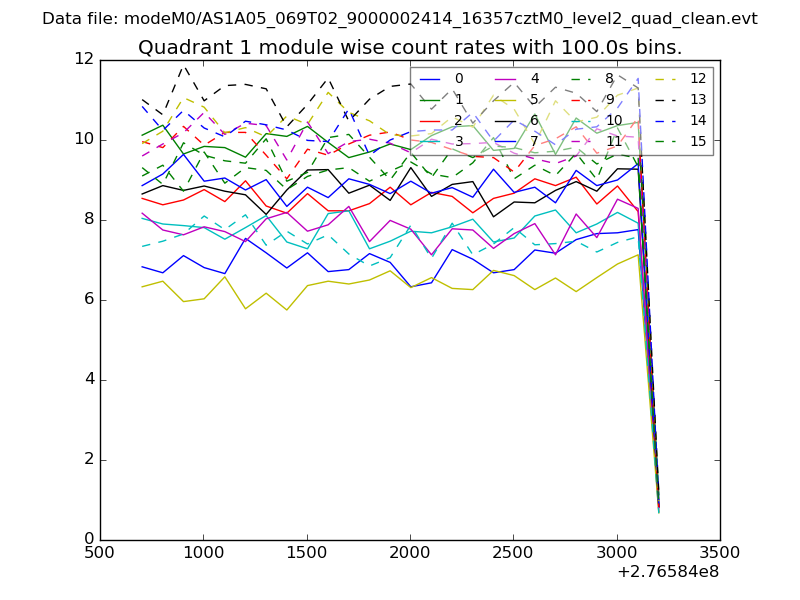
| Module-wise count rates for Quadrant A Data is divided into 100 sec bins |
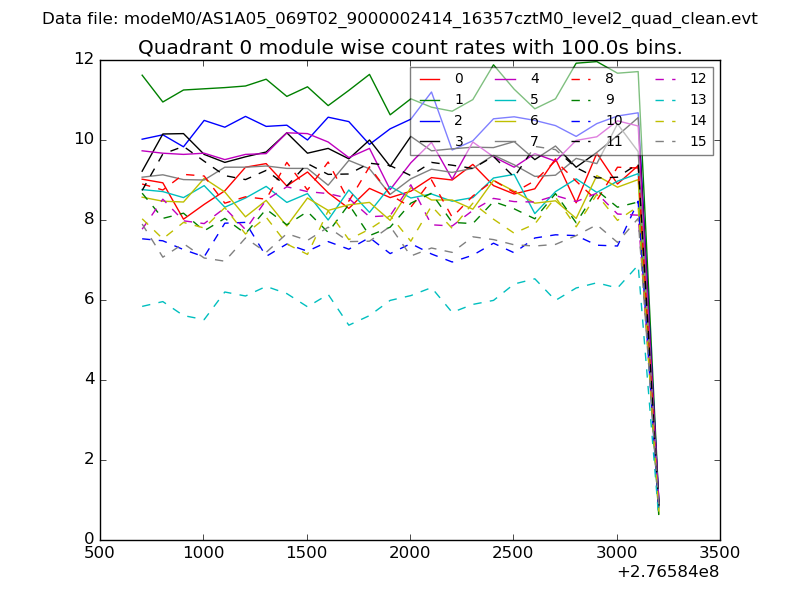 |
 |
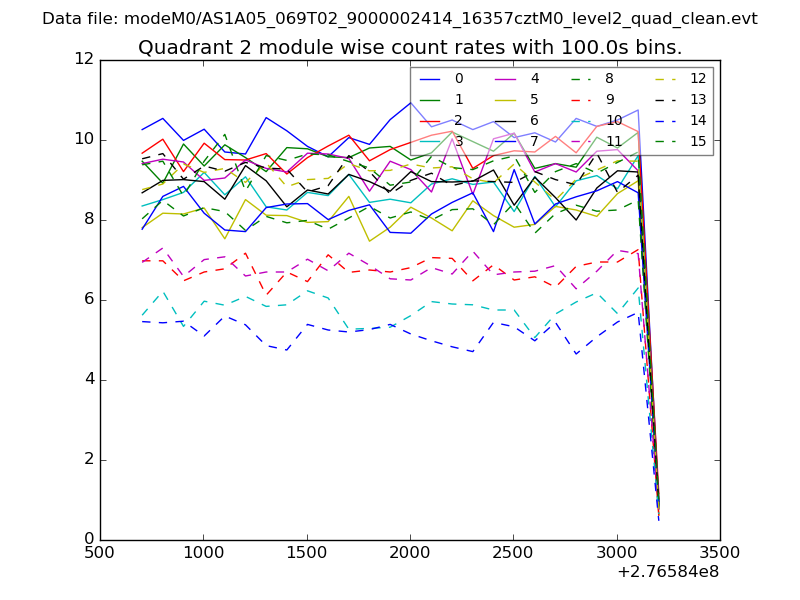
| Module-wise count rates for Quadrant B Data is divided into 100 sec bins |
 |
 |
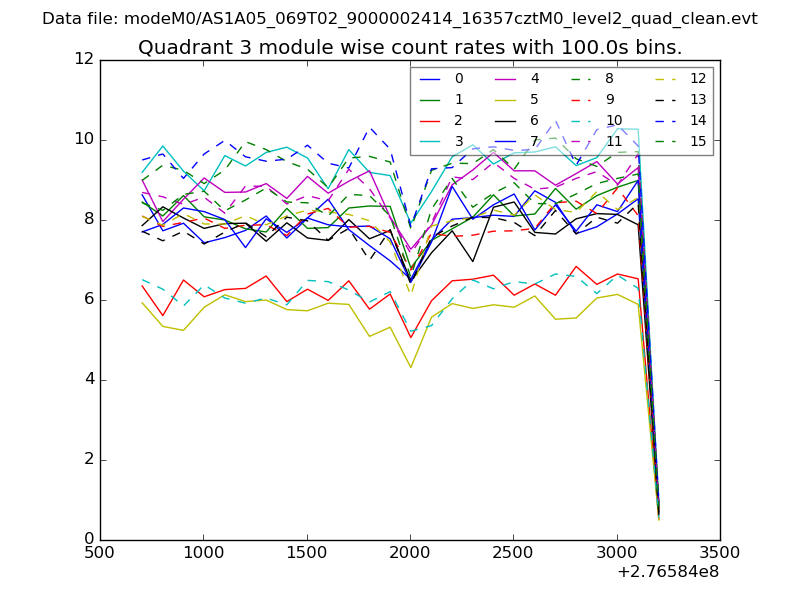
| Module-wise count rates for Quadrant C Data is divided into 100 sec bins |
 |
 |
| Module-wise count rates for Quadrant D Data is divided into 100 sec bins |
 |
 |
| Parameter | Plot |
|---|---|
| CZT HV Monitor | 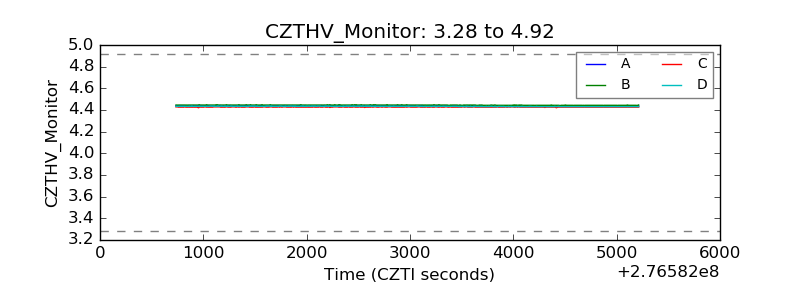 |
| D_VDD | 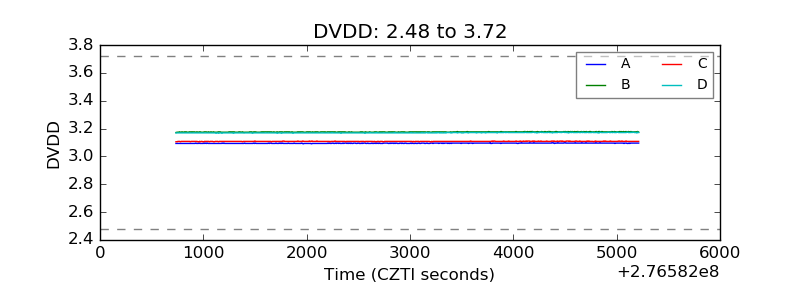 |
| Temperature 1 | 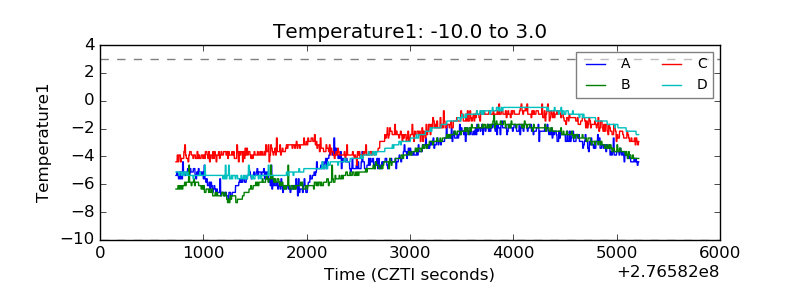 |
| Veto HV Monitor | 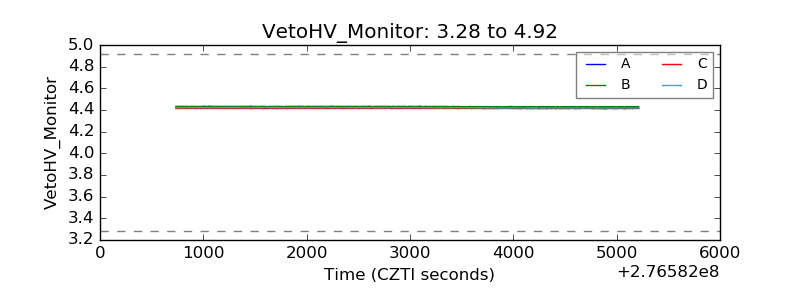 |
| Veto LLD | 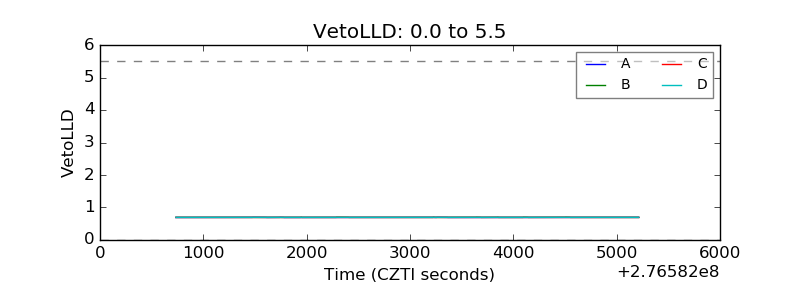 |
| Alpha Counter | 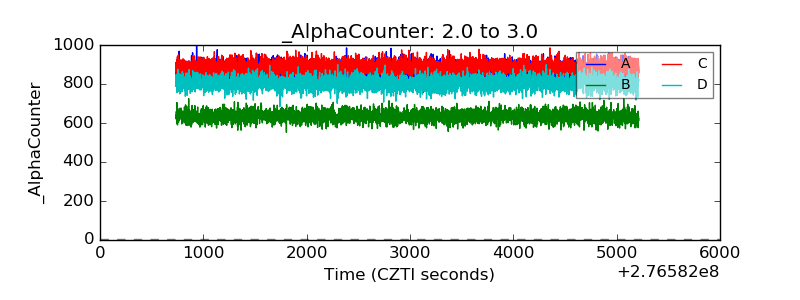 |
| _CPM_Rate | 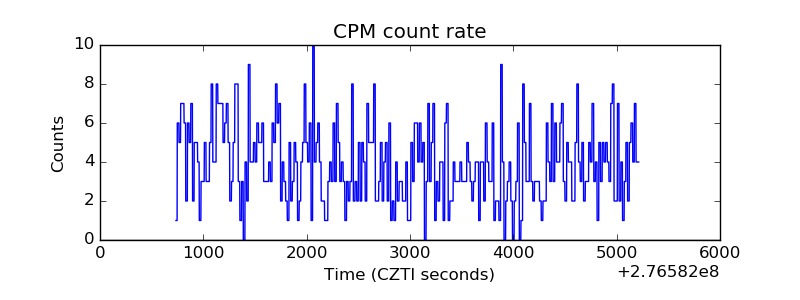 |
| CZT Counter | 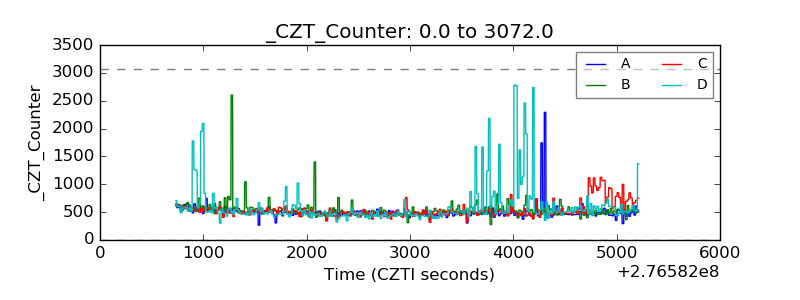 |
| +2.5 Volts monitor |  |
| +5 Volts monitor |  |
| _ROLL_ROT | 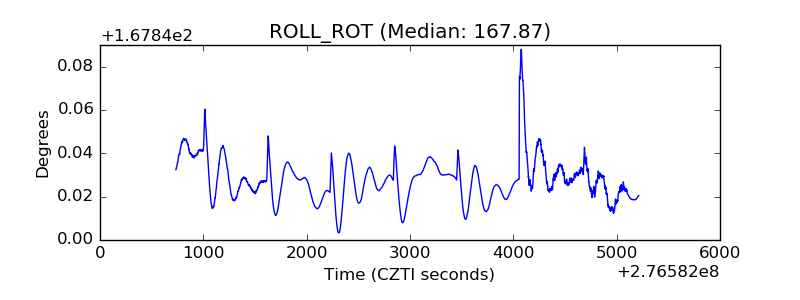 |
| _Roll_DEC | 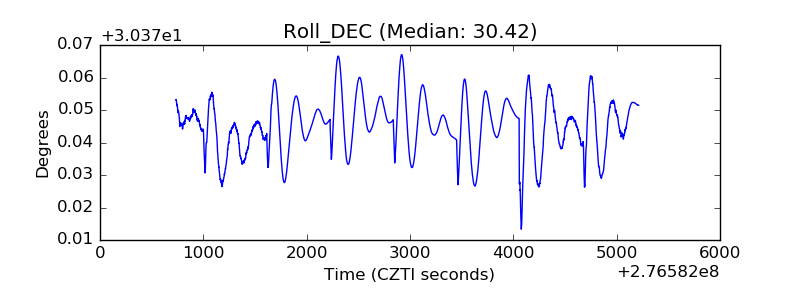 |
| _Roll_RA | 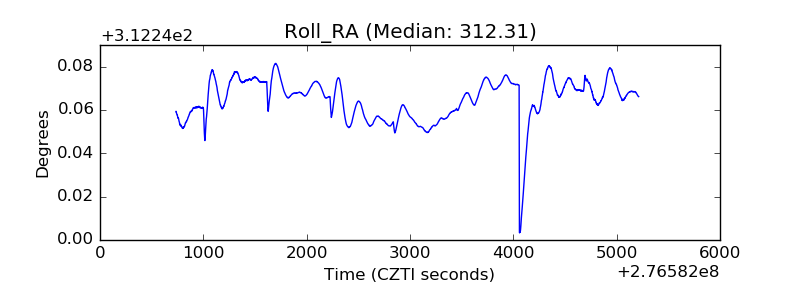 |
| Veto Counter | 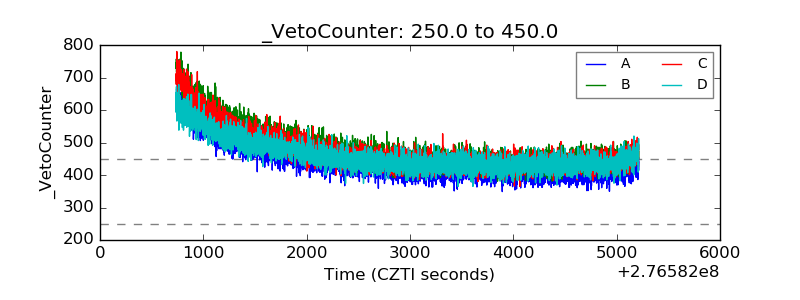 |