| Param | Original file | Final file |
|---|---|---|
| Filename | modeM0/AS1A05_069T03_9000002416cztM0_level2.fits | modeM0/AS1A05_069T03_9000002416cztM0_level2_quad_clean.evt |
| Size (bytes) | 446,947,200 | 468,993,600 |
| Size | 426.2 MB | 447.3 MB |
| Events in quadrant A | 2,677,592 | 2,794,466 |
| Events in quadrant B | 2,628,418 | 2,917,385 |
| Events in quadrant C | 2,659,168 | 2,750,699 |
| Events in quadrant D | 2,320,662 | 2,493,079 |
| Mode M0 | |||
|---|---|---|---|
| Quadrant | BADHDUFLAG | Total packets | Discarded packets |
| A | 0 | 114027 | 0 |
| B | 0 | 104345 | 0 |
| C | 0 | 102353 | 0 |
| D | 0 | 107507 | 0 |
| Mode SS | |||
|---|---|---|---|
| Quadrant | BADHDUFLAG | Total packets | Discarded packets |
| A | 0 | 968 | 0 |
| B | 0 | 968 | 0 |
| C | 0 | 968 | 0 |
| D | 0 | 968 | 0 |
| Mode M9 | |||
|---|---|---|---|
| Quadrant | BADHDUFLAG | Total packets | Discarded packets |
| A | 0 | 58 | 0 |
| B | 0 | 58 | 0 |
| C | 0 | 58 | 0 |
| D | 0 | 58 | 0 |
| Quadrant | Total seconds | Saturated seconds | Saturation percentage |
|---|---|---|---|
| A | 47323 | 2689 | 5.682226% |
| B | 47323 | 1087 | 2.296980% |
| C | 47323 | 978 | 2.066648% |
| D | 47323 | 1344 | 2.840057% |
Noise dominated data is calculated using 1-second bins in cleaned event files. If a bin has >2000 counts, and if more than 50% of those come from <1% of pixels, then it is considered to be noise-dominated and hence unusable.
| Quadrant | # 1 sec bins | Bins with >0 counts | Bins with >2000 counts | High rate bins dominated by noise | Noise dominated (total time) | Noise dominated (detector-on time) | Marked lightcurve |
|---|---|---|---|---|---|---|---|
| A | 51877 | 47305 | 0 | 0 | 0.00% | 0.00% |  |
| B | 51877 | 47318 | 0 | 0 | 0.00% | 0.00% |  |
| C | 51877 | 47321 | 0 | 0 | 0.00% | 0.00% |  |
| D | 51877 | 47309 | 0 | 0 | 0.00% | 0.00% |  |
Top three noisy pixels from each quadrant. If the there are fewer than three noisy pixels in the level2.evt file, extra rows are filled as -1
| Pixel properties | Quadrant properties | ||||||
|---|---|---|---|---|---|---|---|
| Quadrant | DetID | PixID | Counts | Sigma | Mean | Median | Sigma |
| A | 0 | 29 | 2620 | 11.4 | 695 | 650 | 172.8 |
| A | 7 | 110 | 2135 | 8.6 | 695 | 650 | 172.8 |
| A | 15 | 236 | 2011 | 7.88 | 695 | 650 | 172.8 |
| B | 2 | 9 | 2181 | 10.8 | 695 | 661 | 140.7 |
| B | 2 | 8 | 1830 | 8.31 | 695 | 661 | 140.7 |
| B | 5 | 128 | 1748 | 7.72 | 695 | 661 | 140.7 |
| C | 1 | 81 | 2006 | 7.4 | 701 | 652 | 183.0 |
| C | 1 | 80 | 1988 | 7.3 | 701 | 652 | 183.0 |
| C | 3 | 126 | 1813 | 6.35 | 701 | 652 | 183.0 |
| D | 6 | 67 | 1685 | 6.12 | 661 | 600 | 177.3 |
| D | 3 | 14 | 1662 | 5.99 | 661 | 600 | 177.3 |
| D | 1 | 3 | 1655 | 5.95 | 661 | 600 | 177.3 |
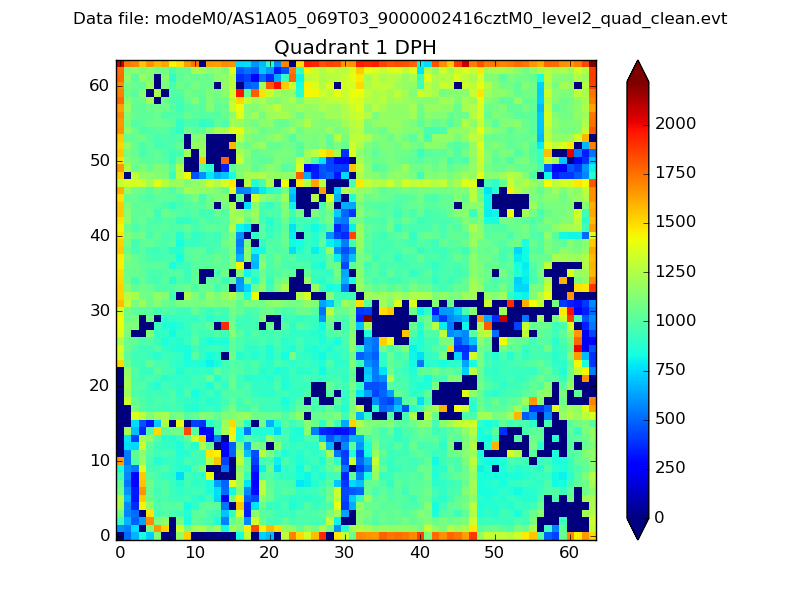
Histogram calculated using DETX and DETY for each event in the final _common_clean file
| Quadrant A |  |
 |
Quadrant B |
|---|---|---|---|
| Quadrant D | 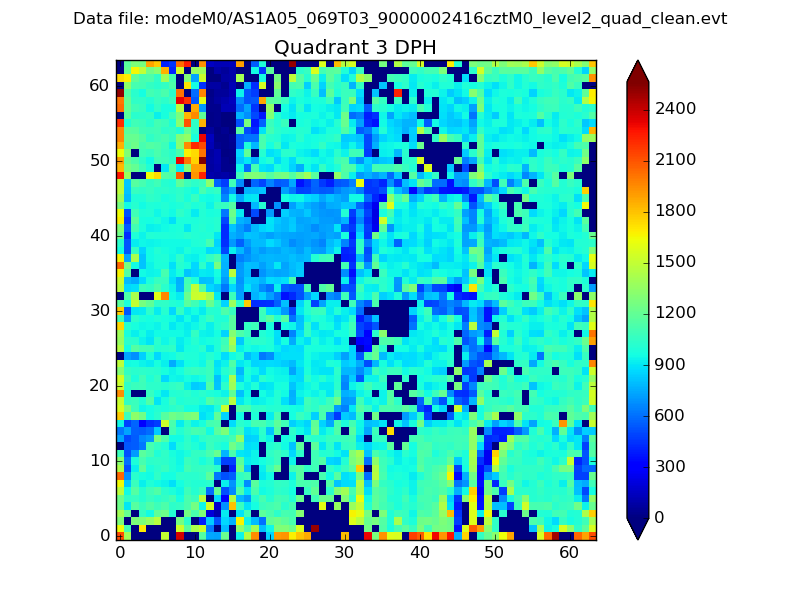 |
 |
Quadrant C |
| Plot type | Count rate plots | Images |
|---|---|---|
| Comparison with Poisson distribution Blue bars denote a histogram of data divided into 1 sec bins. Red curve is a Poisson curve with rate = median count rate of data. |
 |
 |
| Quadrant-wise count rates Data is divided into 100 sec bins |
 |
|
| Module-wise count rates for Quadrant A Data is divided into 100 sec bins |
 |
 |
| Module-wise count rates for Quadrant B Data is divided into 100 sec bins |
 |
 |
| Module-wise count rates for Quadrant C Data is divided into 100 sec bins |
 |
 |
| Module-wise count rates for Quadrant D Data is divided into 100 sec bins |
 |
 |
| Parameter | Plot |
|---|---|
| CZT HV Monitor |  |
| D_VDD |  |
| Temperature 1 |  |
| Veto HV Monitor |  |
| Veto LLD |  |
| Alpha Counter |  |
| _CPM_Rate |  |
| CZT Counter |  |
| +2.5 Volts monitor |  |
| +5 Volts monitor |  |
| _ROLL_ROT |  |
| _Roll_DEC |  |
| _Roll_RA |  |
| Veto Counter |  |