| Param | Original file | Final file |
|---|---|---|
| Filename | modeM0/AS1A05_069T03_9000002416_16358cztM0_level2.evt | modeM0/AS1A05_069T03_9000002416_16358cztM0_level2_quad_clean.evt |
| Size (bytes) | 487,080,000 | 77,541,120 |
| Size | 464.5 MB | 73.9 MB |
| Events in quadrant A | 3,437,955 | 483,226 |
| Events in quadrant B | 3,526,974 | 495,163 |
| Events in quadrant C | 3,337,143 | 468,853 |
| Events in quadrant D | 4,003,592 | 443,294 |
| Mode M0 | |||
|---|---|---|---|
| Quadrant | BADHDUFLAG | Total packets | Discarded packets |
| A | 0 | 14173 | 3 |
| B | 0 | 14370 | 2 |
| C | 0 | 13792 | 2 |
| D | 0 | 16206 | 2 |
| Mode SS | |||
|---|---|---|---|
| Quadrant | BADHDUFLAG | Total packets | Discarded packets |
| A | 0 | 136 | 0 |
| B | 0 | 136 | 0 |
| C | 0 | 136 | 0 |
| D | 0 | 136 | 0 |
| Mode M9 | |||
|---|---|---|---|
| Quadrant | BADHDUFLAG | Total packets | Discarded packets |
| A | 0 | 23 | 0 |
| B | 0 | 23 | 0 |
| C | 0 | 23 | 0 |
| D | 0 | 23 | 0 |
| Quadrant | Total seconds | Saturated seconds | Saturation percentage |
|---|---|---|---|
| A | 6556 | 127 | 1.937157% |
| B | 6556 | 151 | 2.303234% |
| C | 6556 | 124 | 1.891397% |
| D | 6556 | 272 | 4.148871% |
Noise dominated data is calculated using 1-second bins in cleaned event files. If a bin has >2000 counts, and if more than 50% of those come from <1% of pixels, then it is considered to be noise-dominated and hence unusable.
| Quadrant | # 1 sec bins | Bins with >0 counts | Bins with >2000 counts | High rate bins dominated by noise | Noise dominated (total time) | Noise dominated (detector-on time) | Marked lightcurve |
|---|---|---|---|---|---|---|---|
| A | 7607 | 6557 | 9 | 9 | 0.12% | 0.14% | 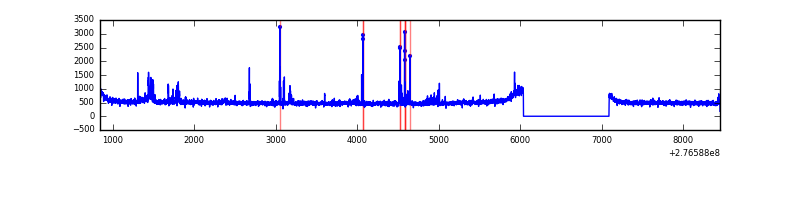 |
| B | 7607 | 6557 | 6 | 6 | 0.08% | 0.09% | 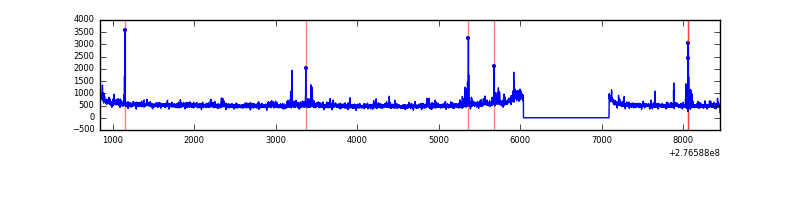 |
| C | 7607 | 6558 | 0 | 0 | 0.00% | 0.00% | 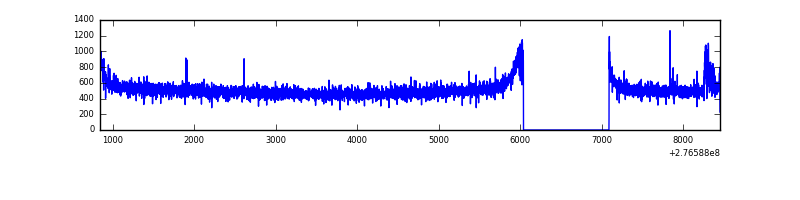 |
| D | 7607 | 6558 | 168 | 168 | 2.21% | 2.56% | 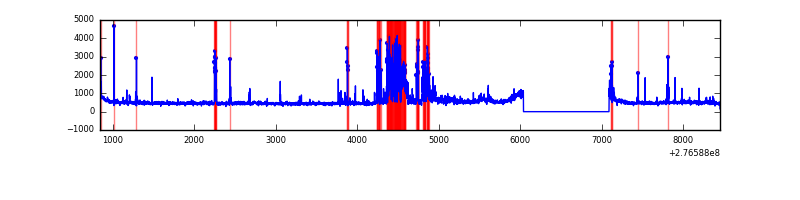 |
Top three noisy pixels from each quadrant. If the there are fewer than three noisy pixels in the level2.evt file, extra rows are filled as -1
| Pixel properties | Quadrant properties | ||||||
|---|---|---|---|---|---|---|---|
| Quadrant | DetID | PixID | Counts | Sigma | Mean | Median | Sigma |
| A | 15 | 174 | 177124 | 1038.25 | 847 | 829 | 169.8 |
| A | 0 | 226 | 7476 | 39.15 | 847 | 829 | 169.8 |
| A | 12 | 194 | 6226 | 31.78 | 847 | 829 | 169.8 |
| B | 15 | 35 | 53776 | 332.04 | 848 | 828 | 159.5 |
| B | 0 | 189 | 38025 | 233.26 | 848 | 828 | 159.5 |
| B | 4 | 173 | 32286 | 197.27 | 848 | 828 | 159.5 |
| C | 14 | 238 | 125946 | 671.5 | 802 | 807 | 186.4 |
| C | 3 | 233 | 73822 | 391.8 | 802 | 807 | 186.4 |
| C | 10 | 169 | 6505 | 30.58 | 802 | 807 | 186.4 |
| D | 10 | 70 | 507644 | 2584.66 | 805 | 783 | 196.1 |
| D | 12 | 218 | 227313 | 1155.15 | 805 | 783 | 196.1 |
| D | 1 | 52 | 179609 | 911.9 | 805 | 783 | 196.1 |
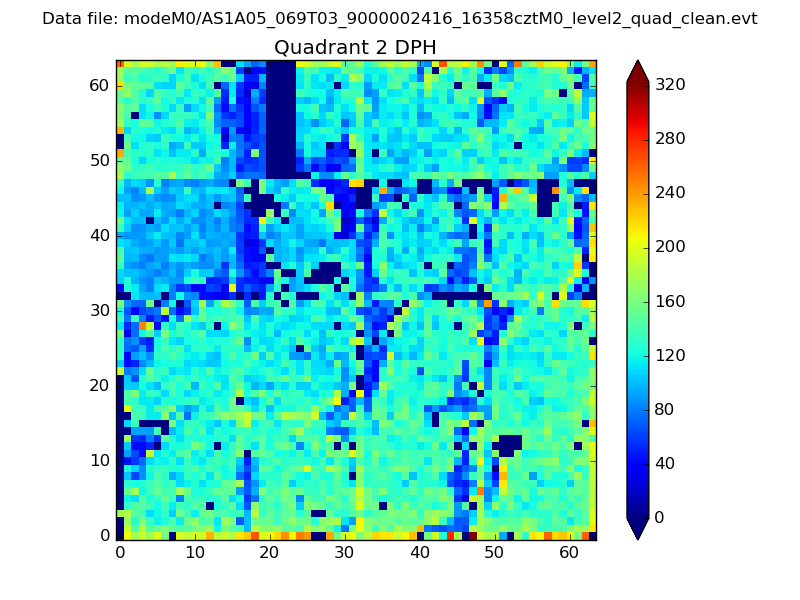
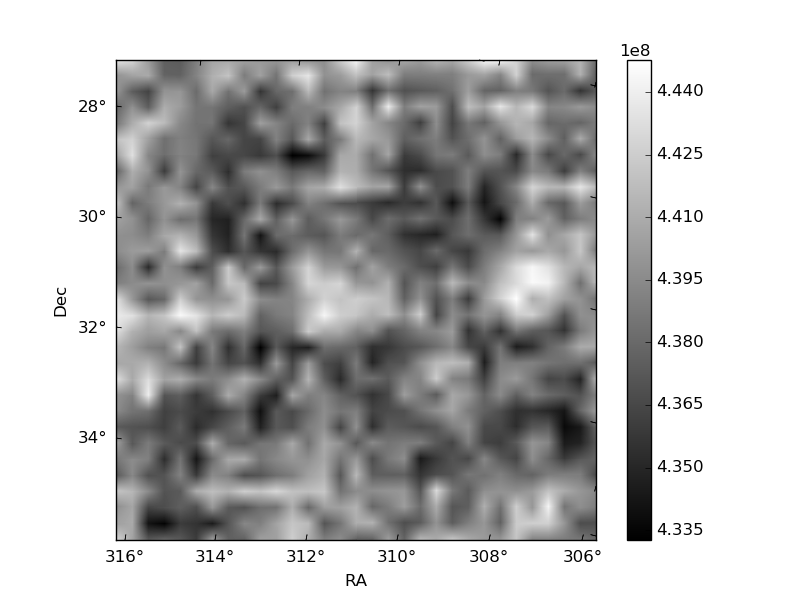
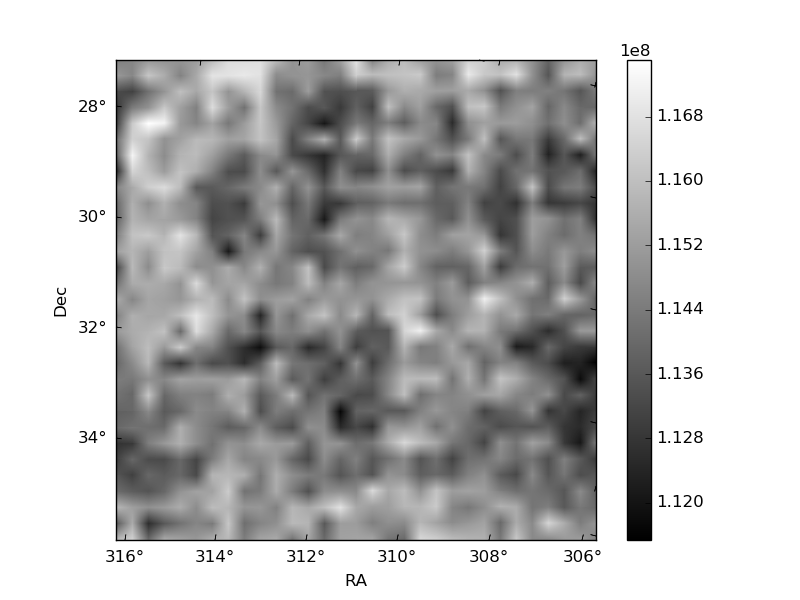
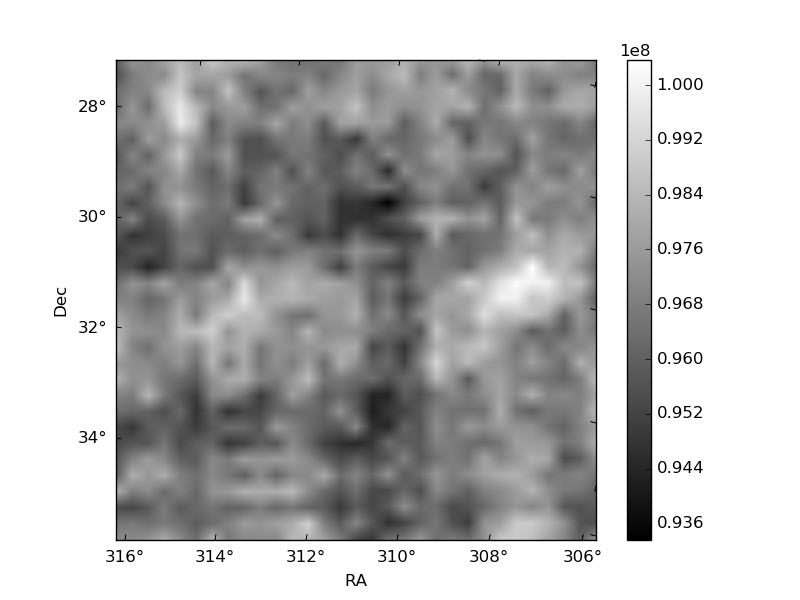
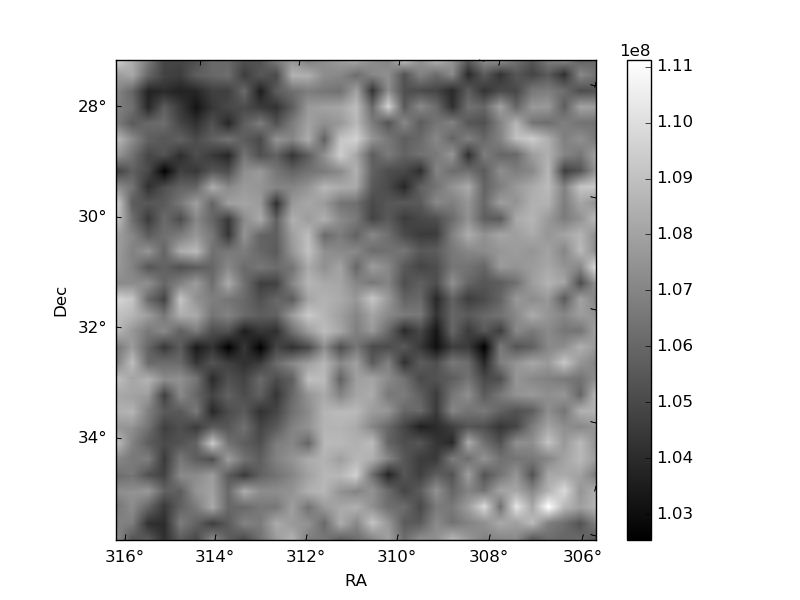
Histogram calculated using DETX and DETY for each event in the final _common_clean file
| Quadrant A | 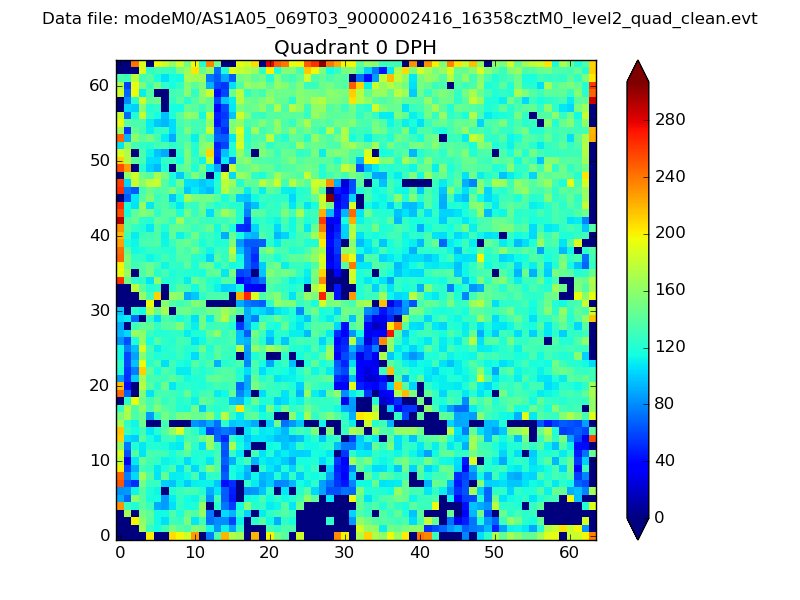 |
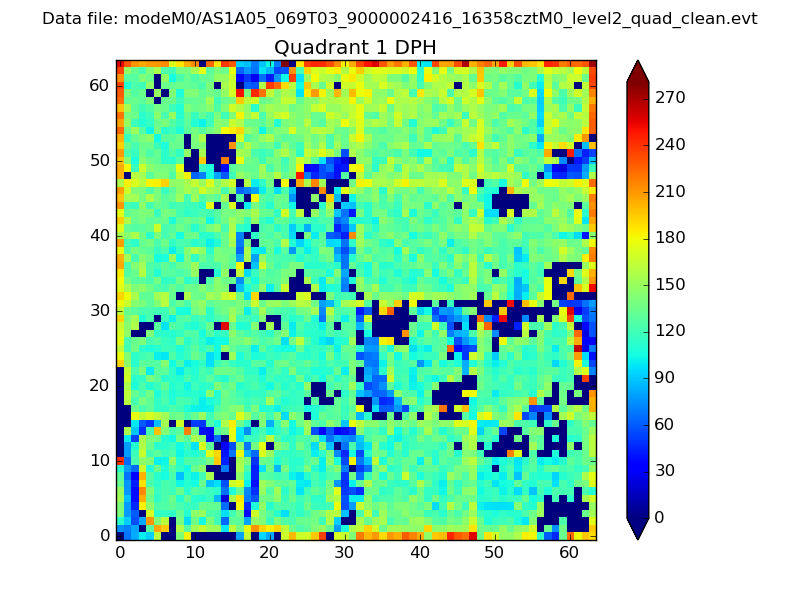 |
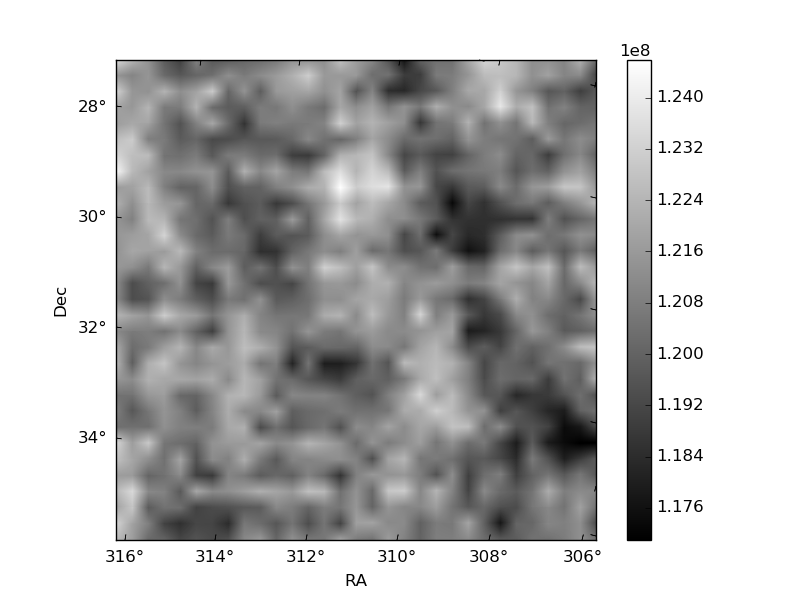
Quadrant B |
|---|---|---|---|
| Quadrant D | 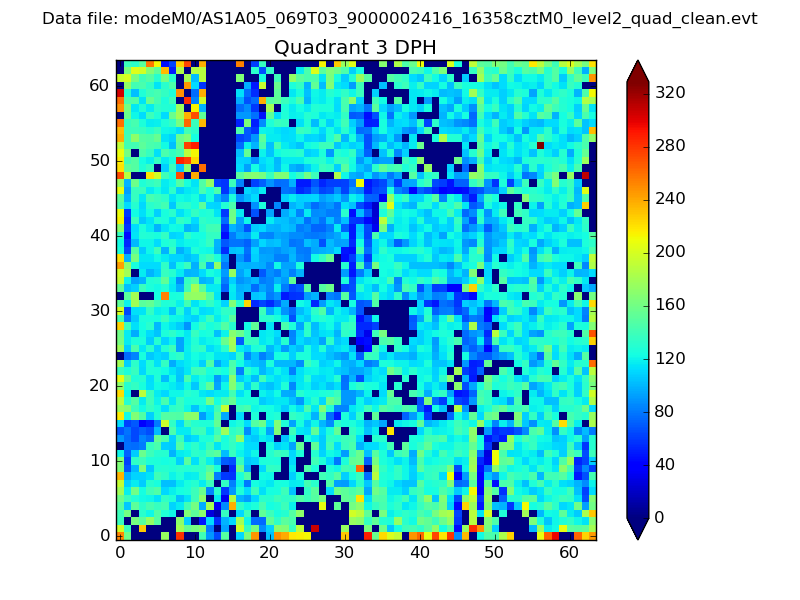 |
 |
Quadrant C |
| Plot type | Count rate plots | Images |
|---|---|---|
| Comparison with Poisson distribution Blue bars denote a histogram of data divided into 1 sec bins. Red curve is a Poisson curve with rate = median count rate of data. |
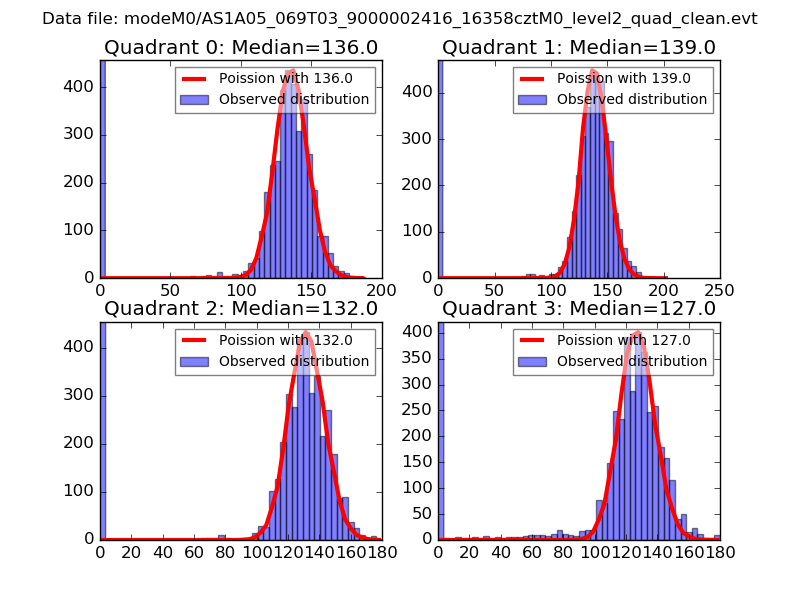 |
 |
| Quadrant-wise count rates Data is divided into 100 sec bins |
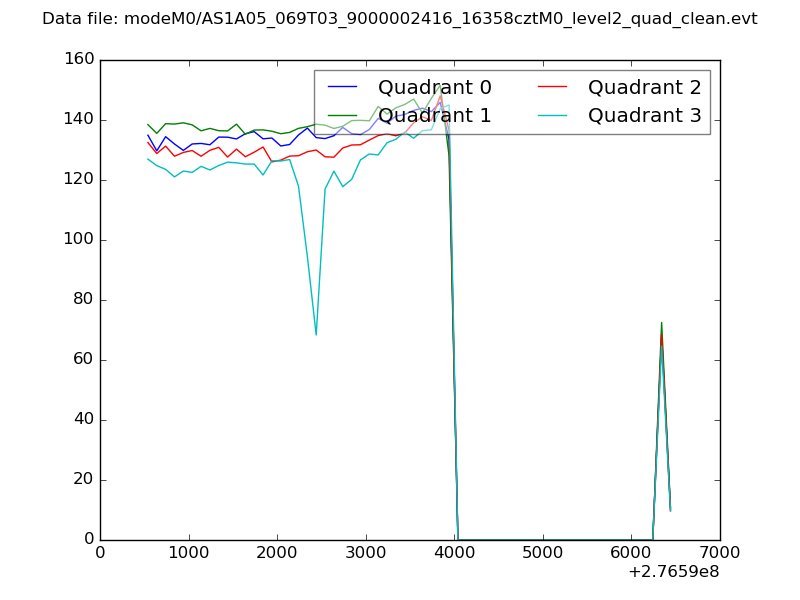 |
|
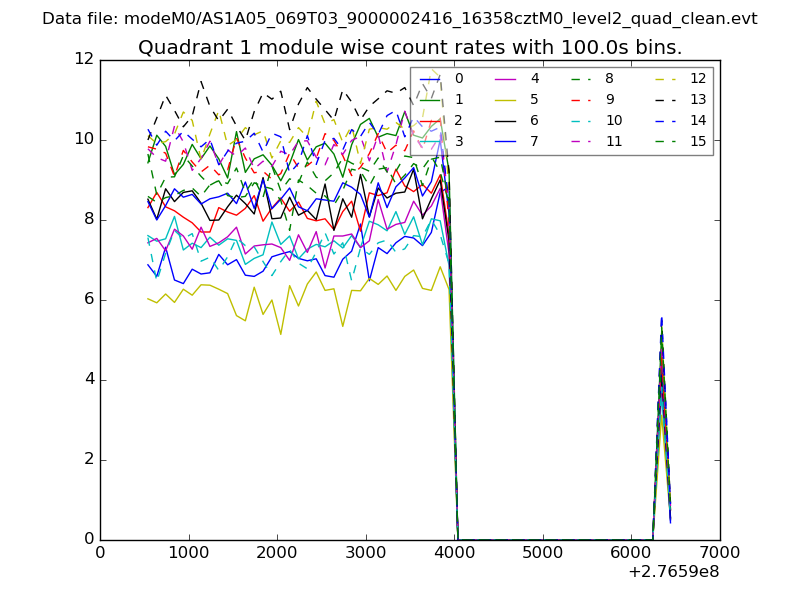
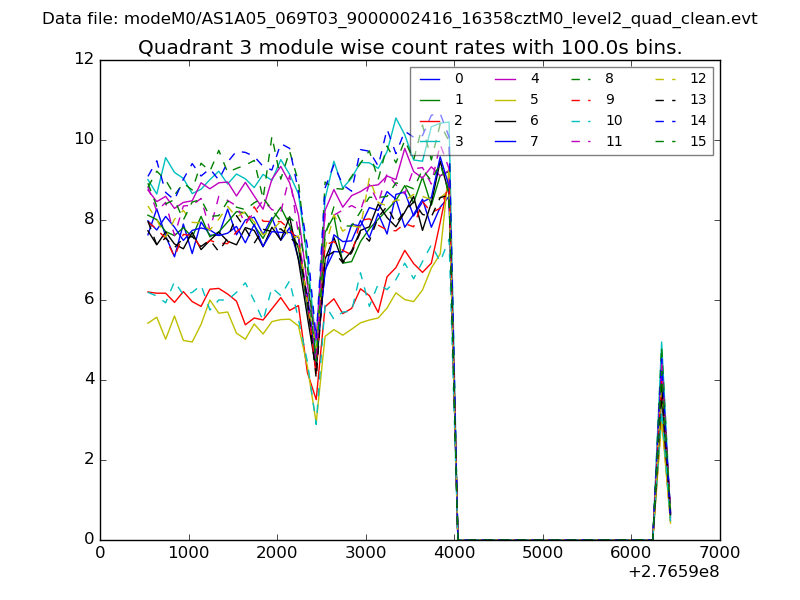
| Module-wise count rates for Quadrant A Data is divided into 100 sec bins |
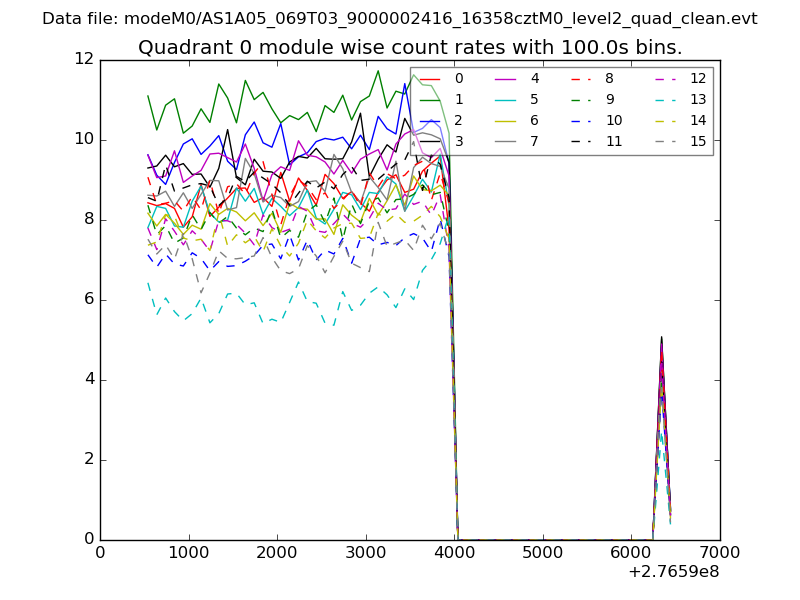 |
 |
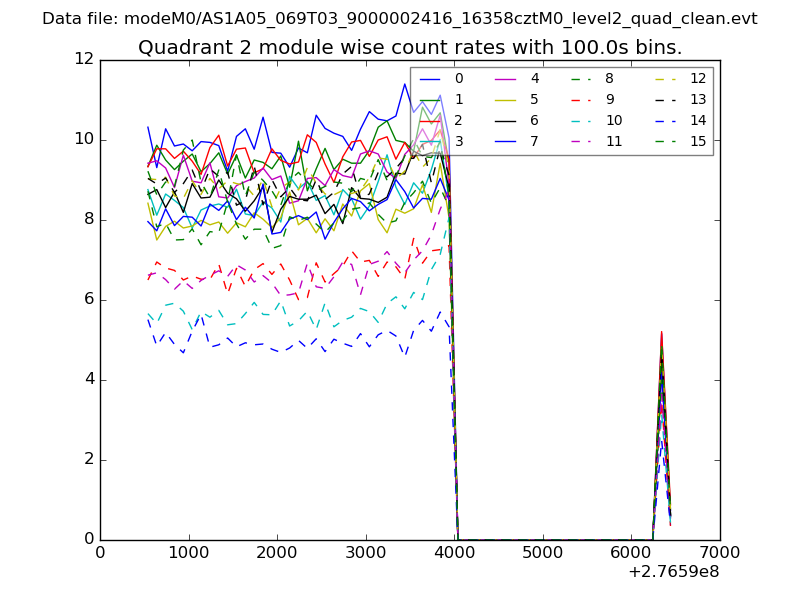
| Module-wise count rates for Quadrant B Data is divided into 100 sec bins |
 |
 |
| Module-wise count rates for Quadrant C Data is divided into 100 sec bins |
 |
 |
| Module-wise count rates for Quadrant D Data is divided into 100 sec bins |
 |
 |
| Parameter | Plot |
|---|---|
| CZT HV Monitor | 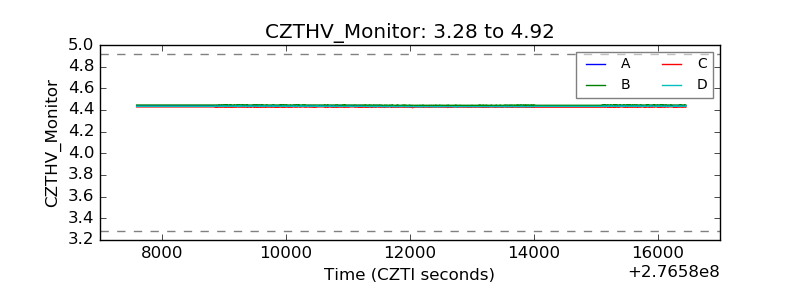 |
| D_VDD | 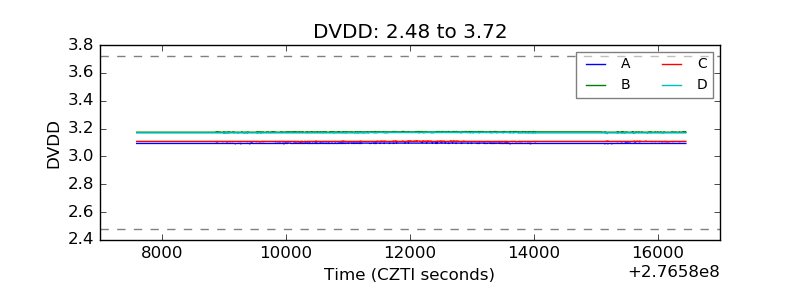 |
| Temperature 1 | 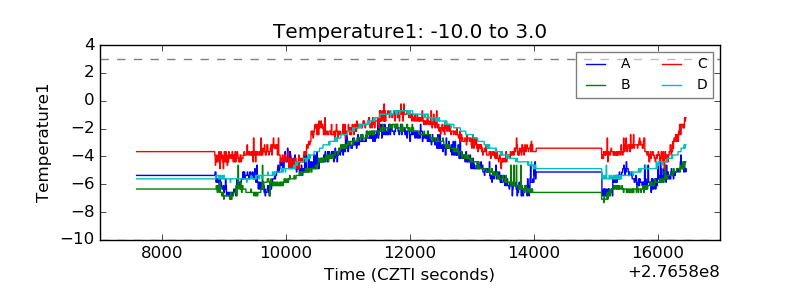 |
| Veto HV Monitor | 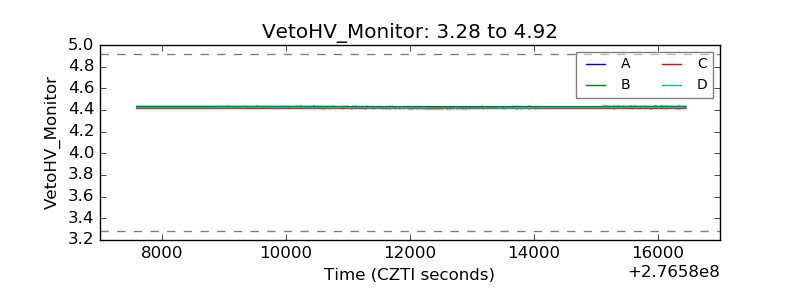 |
| Veto LLD | 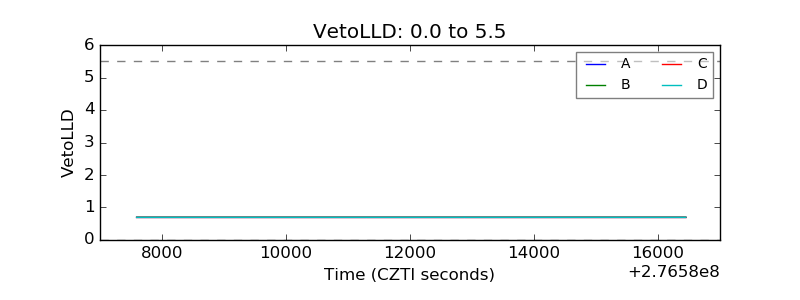 |
| Alpha Counter |  |
| _CPM_Rate | 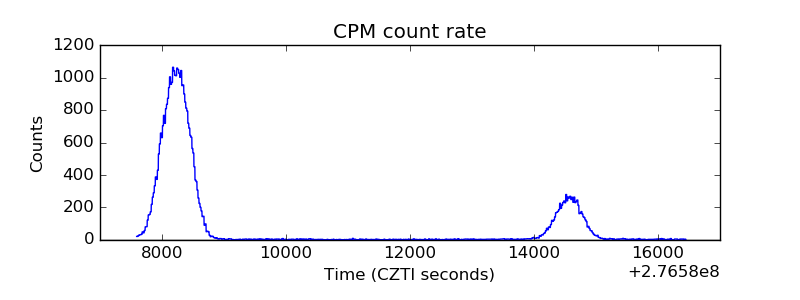 |
| CZT Counter | 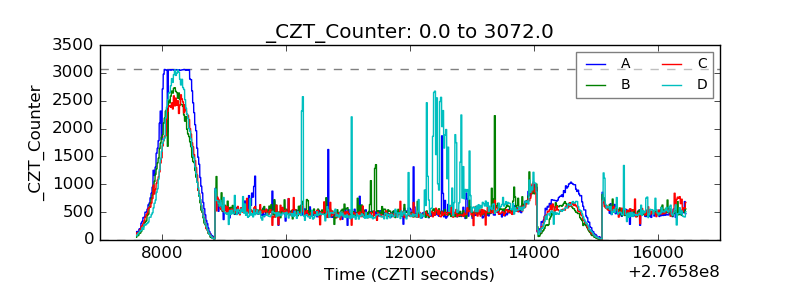 |
| +2.5 Volts monitor |  |
| +5 Volts monitor | 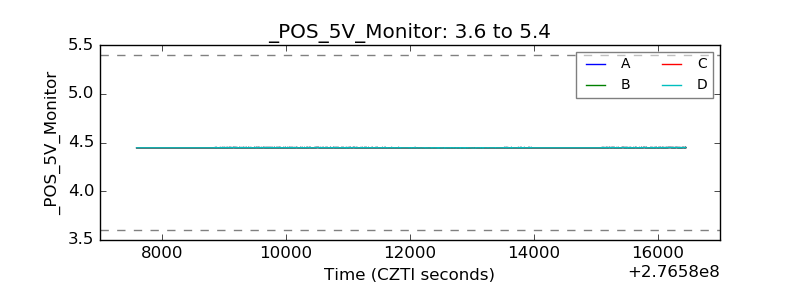 |
| _ROLL_ROT | 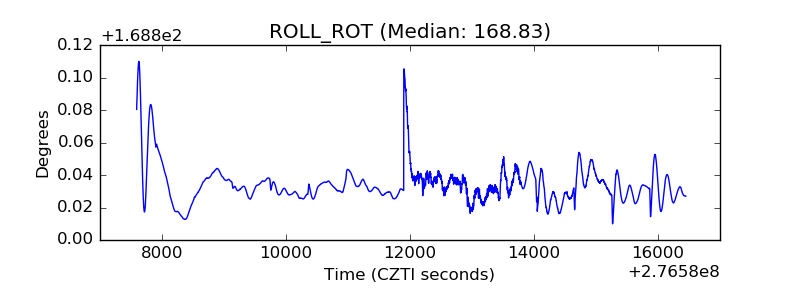 |
| _Roll_DEC | 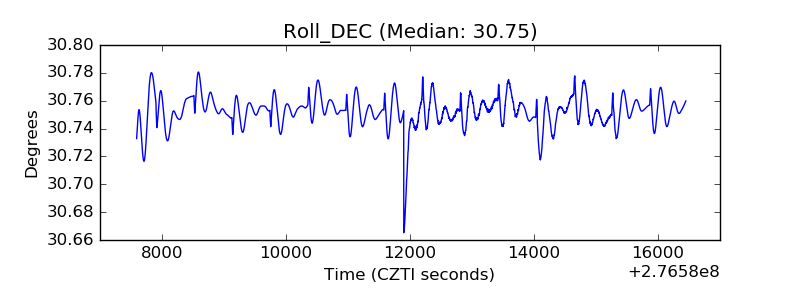 |
| _Roll_RA | 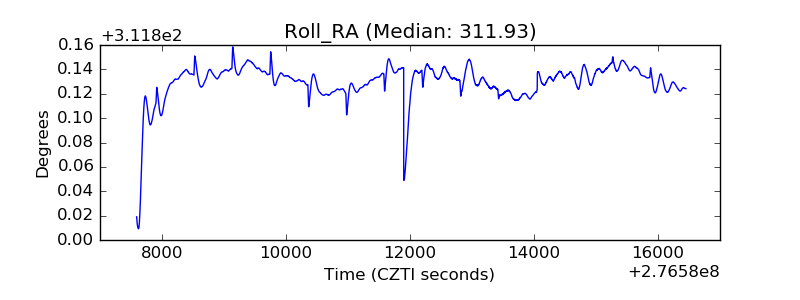 |
| Veto Counter | 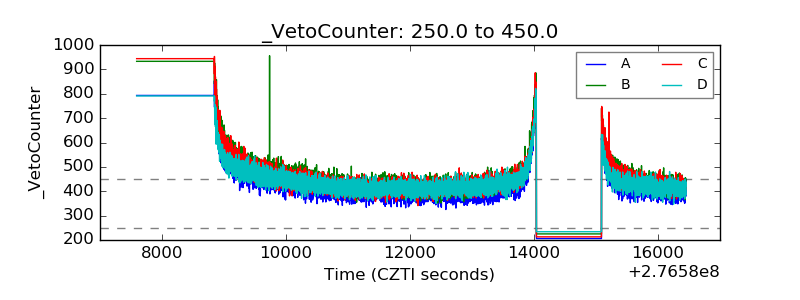 |