| Param | Original file | Final file |
|---|---|---|
| Filename | modeM0/AS1A05_069T03_9000002416_16360cztM0_level2.evt | modeM0/AS1A05_069T03_9000002416_16360cztM0_level2_quad_clean.evt |
| Size (bytes) | 528,419,520 | 93,297,600 |
| Size | 503.9 MB | 89.0 MB |
| Events in quadrant A | 3,773,926 | 583,874 |
| Events in quadrant B | 3,923,182 | 594,335 |
| Events in quadrant C | 3,822,716 | 565,645 |
| Events in quadrant D | 3,963,087 | 548,830 |
| Mode M0 | |||
|---|---|---|---|
| Quadrant | BADHDUFLAG | Total packets | Discarded packets |
| A | 0 | 16221 | 3 |
| B | 0 | 16393 | 2 |
| C | 0 | 16085 | 2 |
| D | 0 | 17019 | 2 |
| Mode SS | |||
|---|---|---|---|
| Quadrant | BADHDUFLAG | Total packets | Discarded packets |
| A | 0 | 156 | 0 |
| B | 0 | 156 | 0 |
| C | 0 | 156 | 0 |
| D | 0 | 156 | 0 |
| Mode M9 | |||
|---|---|---|---|
| Quadrant | BADHDUFLAG | Total packets | Discarded packets |
| A | 0 | 4 | 0 |
| B | 0 | 4 | 0 |
| C | 0 | 4 | 0 |
| D | 0 | 5 | 0 |
| Quadrant | Total seconds | Saturated seconds | Saturation percentage |
|---|---|---|---|
| A | 7654 | 294 | 3.841129% |
| B | 7654 | 284 | 3.710478% |
| C | 7654 | 276 | 3.605958% |
| D | 7654 | 301 | 3.932584% |
Noise dominated data is calculated using 1-second bins in cleaned event files. If a bin has >2000 counts, and if more than 50% of those come from <1% of pixels, then it is considered to be noise-dominated and hence unusable.
| Quadrant | # 1 sec bins | Bins with >0 counts | Bins with >2000 counts | High rate bins dominated by noise | Noise dominated (total time) | Noise dominated (detector-on time) | Marked lightcurve |
|---|---|---|---|---|---|---|---|
| A | 7775 | 7655 | 13 | 13 | 0.17% | 0.17% | 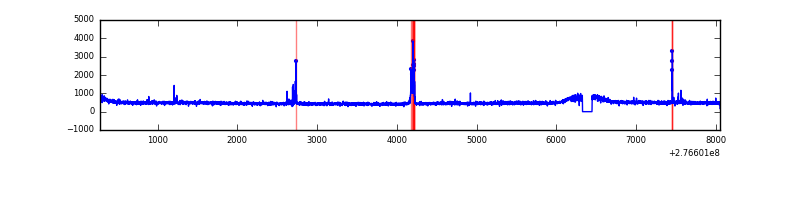 |
| B | 7775 | 7656 | 6 | 6 | 0.08% | 0.08% | 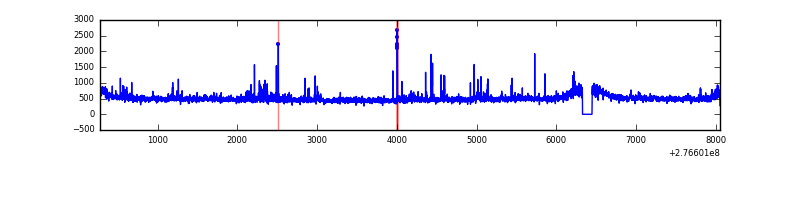 |
| C | 7775 | 7656 | 0 | 0 | 0.00% | 0.00% | 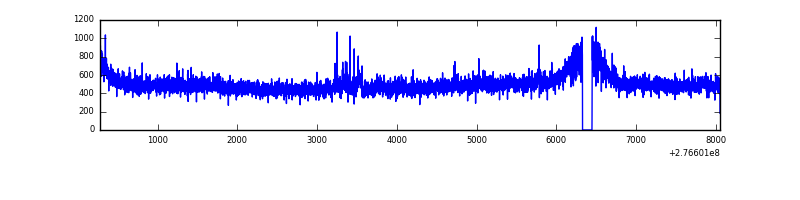 |
| D | 7775 | 7656 | 64 | 64 | 0.82% | 0.84% | 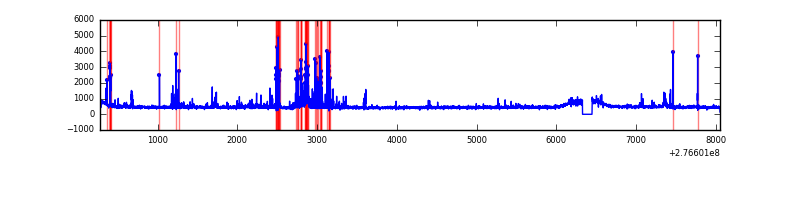 |
Top three noisy pixels from each quadrant. If the there are fewer than three noisy pixels in the level2.evt file, extra rows are filled as -1
| Pixel properties | Quadrant properties | ||||||
|---|---|---|---|---|---|---|---|
| Quadrant | DetID | PixID | Counts | Sigma | Mean | Median | Sigma |
| A | 15 | 174 | 125718 | 652.26 | 945 | 922 | 191.3 |
| A | 15 | 223 | 11519 | 55.39 | 945 | 922 | 191.3 |
| A | 0 | 226 | 8145 | 37.75 | 945 | 922 | 191.3 |
| B | 0 | 189 | 53674 | 288.59 | 944 | 917 | 182.8 |
| B | 15 | 35 | 43438 | 232.6 | 944 | 917 | 182.8 |
| B | 0 | 198 | 40891 | 218.67 | 944 | 917 | 182.8 |
| C | 14 | 238 | 138517 | 647.97 | 905 | 910 | 212.4 |
| C | 3 | 233 | 128588 | 601.21 | 905 | 910 | 212.4 |
| C | 10 | 169 | 15870 | 70.44 | 905 | 910 | 212.4 |
| D | 12 | 110 | 222659 | 983.11 | 919 | 891 | 225.6 |
| D | 10 | 70 | 152767 | 673.28 | 919 | 891 | 225.6 |
| D | 1 | 52 | 66705 | 291.76 | 919 | 891 | 225.6 |
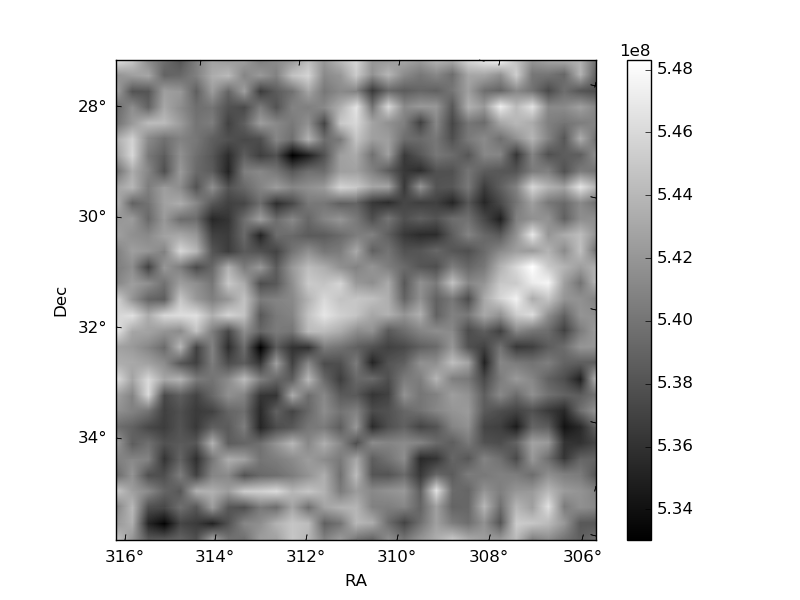
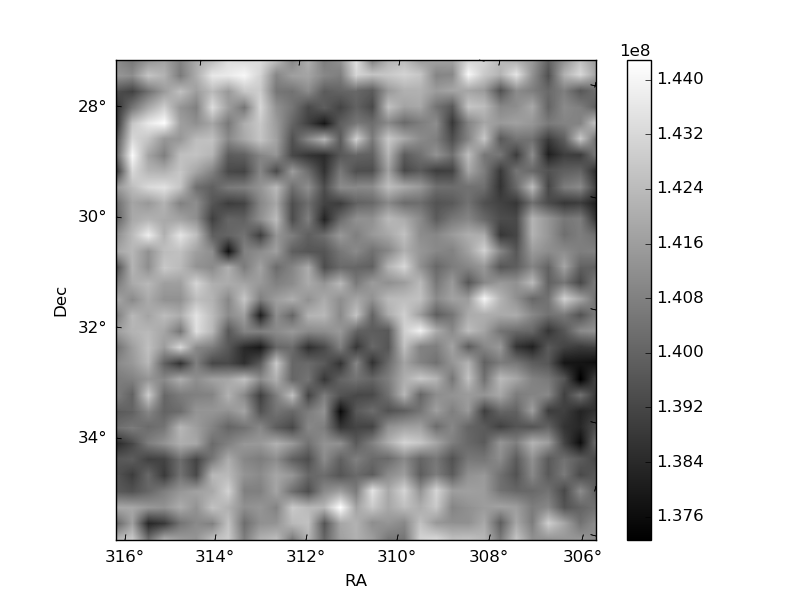
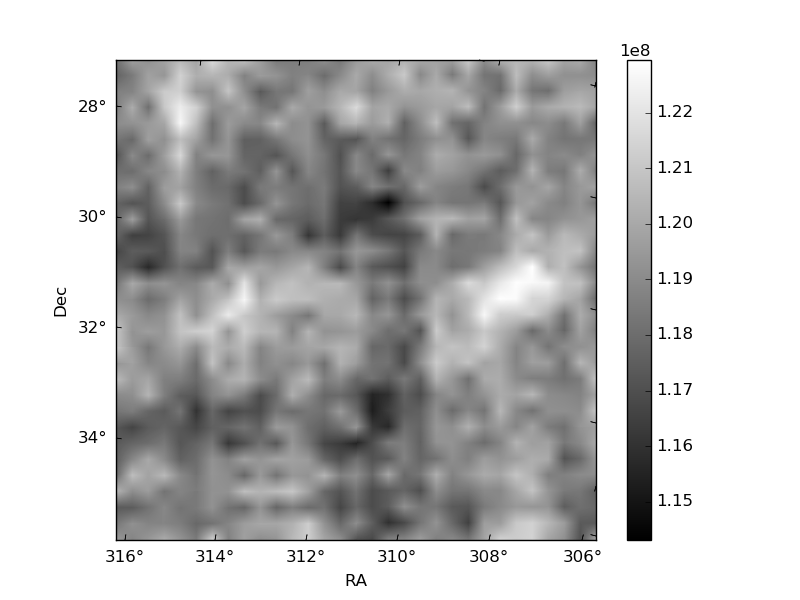
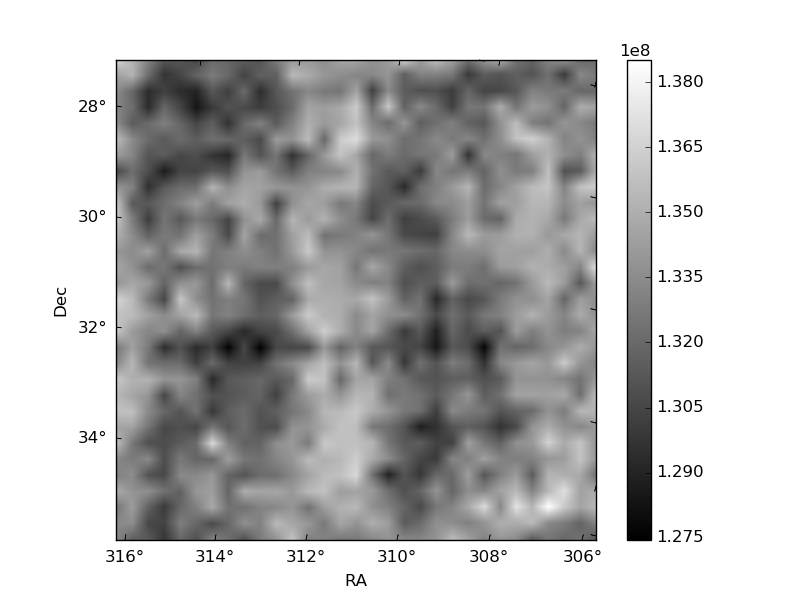
Histogram calculated using DETX and DETY for each event in the final _common_clean file
| Quadrant A | 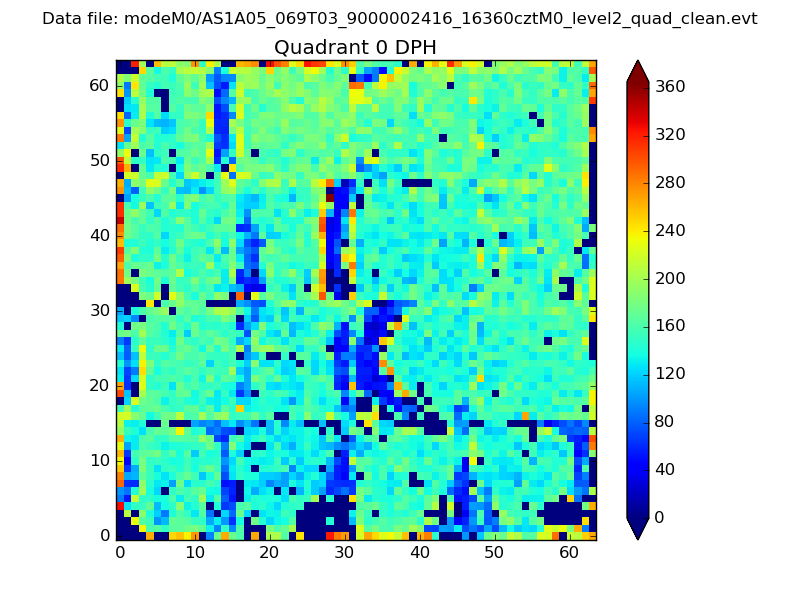 |
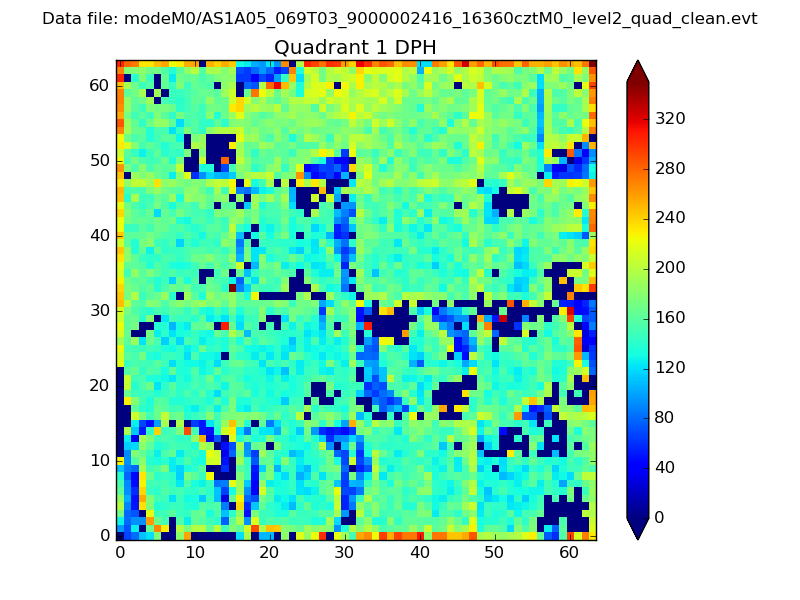 |
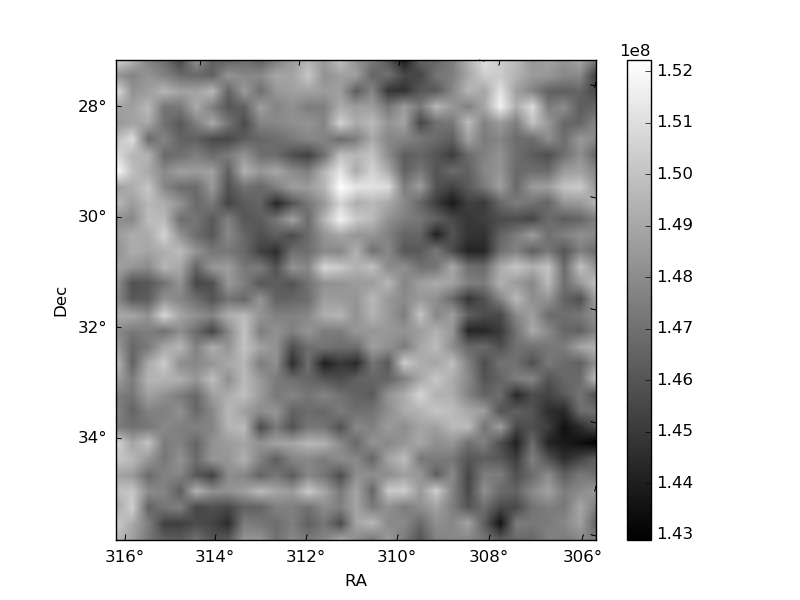
Quadrant B |
|---|---|---|---|
| Quadrant D | 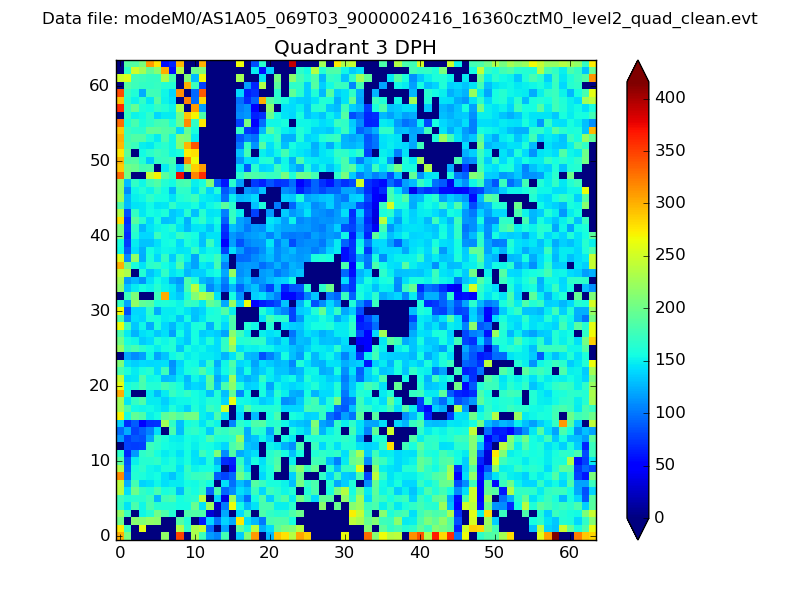 |
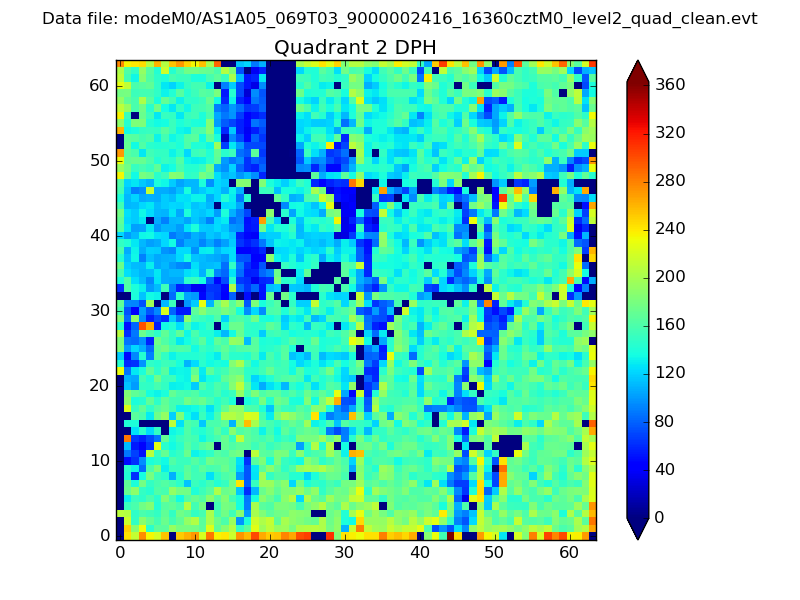 |
Quadrant C |
| Plot type | Count rate plots | Images |
|---|---|---|
| Comparison with Poisson distribution Blue bars denote a histogram of data divided into 1 sec bins. Red curve is a Poisson curve with rate = median count rate of data. |
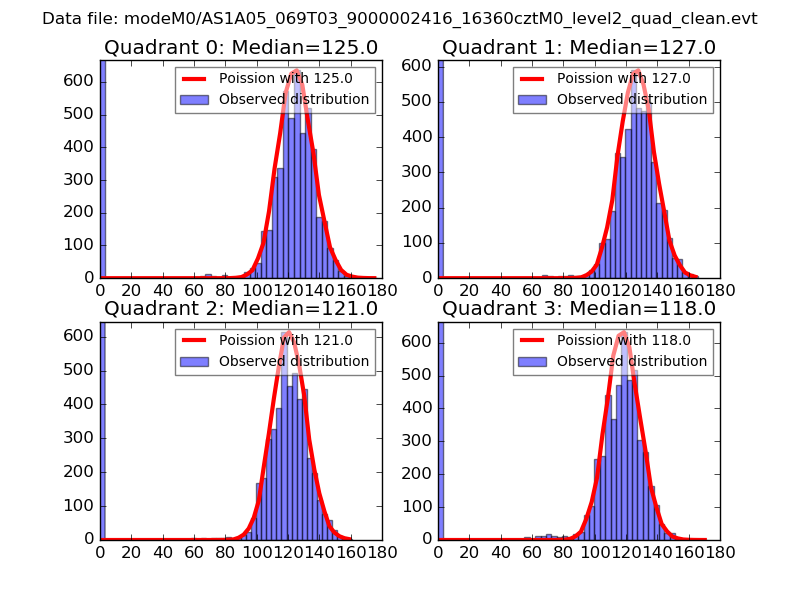 |
 |
| Quadrant-wise count rates Data is divided into 100 sec bins |
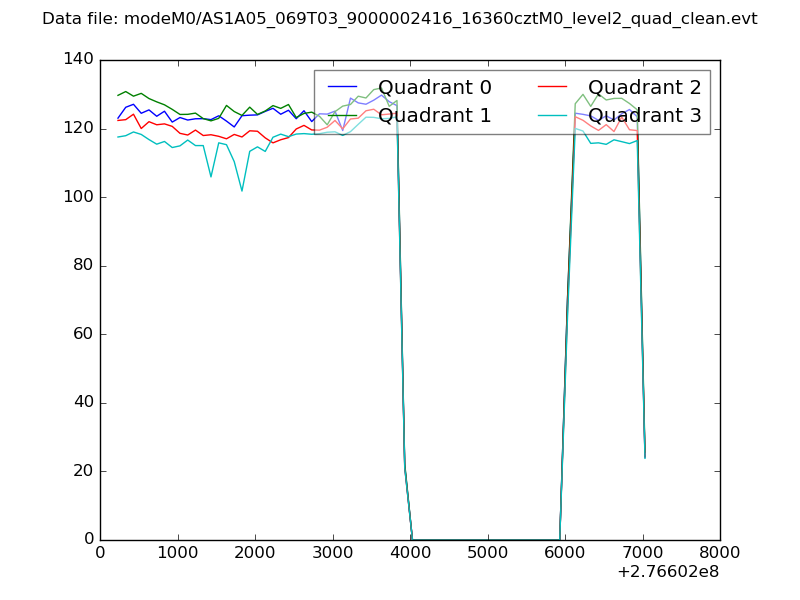 |
|
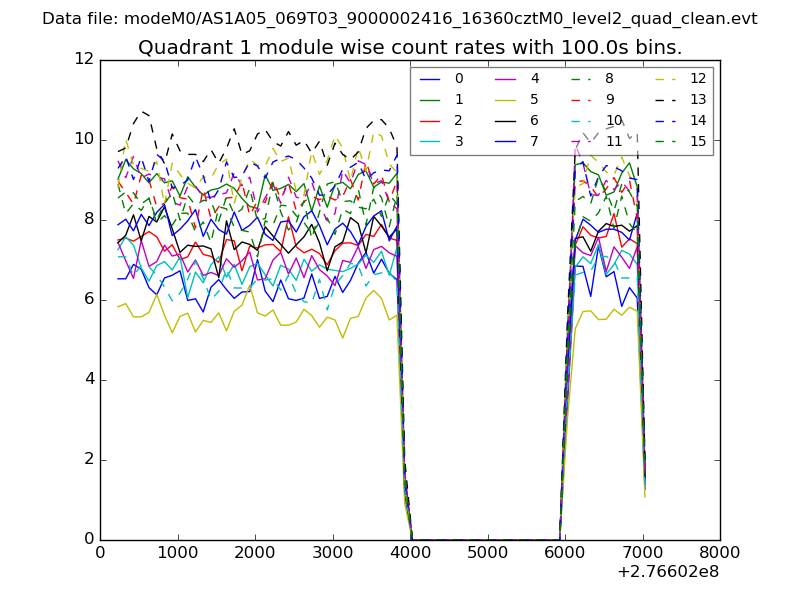
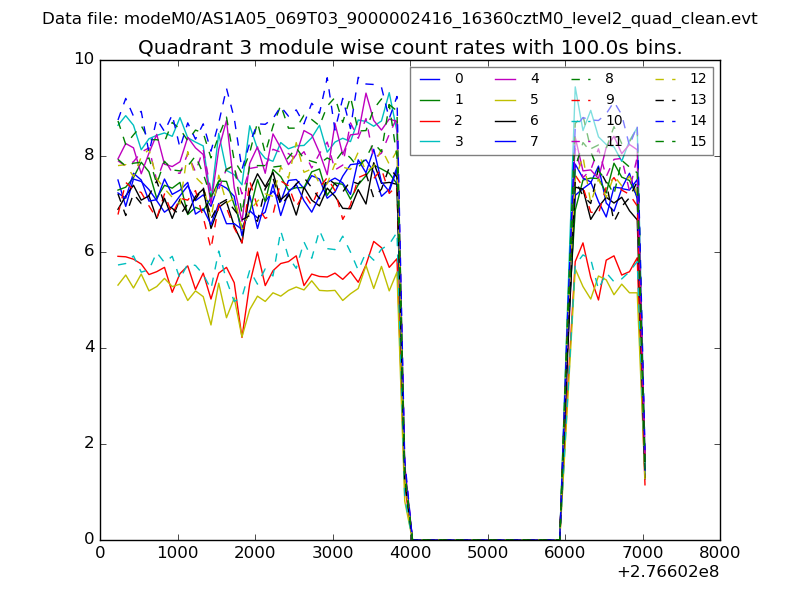
| Module-wise count rates for Quadrant A Data is divided into 100 sec bins |
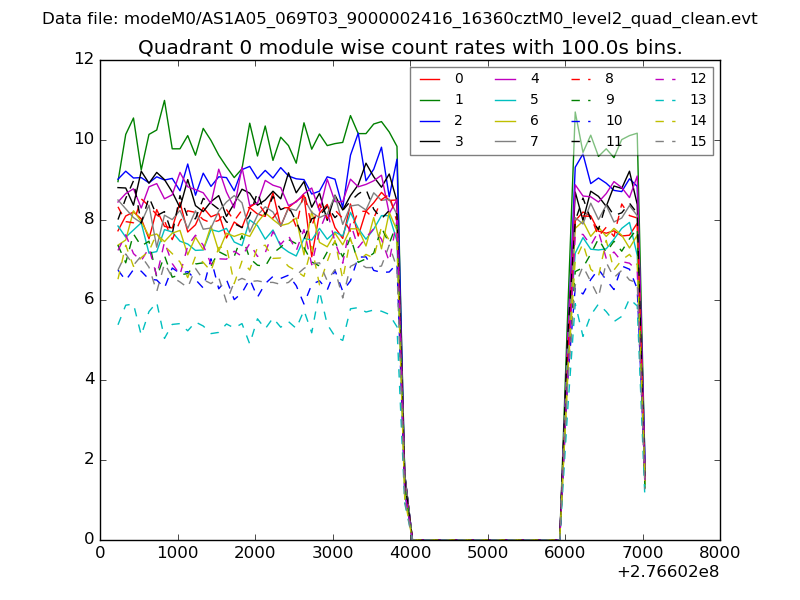 |
 |
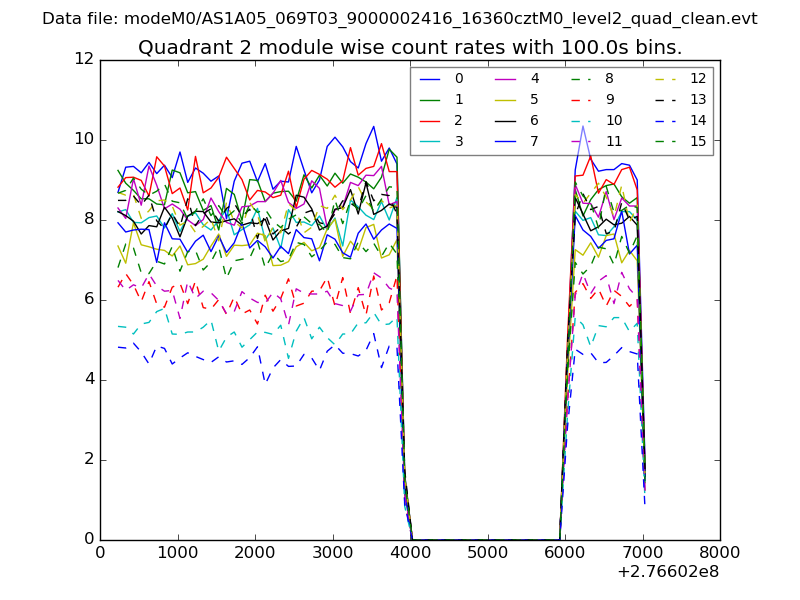
| Module-wise count rates for Quadrant B Data is divided into 100 sec bins |
 |
 |
| Module-wise count rates for Quadrant C Data is divided into 100 sec bins |
 |
 |
| Module-wise count rates for Quadrant D Data is divided into 100 sec bins |
 |
 |
| Parameter | Plot |
|---|---|
| CZT HV Monitor | 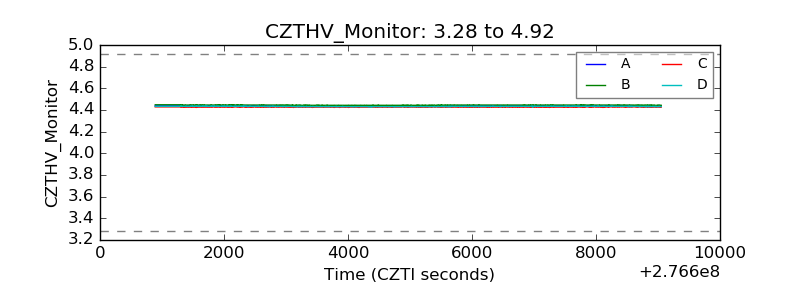 |
| D_VDD | 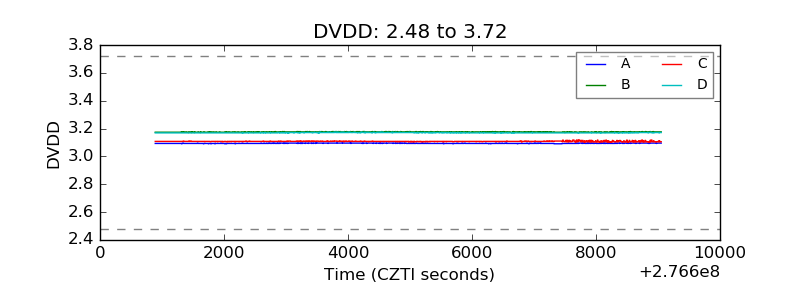 |
| Temperature 1 | 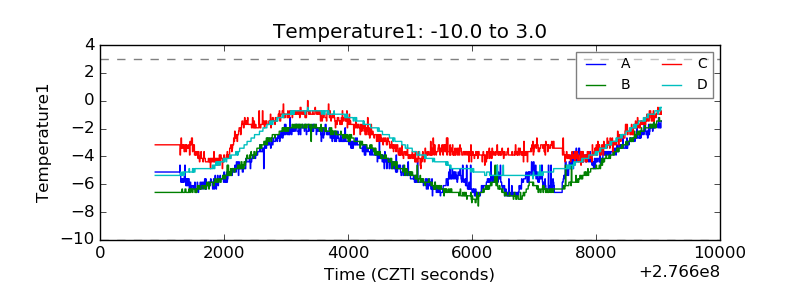 |
| Veto HV Monitor | 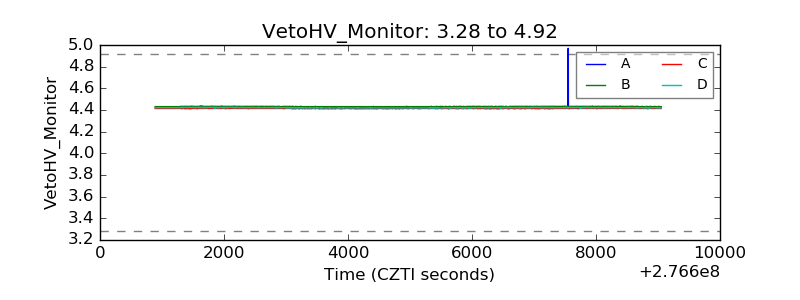 |
| Veto LLD | 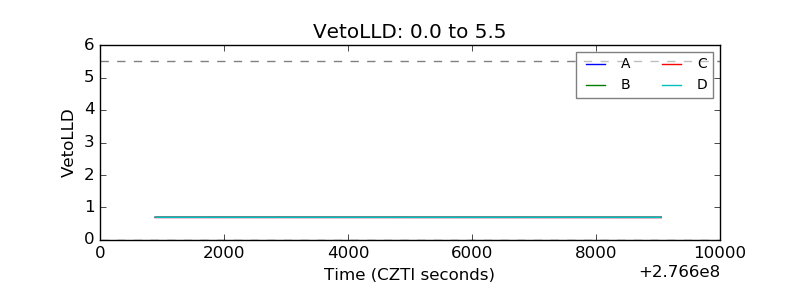 |
| Alpha Counter | 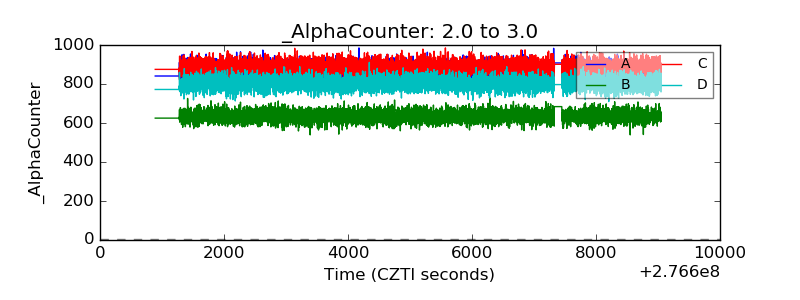 |
| _CPM_Rate | 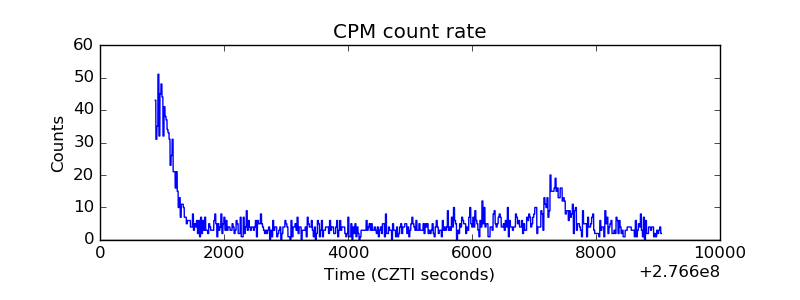 |
| CZT Counter | 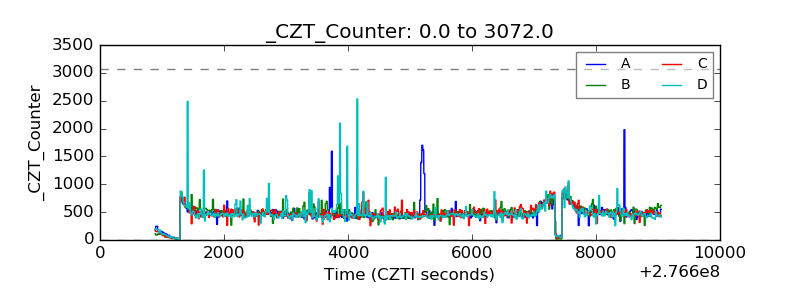 |
| +2.5 Volts monitor |  |
| +5 Volts monitor |  |
| _ROLL_ROT | 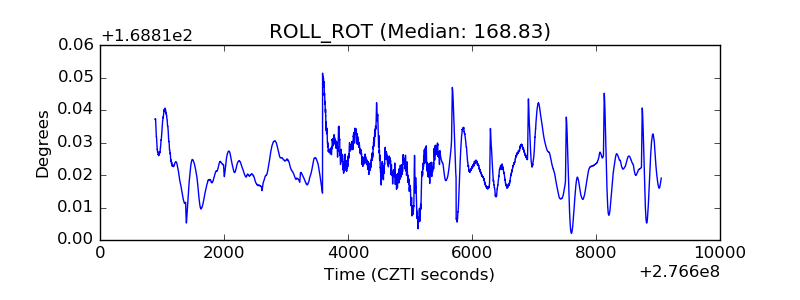 |
| _Roll_DEC | 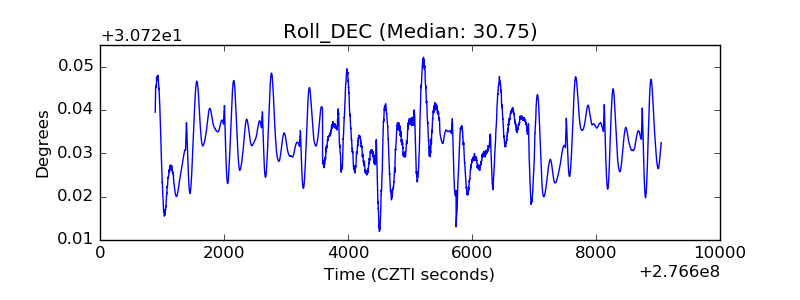 |
| _Roll_RA | 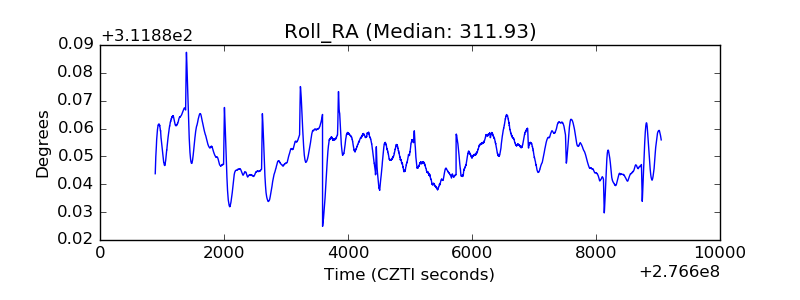 |
| Veto Counter | 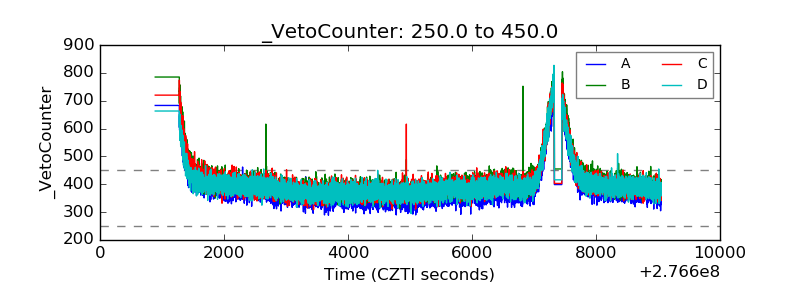 |