| Param | Original file | Final file |
|---|---|---|
| Filename | modeM0/AS1A05_069T03_9000002416_16361cztM0_level2.evt | modeM0/AS1A05_069T03_9000002416_16361cztM0_level2_quad_clean.evt |
| Size (bytes) | 599,912,640 | 100,751,040 |
| Size | 572.1 MB | 96.1 MB |
| Events in quadrant A | 5,954,779 | 595,854 |
| Events in quadrant B | 4,048,164 | 665,176 |
| Events in quadrant C | 3,865,536 | 631,404 |
| Events in quadrant D | 3,776,564 | 622,147 |
| Mode M0 | |||
|---|---|---|---|
| Quadrant | BADHDUFLAG | Total packets | Discarded packets |
| A | 0 | 22923 | 2 |
| B | 0 | 16796 | 1 |
| C | 0 | 16252 | 1 |
| D | 0 | 16542 | 1 |
| Mode SS | |||
|---|---|---|---|
| Quadrant | BADHDUFLAG | Total packets | Discarded packets |
| A | 0 | 158 | 0 |
| B | 0 | 158 | 0 |
| C | 0 | 158 | 0 |
| D | 0 | 158 | 0 |
| Mode M9 | |||
|---|---|---|---|
| Quadrant | BADHDUFLAG | Total packets | Discarded packets |
| A | 0 | 2 | 0 |
| B | 0 | 2 | 0 |
| C | 0 | 2 | 0 |
| D | 0 | 2 | 0 |
| Quadrant | Total seconds | Saturated seconds | Saturation percentage |
|---|---|---|---|
| A | 7711 | 1126 | 14.602516% |
| B | 7711 | 198 | 2.567760% |
| C | 7711 | 203 | 2.632603% |
| D | 7711 | 157 | 2.036052% |
Noise dominated data is calculated using 1-second bins in cleaned event files. If a bin has >2000 counts, and if more than 50% of those come from <1% of pixels, then it is considered to be noise-dominated and hence unusable.
| Quadrant | # 1 sec bins | Bins with >0 counts | Bins with >2000 counts | High rate bins dominated by noise | Noise dominated (total time) | Noise dominated (detector-on time) | Marked lightcurve |
|---|---|---|---|---|---|---|---|
| A | 7827 | 7715 | 635 | 635 | 8.11% | 8.23% | 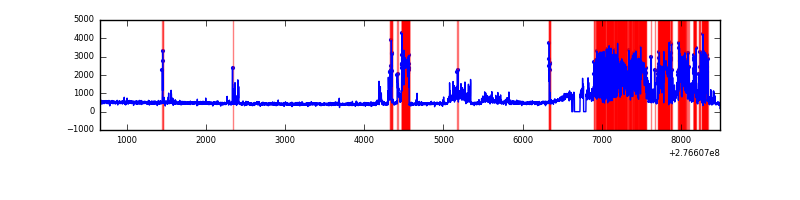 |
| B | 7827 | 7715 | 20 | 20 | 0.26% | 0.26% | 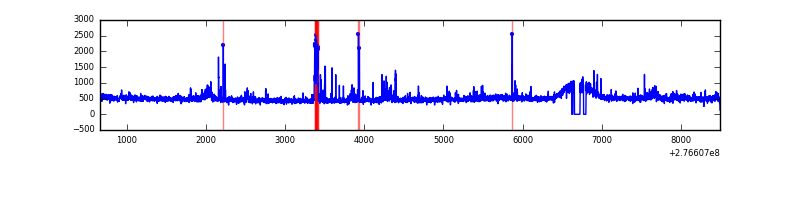 |
| C | 7827 | 7715 | 0 | 0 | 0.00% | 0.00% |  |
| D | 7827 | 7715 | 24 | 24 | 0.31% | 0.31% | 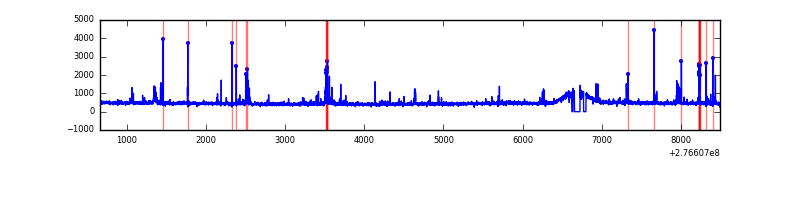 |
Top three noisy pixels from each quadrant. If the there are fewer than three noisy pixels in the level2.evt file, extra rows are filled as -1
| Pixel properties | Quadrant properties | ||||||
|---|---|---|---|---|---|---|---|
| Quadrant | DetID | PixID | Counts | Sigma | Mean | Median | Sigma |
| A | 15 | 174 | 2500784 | 13897.1 | 896 | 875 | 179.9 |
| A | 0 | 226 | 7900 | 39.05 | 896 | 875 | 179.9 |
| A | 15 | 223 | 7091 | 34.55 | 896 | 875 | 179.9 |
| B | 10 | 16 | 137540 | 752.08 | 944 | 917 | 181.7 |
| B | 0 | 189 | 68352 | 371.22 | 944 | 917 | 181.7 |
| B | 15 | 35 | 52997 | 286.69 | 944 | 917 | 181.7 |
| C | 3 | 233 | 186032 | 864.69 | 905 | 910 | 214.1 |
| C | 14 | 238 | 140228 | 650.74 | 905 | 910 | 214.1 |
| C | 13 | 61 | 6453 | 25.89 | 905 | 910 | 214.1 |
| D | 1 | 52 | 102142 | 423.83 | 920 | 897 | 238.9 |
| D | 12 | 218 | 88874 | 368.29 | 920 | 897 | 238.9 |
| D | 10 | 70 | 73588 | 304.3 | 920 | 897 | 238.9 |
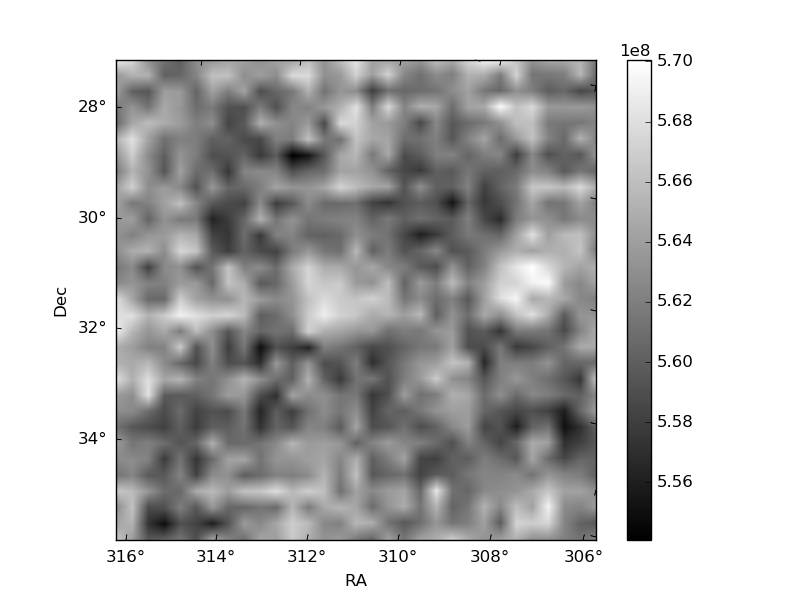
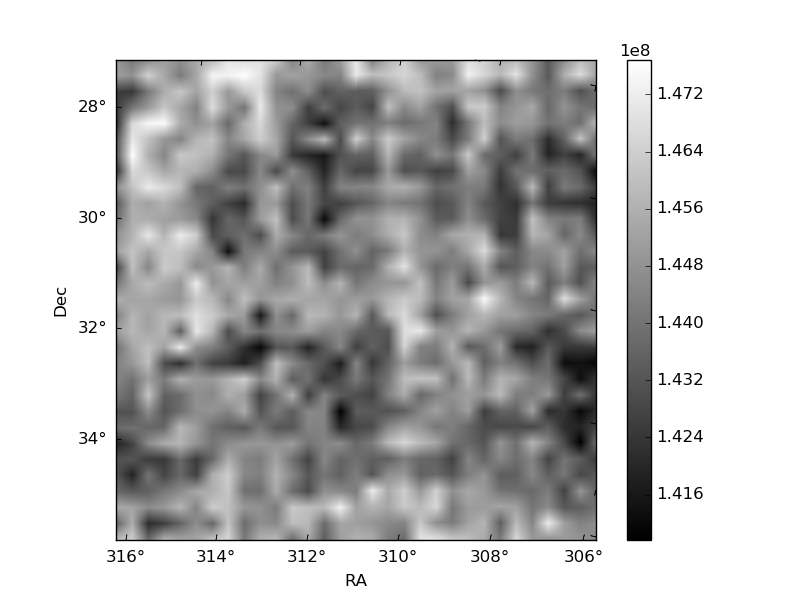
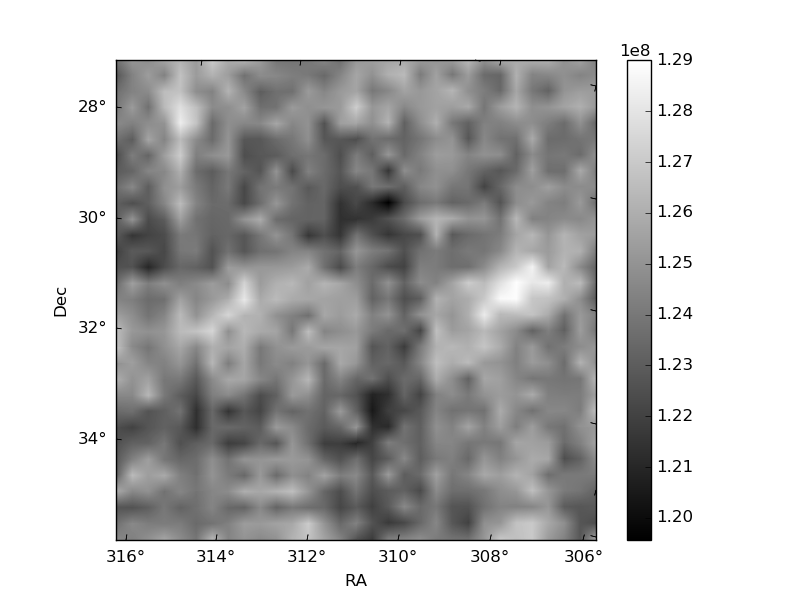
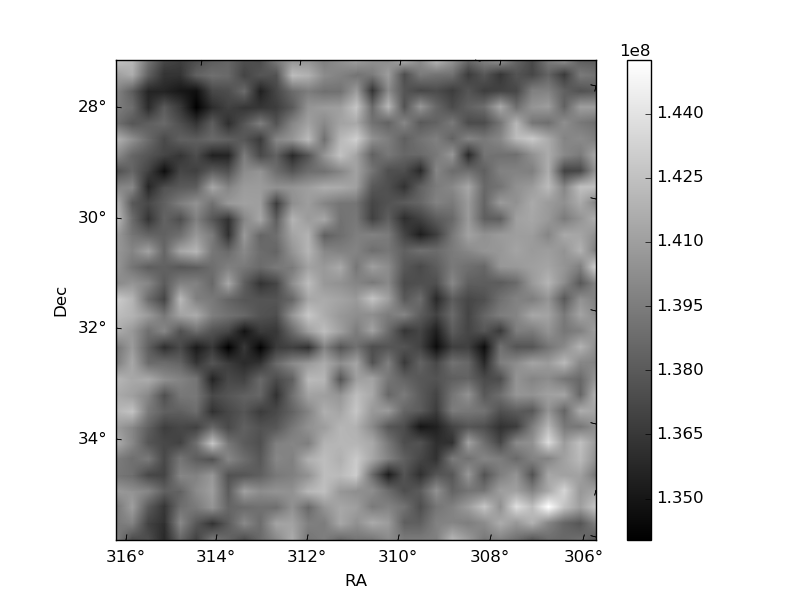
Histogram calculated using DETX and DETY for each event in the final _common_clean file
| Quadrant A |  |
 |
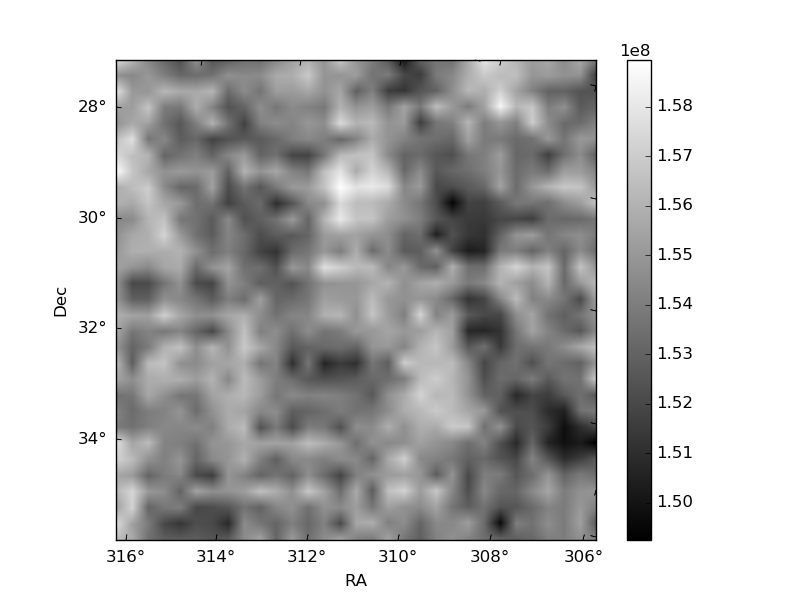
Quadrant B |
|---|---|---|---|
| Quadrant D | 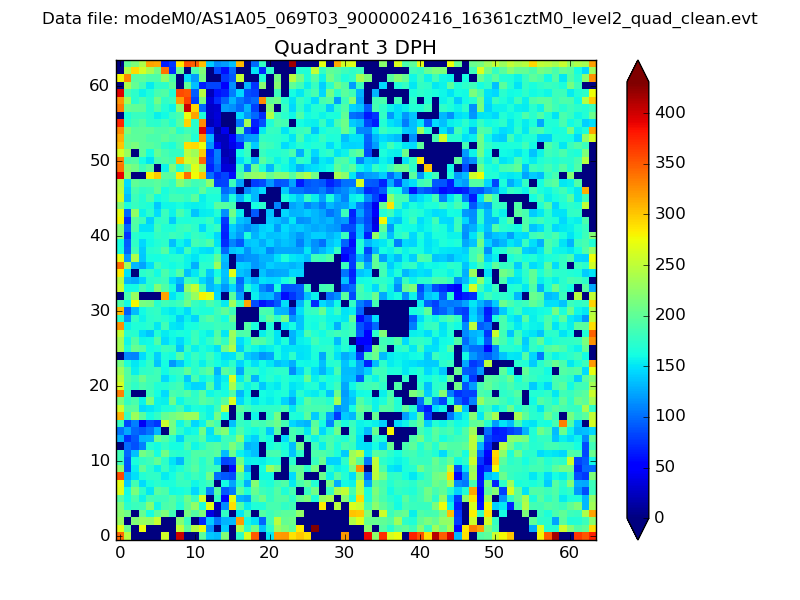 |
 |
Quadrant C |
| Plot type | Count rate plots | Images |
|---|---|---|
| Comparison with Poisson distribution Blue bars denote a histogram of data divided into 1 sec bins. Red curve is a Poisson curve with rate = median count rate of data. |
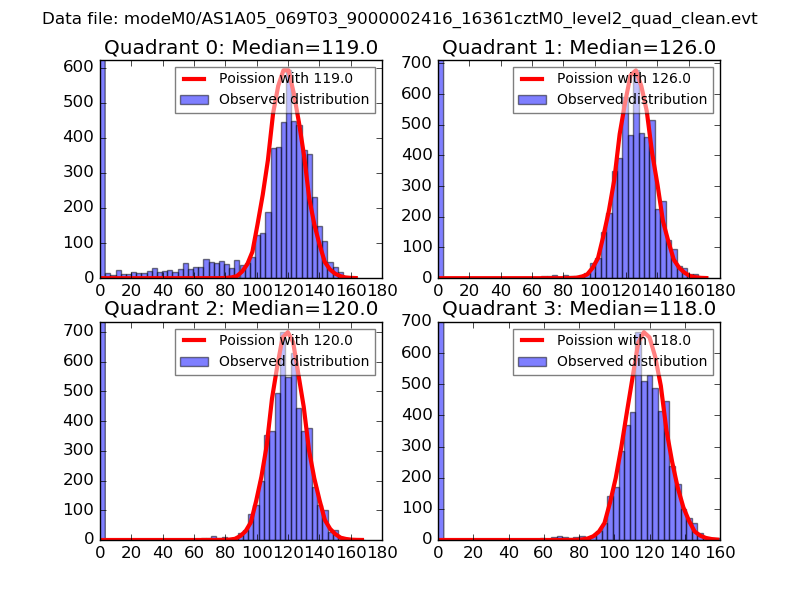 |
 |
| Quadrant-wise count rates Data is divided into 100 sec bins |
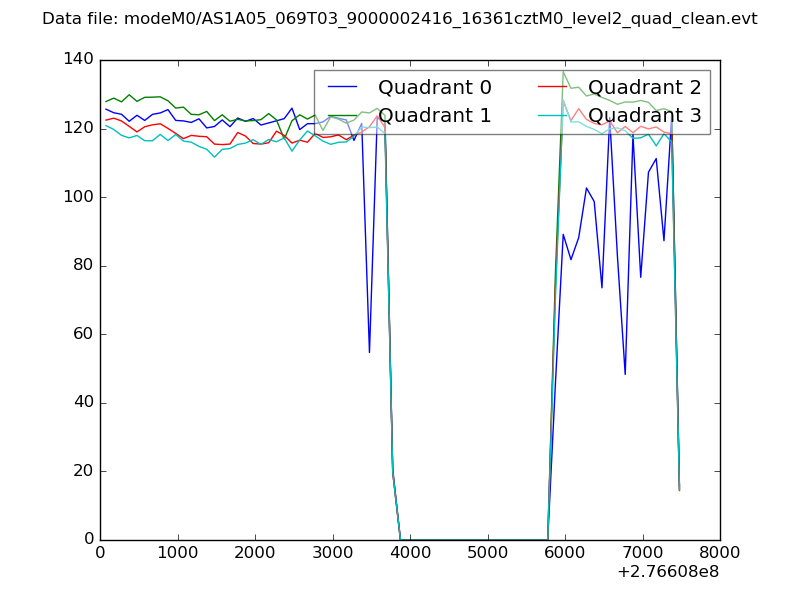 |
|
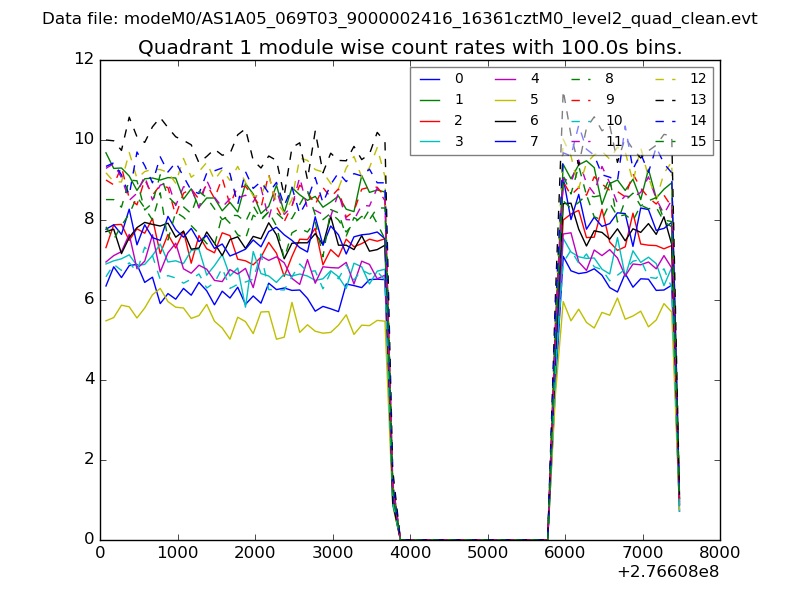
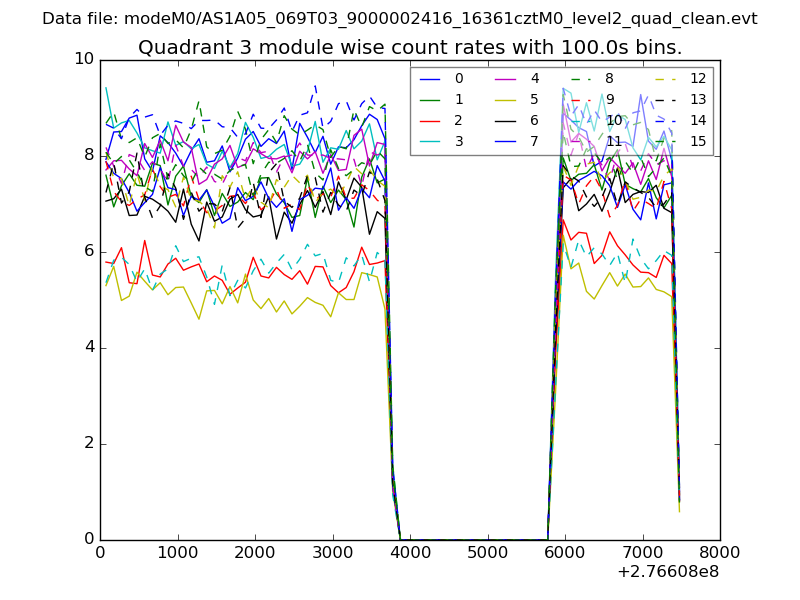
| Module-wise count rates for Quadrant A Data is divided into 100 sec bins |
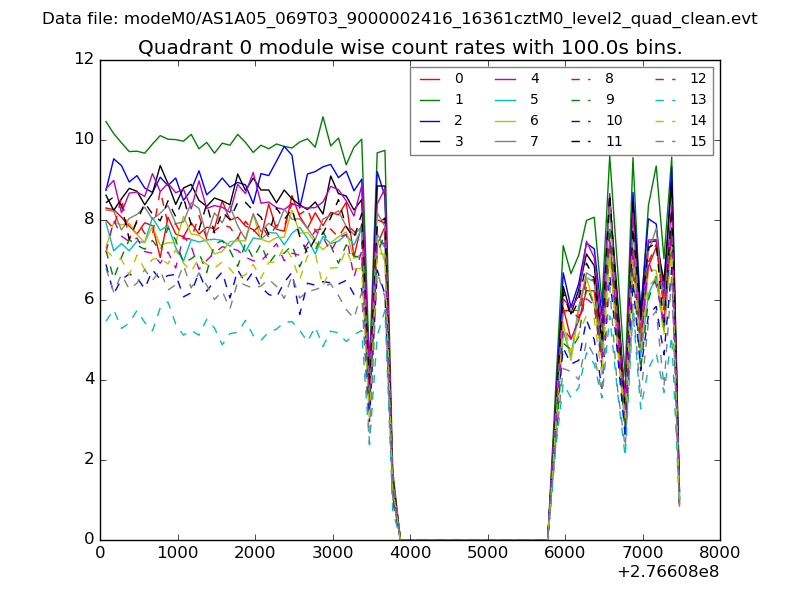 |
 |
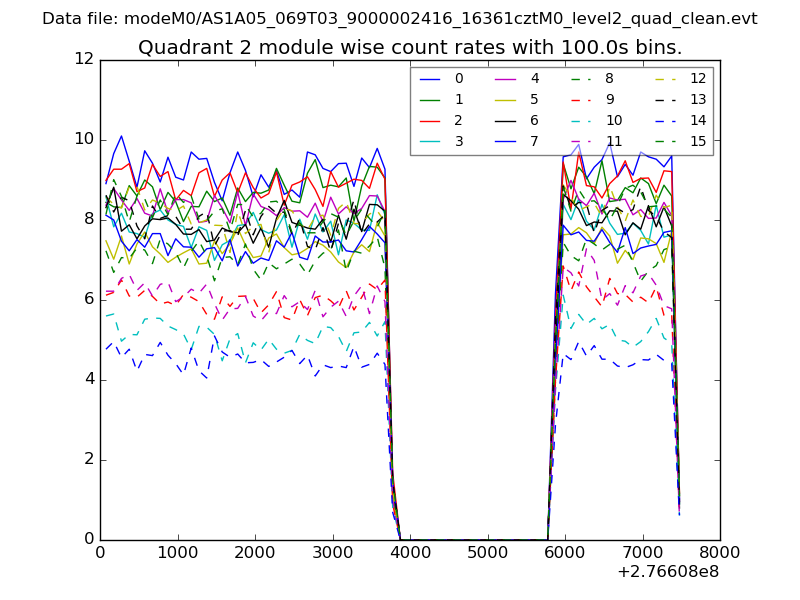
| Module-wise count rates for Quadrant B Data is divided into 100 sec bins |
 |
 |
| Module-wise count rates for Quadrant C Data is divided into 100 sec bins |
 |
 |
| Module-wise count rates for Quadrant D Data is divided into 100 sec bins |
 |
 |
| Parameter | Plot |
|---|---|
| CZT HV Monitor | 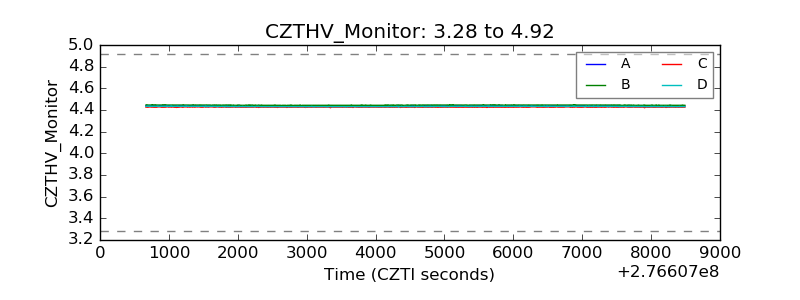 |
| D_VDD | 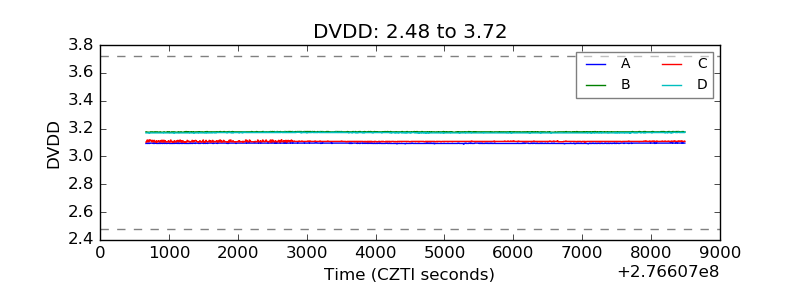 |
| Temperature 1 |  |
| Veto HV Monitor | 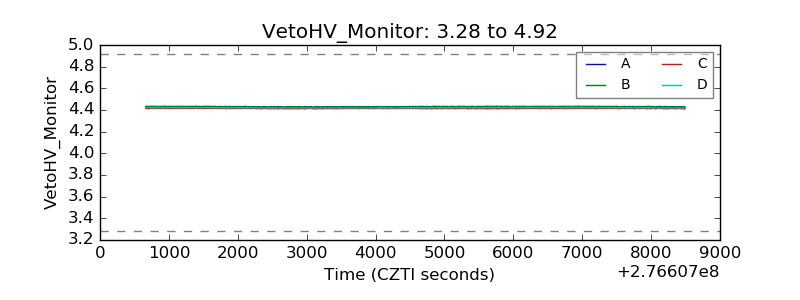 |
| Veto LLD | 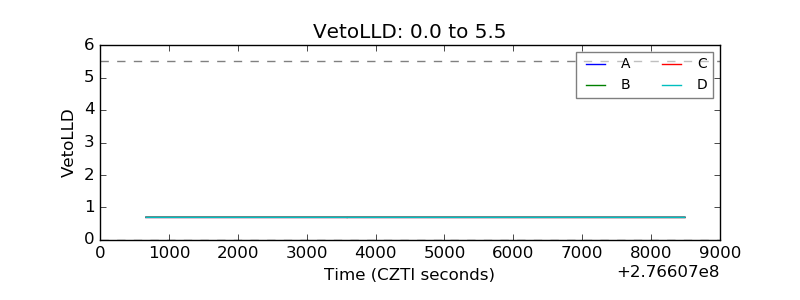 |
| Alpha Counter | 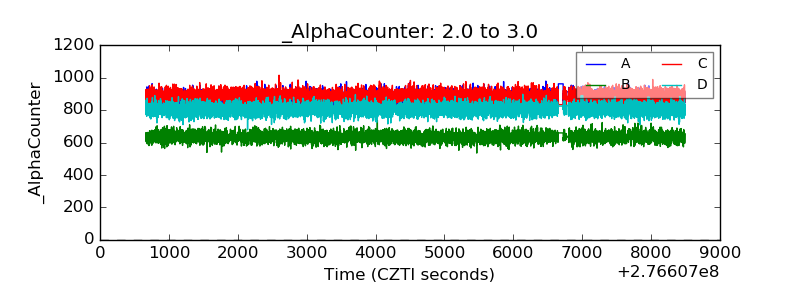 |
| _CPM_Rate | 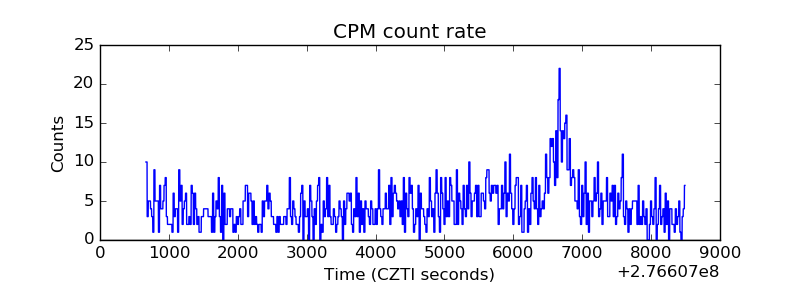 |
| CZT Counter | 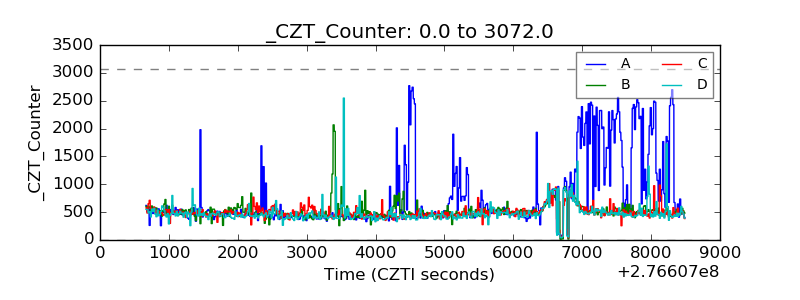 |
| +2.5 Volts monitor |  |
| +5 Volts monitor | 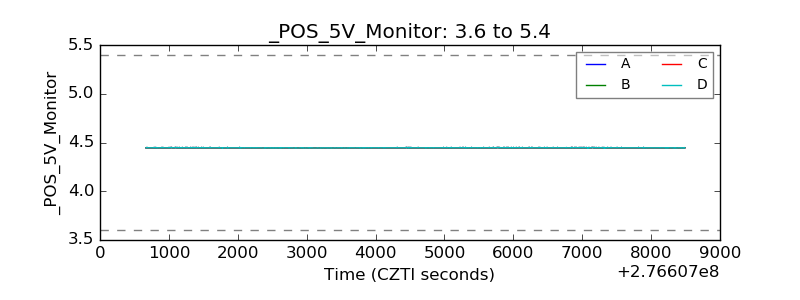 |
| _ROLL_ROT | 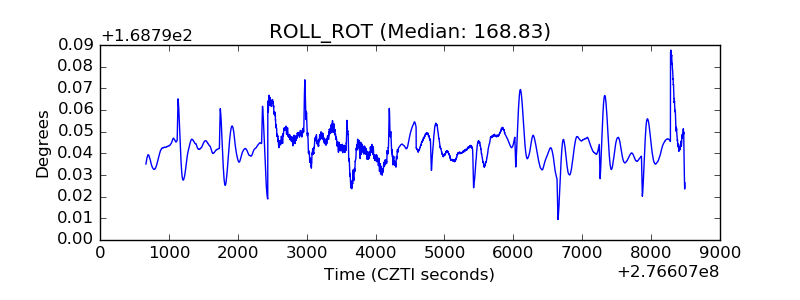 |
| _Roll_DEC | 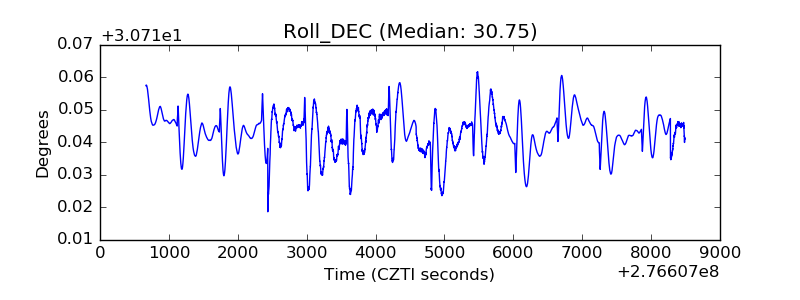 |
| _Roll_RA | 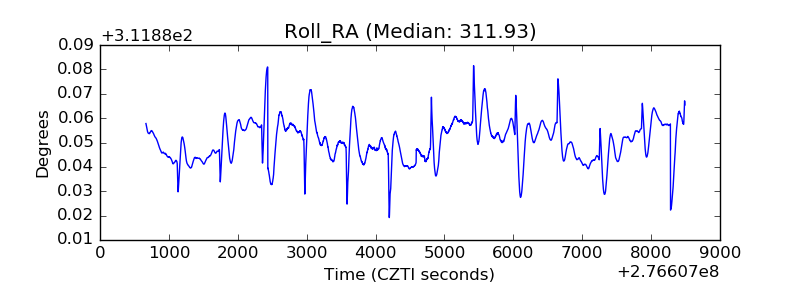 |
| Veto Counter | 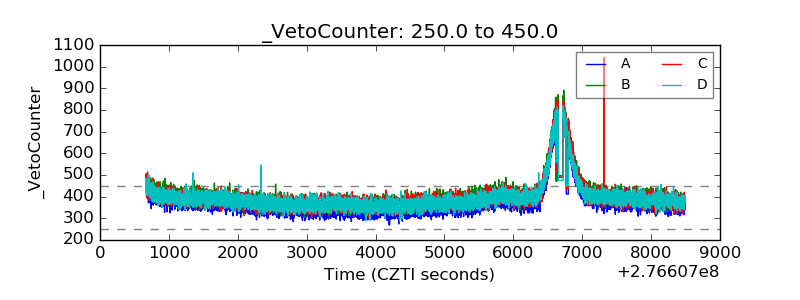 |