| Param | Original file | Final file |
|---|---|---|
| Filename | modeM0/AS1A05_069T03_9000002416_16364cztM0_level2.evt | modeM0/AS1A05_069T03_9000002416_16364cztM0_level2_quad_clean.evt |
| Size (bytes) | 1,438,464,960 | 236,684,160 |
| Size | 1.3 GB | 225.7 MB |
| Events in quadrant A | 13,064,689 | 1,448,777 |
| Events in quadrant B | 9,792,633 | 1,534,974 |
| Events in quadrant C | 9,961,747 | 1,466,323 |
| Events in quadrant D | 9,487,550 | 1,435,288 |
| Mode M0 | |||
|---|---|---|---|
| Quadrant | BADHDUFLAG | Total packets | Discarded packets |
| A | 0 | 51636 | 4 |
| B | 0 | 41025 | 3 |
| C | 0 | 41684 | 3 |
| D | 0 | 41428 | 3 |
| Mode SS | |||
|---|---|---|---|
| Quadrant | BADHDUFLAG | Total packets | Discarded packets |
| A | 0 | 378 | 0 |
| B | 0 | 378 | 0 |
| C | 0 | 378 | 0 |
| D | 0 | 378 | 0 |
| Mode M9 | |||
|---|---|---|---|
| Quadrant | BADHDUFLAG | Total packets | Discarded packets |
| A | 0 | 17 | 0 |
| B | 0 | 17 | 0 |
| C | 0 | 17 | 0 |
| D | 0 | 17 | 0 |
| Quadrant | Total seconds | Saturated seconds | Saturation percentage |
|---|---|---|---|
| A | 18616 | 1734 | 9.314568% |
| B | 18616 | 259 | 1.391276% |
| C | 18616 | 196 | 1.052858% |
| D | 18616 | 417 | 2.240009% |
Noise dominated data is calculated using 1-second bins in cleaned event files. If a bin has >2000 counts, and if more than 50% of those come from <1% of pixels, then it is considered to be noise-dominated and hence unusable.
| Quadrant | # 1 sec bins | Bins with >0 counts | Bins with >2000 counts | High rate bins dominated by noise | Noise dominated (total time) | Noise dominated (detector-on time) | Marked lightcurve |
|---|---|---|---|---|---|---|---|
| A | 20357 | 18620 | 1171 | 1171 | 5.75% | 6.29% | 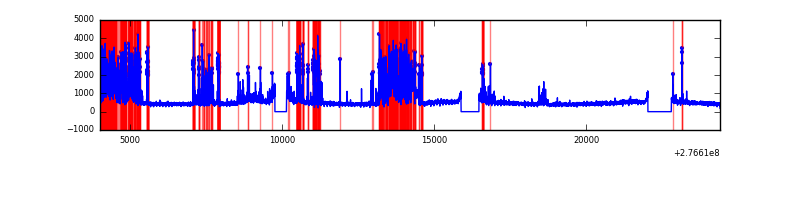 |
| B | 20357 | 18619 | 67 | 67 | 0.33% | 0.36% | 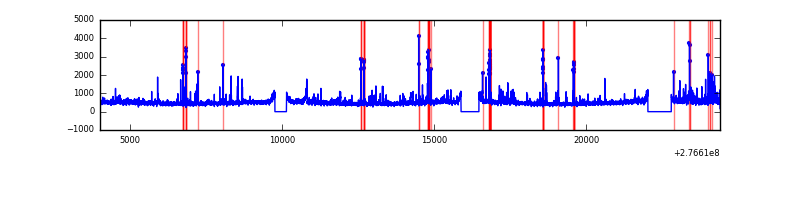 |
| C | 20357 | 18620 | 0 | 0 | 0.00% | 0.00% | 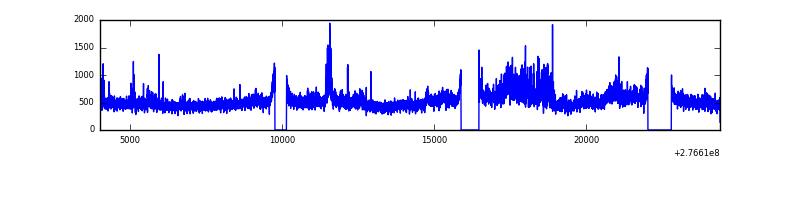 |
| D | 20357 | 18620 | 256 | 256 | 1.26% | 1.37% | 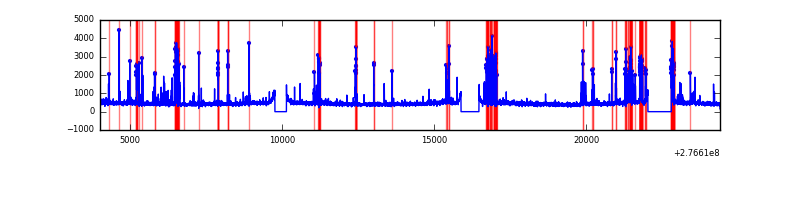 |
Top three noisy pixels from each quadrant. If the there are fewer than three noisy pixels in the level2.evt file, extra rows are filled as -1
| Pixel properties | Quadrant properties | ||||||
|---|---|---|---|---|---|---|---|
| Quadrant | DetID | PixID | Counts | Sigma | Mean | Median | Sigma |
| A | 15 | 174 | 4827192 | 11230.24 | 2132 | 2084 | 429.7 |
| A | 9 | 143 | 24576 | 52.35 | 2132 | 2084 | 429.7 |
| A | 0 | 226 | 18507 | 38.22 | 2132 | 2084 | 429.7 |
| B | 0 | 189 | 283304 | 671.42 | 2211 | 2154 | 418.7 |
| B | 10 | 16 | 270308 | 640.39 | 2211 | 2154 | 418.7 |
| B | 15 | 35 | 171788 | 405.11 | 2211 | 2154 | 418.7 |
| C | 3 | 233 | 1345594 | 2710.19 | 2124 | 2138 | 495.7 |
| C | 14 | 238 | 324971 | 651.26 | 2124 | 2138 | 495.7 |
| C | 13 | 61 | 14845 | 25.63 | 2124 | 2138 | 495.7 |
| D | 10 | 70 | 595836 | 1060.3 | 2127 | 2076 | 560.0 |
| D | 12 | 110 | 277789 | 492.35 | 2127 | 2076 | 560.0 |
| D | 1 | 52 | 232572 | 411.6 | 2127 | 2076 | 560.0 |
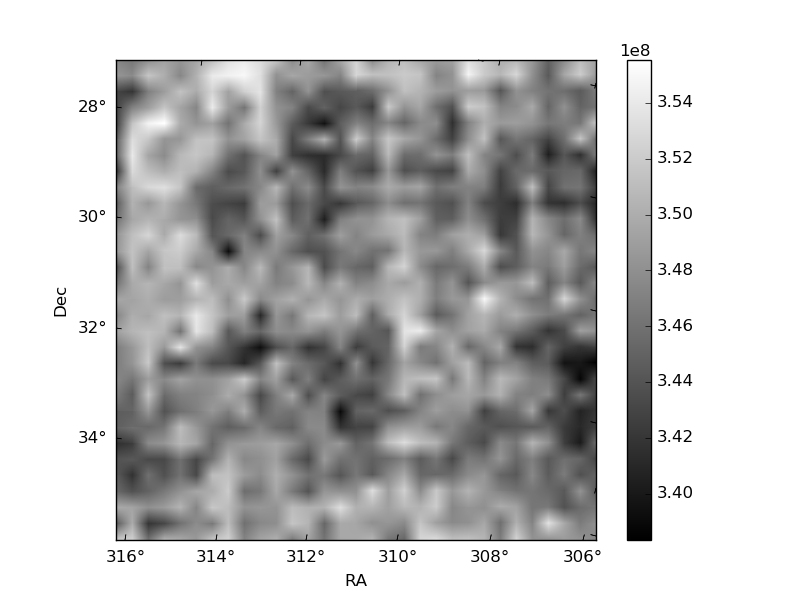
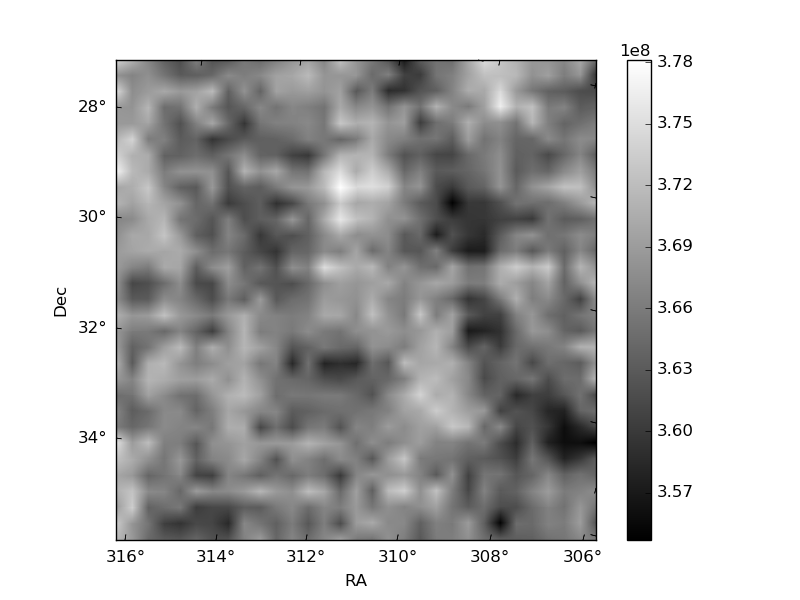
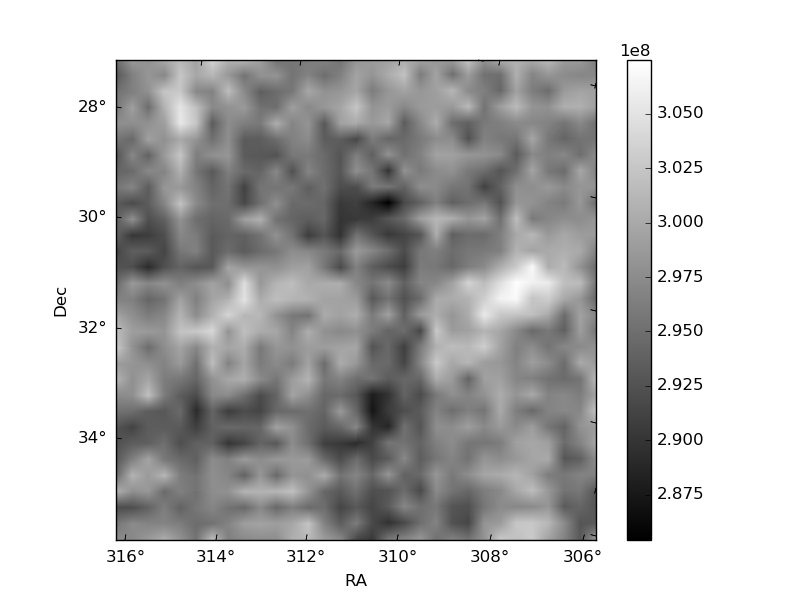
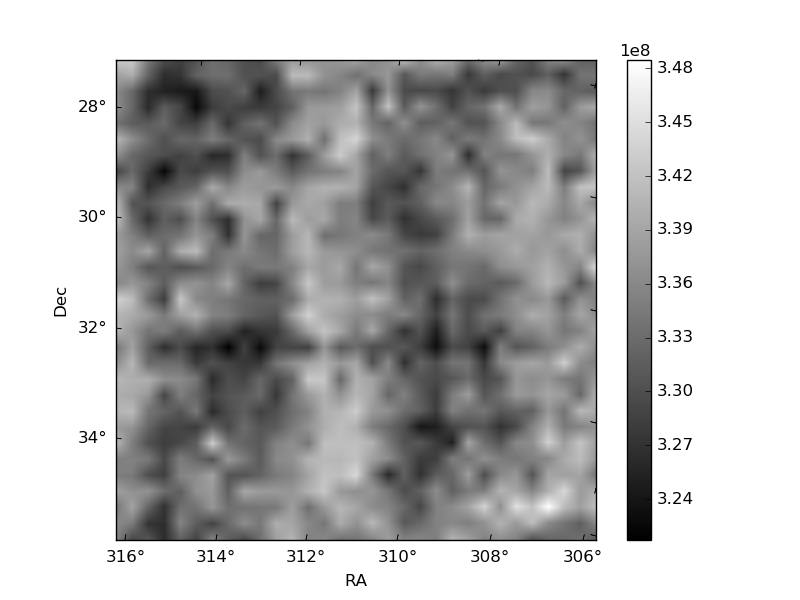
Histogram calculated using DETX and DETY for each event in the final _common_clean file
| Quadrant A |  |
 |
Quadrant B |
|---|---|---|---|
| Quadrant D |  |
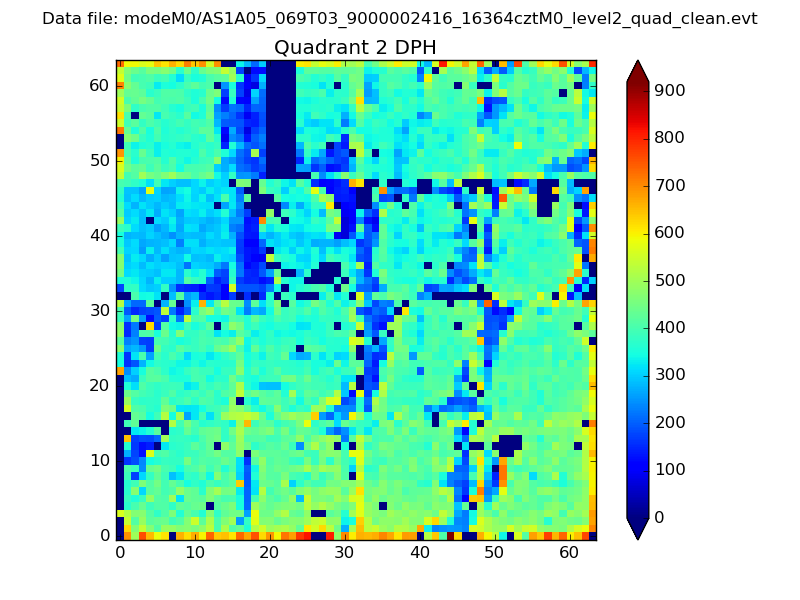 |
Quadrant C |
| Plot type | Count rate plots | Images |
|---|---|---|
| Comparison with Poisson distribution Blue bars denote a histogram of data divided into 1 sec bins. Red curve is a Poisson curve with rate = median count rate of data. |
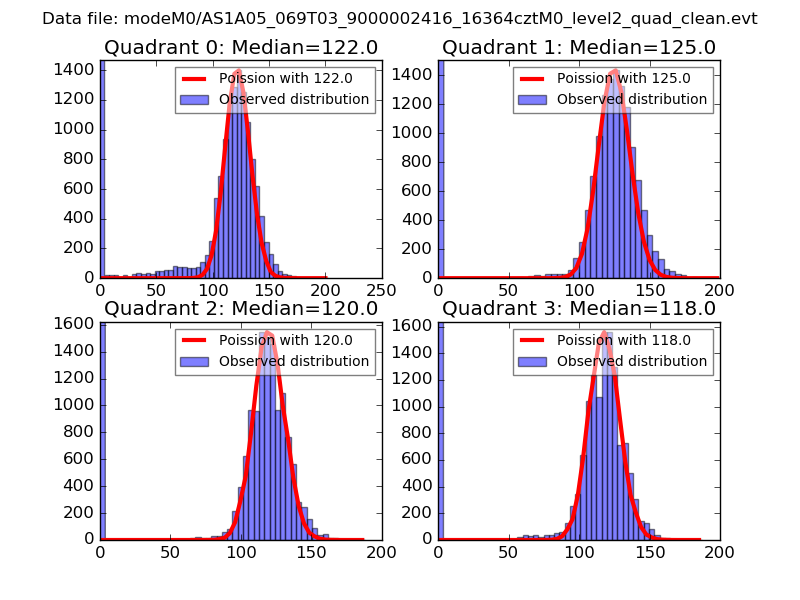 |
 |
| Quadrant-wise count rates Data is divided into 100 sec bins |
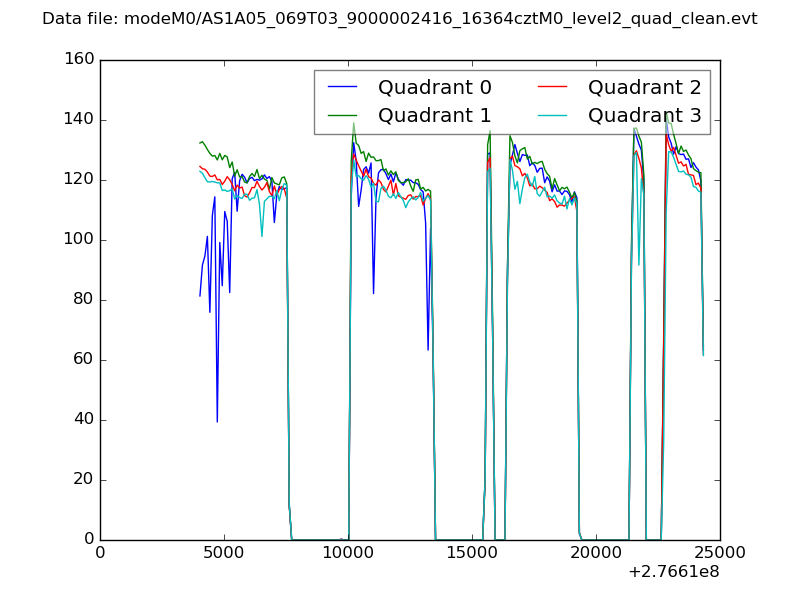 |
|
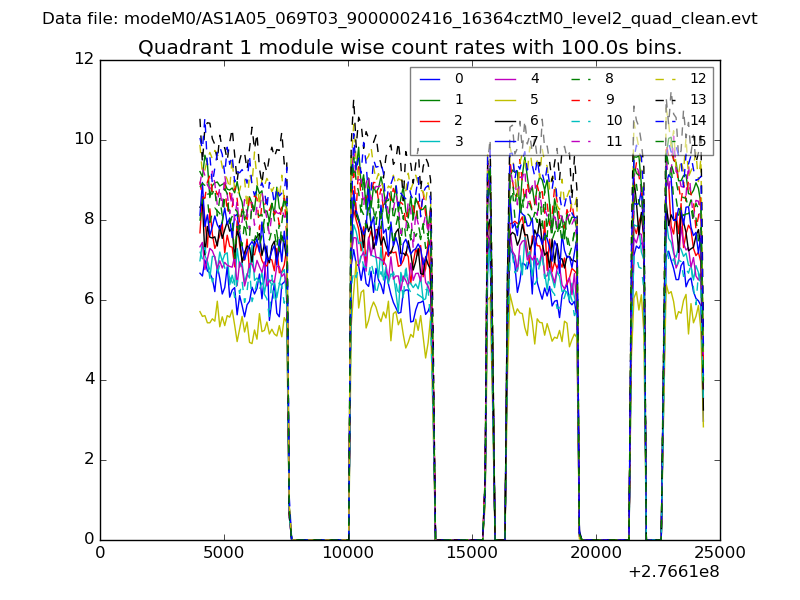
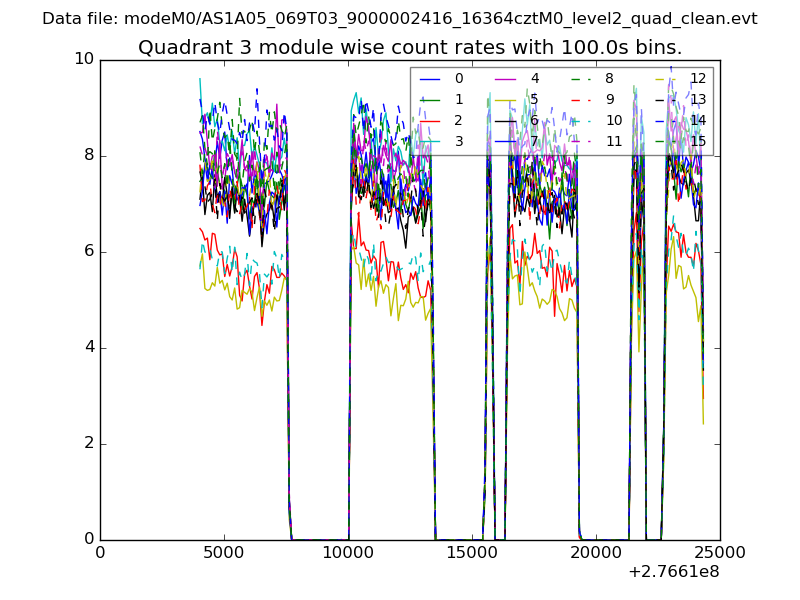
| Module-wise count rates for Quadrant A Data is divided into 100 sec bins |
 |
 |
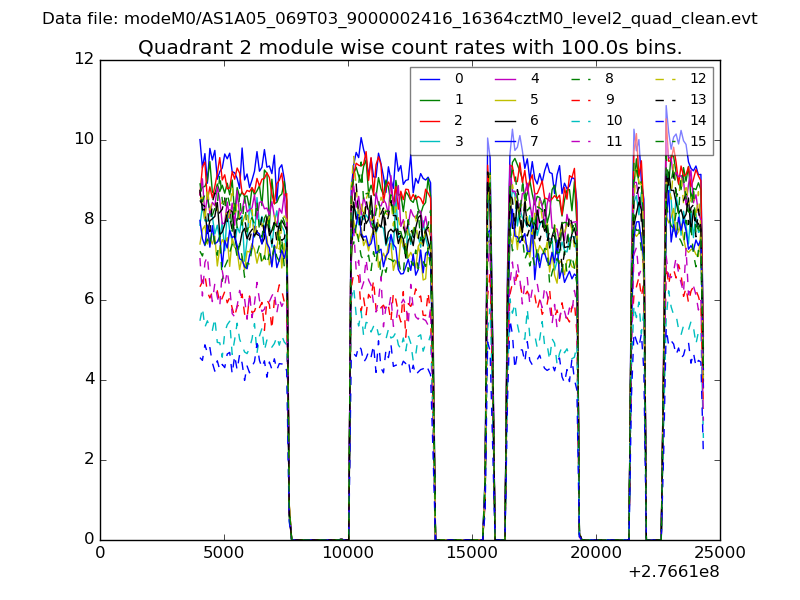
| Module-wise count rates for Quadrant B Data is divided into 100 sec bins |
 |
 |
| Module-wise count rates for Quadrant C Data is divided into 100 sec bins |
 |
 |
| Module-wise count rates for Quadrant D Data is divided into 100 sec bins |
 |
 |
| Parameter | Plot |
|---|---|
| CZT HV Monitor | 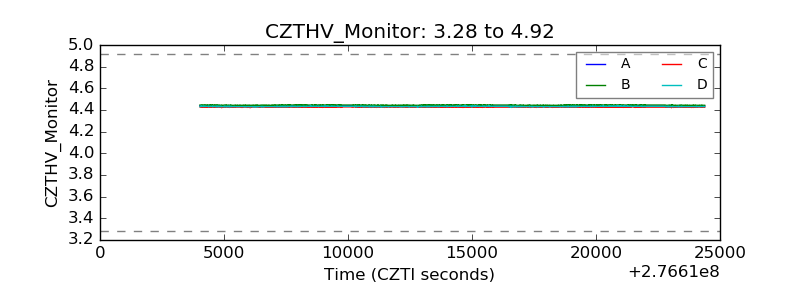 |
| D_VDD | 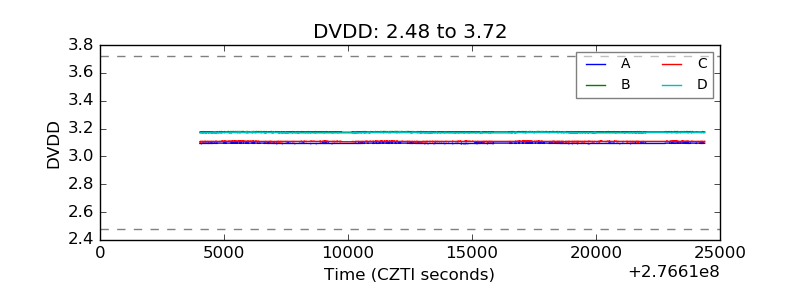 |
| Temperature 1 | 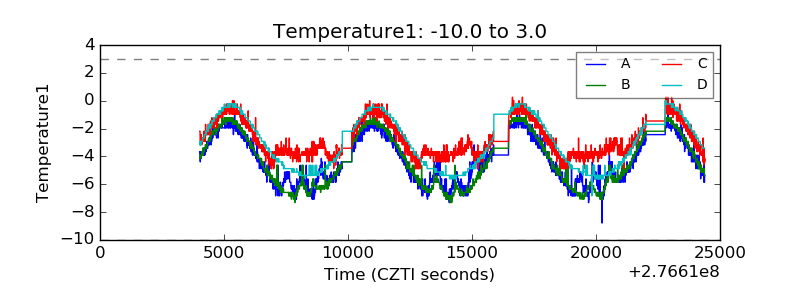 |
| Veto HV Monitor | 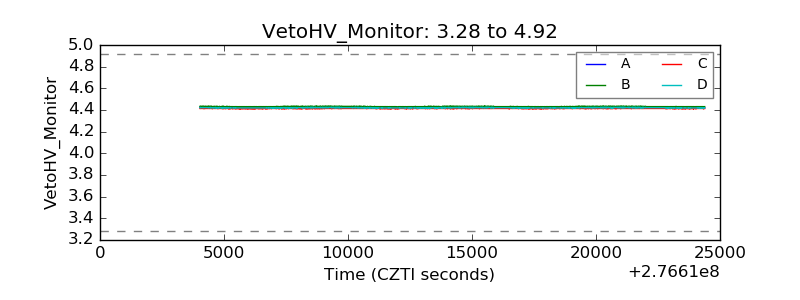 |
| Veto LLD | 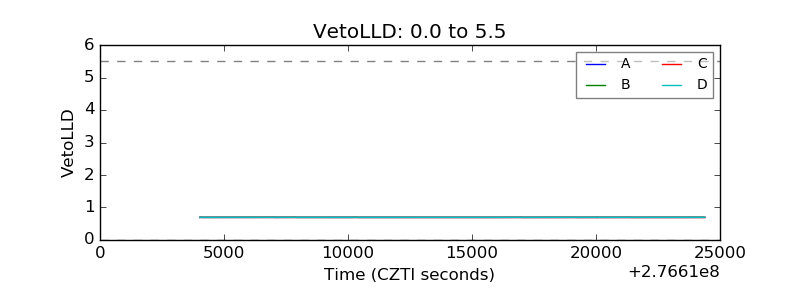 |
| Alpha Counter | 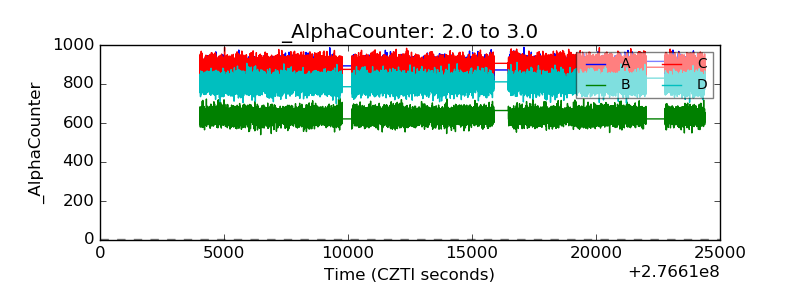 |
| _CPM_Rate | 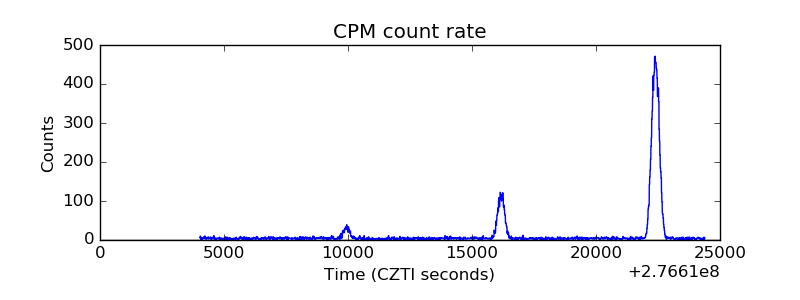 |
| CZT Counter | 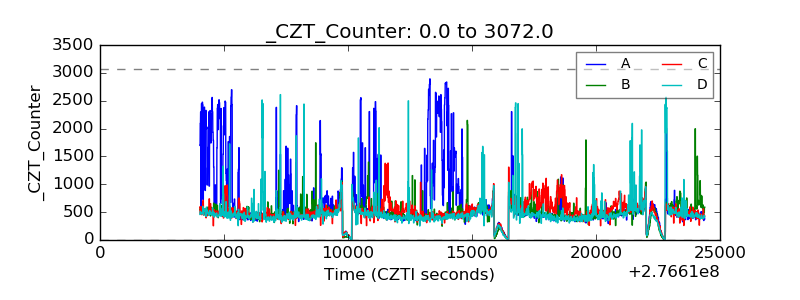 |
| +2.5 Volts monitor |  |
| +5 Volts monitor | 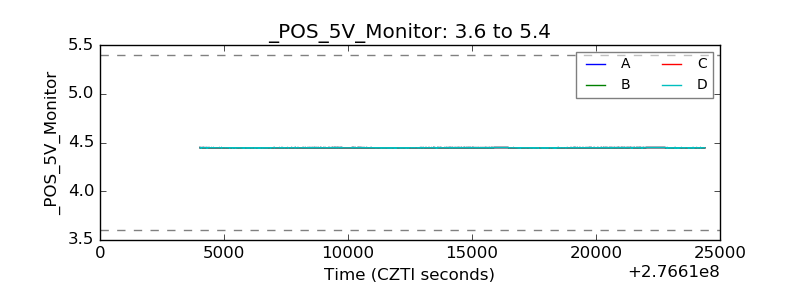 |
| _ROLL_ROT | 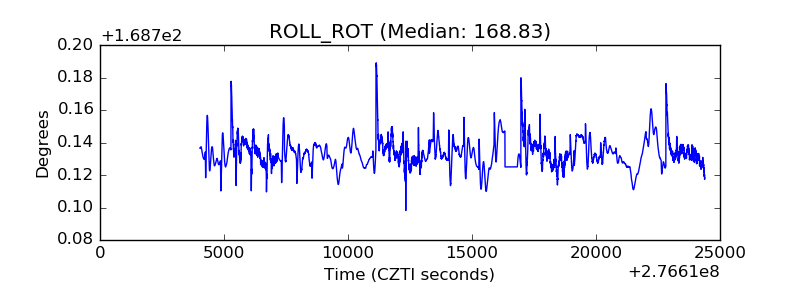 |
| _Roll_DEC | 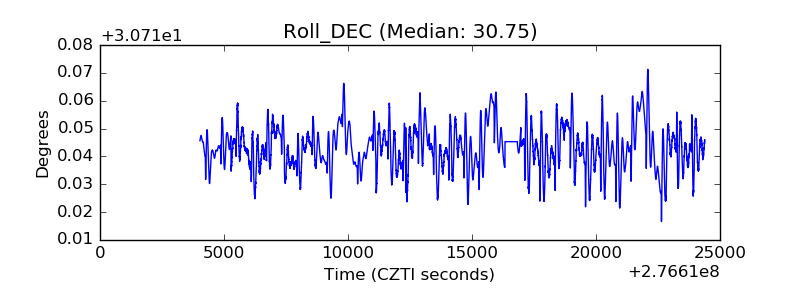 |
| _Roll_RA | 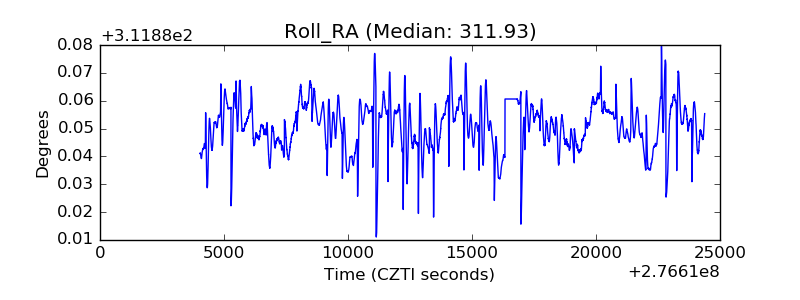 |
| Veto Counter | 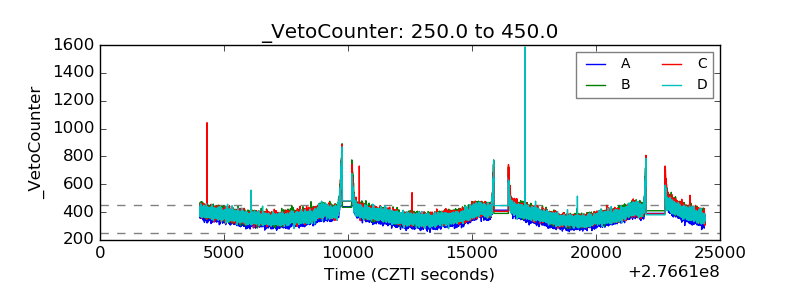 |