| Param | Original file | Final file |
|---|---|---|
| Filename | modeM0/AS1A05_069T04_9000002418cztM0_level2.fits | modeM0/AS1A05_069T04_9000002418cztM0_level2_quad_clean.evt |
| Size (bytes) | 673,724,160 | 623,436,480 |
| Size | 642.5 MB | 594.6 MB |
| Events in quadrant A | 4,141,278 | 3,665,322 |
| Events in quadrant B | 3,975,390 | 3,714,862 |
| Events in quadrant C | 4,016,840 | 3,527,184 |
| Events in quadrant D | 3,500,172 | 3,204,418 |
| Mode M0 | |||
|---|---|---|---|
| Quadrant | BADHDUFLAG | Total packets | Discarded packets |
| A | 0 | 155455 | 0 |
| B | 0 | 163064 | 0 |
| C | 0 | 157919 | 0 |
| D | 0 | 158577 | 0 |
| Mode M9 | |||
|---|---|---|---|
| Quadrant | BADHDUFLAG | Total packets | Discarded packets |
| A | 0 | 108 | 0 |
| B | 0 | 108 | 0 |
| C | 0 | 108 | 0 |
| D | 0 | 108 | 0 |
| Mode SS | |||
|---|---|---|---|
| Quadrant | BADHDUFLAG | Total packets | Discarded packets |
| A | 0 | 1416 | 0 |
| B | 0 | 1416 | 0 |
| C | 0 | 1416 | 0 |
| D | 0 | 1416 | 0 |
| Quadrant | Total seconds | Saturated seconds | Saturation percentage |
|---|---|---|---|
| A | 69534 | 1844 | 2.651940% |
| B | 69534 | 1969 | 2.831708% |
| C | 69534 | 1718 | 2.470734% |
| D | 69534 | 1394 | 2.004775% |
Noise dominated data is calculated using 1-second bins in cleaned event files. If a bin has >2000 counts, and if more than 50% of those come from <1% of pixels, then it is considered to be noise-dominated and hence unusable.
| Quadrant | # 1 sec bins | Bins with >0 counts | Bins with >2000 counts | High rate bins dominated by noise | Noise dominated (total time) | Noise dominated (detector-on time) | Marked lightcurve |
|---|---|---|---|---|---|---|---|
| A | 80409 | 69522 | 0 | 0 | 0.00% | 0.00% |  |
| B | 80409 | 69513 | 0 | 0 | 0.00% | 0.00% |  |
| C | 80409 | 69529 | 0 | 0 | 0.00% | 0.00% |  |
| D | 80409 | 69525 | 0 | 0 | 0.00% | 0.00% |  |
Top three noisy pixels from each quadrant. If the there are fewer than three noisy pixels in the level2.evt file, extra rows are filled as -1
| Pixel properties | Quadrant properties | ||||||
|---|---|---|---|---|---|---|---|
| Quadrant | DetID | PixID | Counts | Sigma | Mean | Median | Sigma |
| A | 0 | 29 | 3830 | 10.74 | 1076 | 1009 | 262.7 |
| A | 7 | 110 | 3311 | 8.76 | 1076 | 1009 | 262.7 |
| A | 0 | 30 | 3093 | 7.93 | 1076 | 1009 | 262.7 |
| B | 2 | 9 | 3276 | 10.81 | 1053 | 1004 | 210.3 |
| B | 2 | 8 | 2726 | 8.19 | 1053 | 1004 | 210.3 |
| B | 5 | 128 | 2658 | 7.87 | 1053 | 1004 | 210.3 |
| C | 12 | 241 | 2848 | 6.77 | 1060 | 988 | 274.6 |
| C | 2 | 191 | 2725 | 6.32 | 1060 | 988 | 274.6 |
| C | 3 | 126 | 2625 | 5.96 | 1060 | 988 | 274.6 |
| D | 6 | 231 | 2557 | 6.19 | 998 | 907 | 266.6 |
| D | 3 | 14 | 2524 | 6.07 | 998 | 907 | 266.6 |
| D | 10 | 189 | 2462 | 5.83 | 998 | 907 | 266.6 |
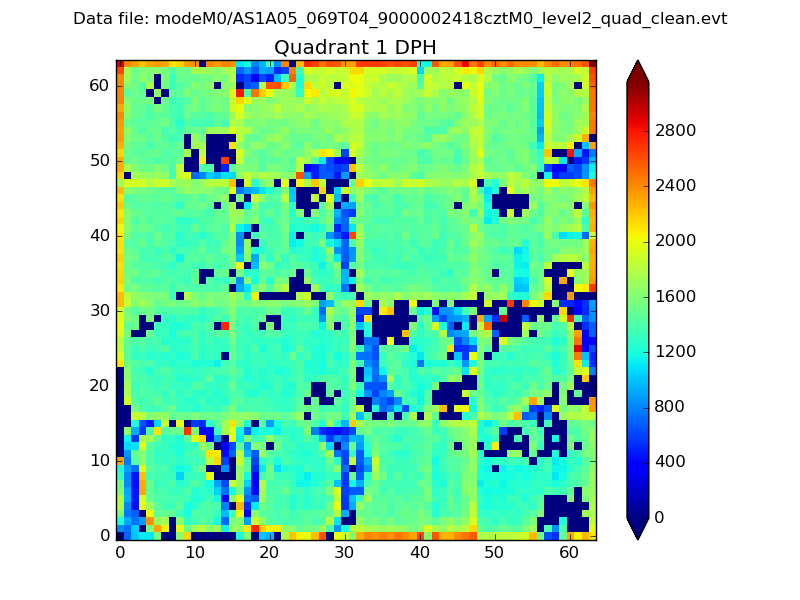
Histogram calculated using DETX and DETY for each event in the final _common_clean file
| Quadrant A |  |
 |
Quadrant B |
|---|---|---|---|
| Quadrant D |  |
 |
Quadrant C |
| Plot type | Count rate plots | Images |
|---|---|---|
| Comparison with Poisson distribution Blue bars denote a histogram of data divided into 1 sec bins. Red curve is a Poisson curve with rate = median count rate of data. |
 |
 |
| Quadrant-wise count rates Data is divided into 100 sec bins |
 |
|
| Module-wise count rates for Quadrant A Data is divided into 100 sec bins |
 |
 |
| Module-wise count rates for Quadrant B Data is divided into 100 sec bins |
 |
 |
| Module-wise count rates for Quadrant C Data is divided into 100 sec bins |
 |
 |
| Module-wise count rates for Quadrant D Data is divided into 100 sec bins |
 |
 |
| Parameter | Plot |
|---|---|
| CZT HV Monitor |  |
| D_VDD |  |
| Temperature 1 |  |
| Veto HV Monitor |  |
| Veto LLD |  |
| Alpha Counter |  |
| _CPM_Rate |  |
| CZT Counter |  |
| +2.5 Volts monitor |  |
| +5 Volts monitor |  |
| _ROLL_ROT |  |
| _Roll_DEC |  |
| _Roll_RA |  |
| Veto Counter |  |