| Param | Original file | Final file |
|---|---|---|
| Filename | modeM0/AS1A05_069T04_9000002418_16372cztM0_level2.evt | modeM0/AS1A05_069T04_9000002418_16372cztM0_level2_quad_clean.evt |
| Size (bytes) | 470,047,680 | 68,999,040 |
| Size | 448.3 MB | 65.8 MB |
| Events in quadrant A | 3,295,982 | 421,027 |
| Events in quadrant B | 3,662,546 | 426,172 |
| Events in quadrant C | 3,596,263 | 402,661 |
| Events in quadrant D | 3,249,325 | 396,205 |
| Mode M0 | |||
|---|---|---|---|
| Quadrant | BADHDUFLAG | Total packets | Discarded packets |
| A | 0 | 13565 | 3 |
| B | 0 | 14651 | 2 |
| C | 0 | 14453 | 2 |
| D | 0 | 13739 | 2 |
| Mode M9 | |||
|---|---|---|---|
| Quadrant | BADHDUFLAG | Total packets | Discarded packets |
| A | 0 | 15 | 0 |
| B | 0 | 15 | 0 |
| C | 0 | 15 | 0 |
| D | 0 | 16 | 0 |
| Mode SS | |||
|---|---|---|---|
| Quadrant | BADHDUFLAG | Total packets | Discarded packets |
| A | 0 | 130 | 0 |
| B | 0 | 130 | 0 |
| C | 0 | 130 | 0 |
| D | 0 | 130 | 0 |
| Quadrant | Total seconds | Saturated seconds | Saturation percentage |
|---|---|---|---|
| A | 6346 | 110 | 1.733375% |
| B | 6346 | 210 | 3.309171% |
| C | 6346 | 147 | 2.316420% |
| D | 6346 | 80 | 1.260637% |
Noise dominated data is calculated using 1-second bins in cleaned event files. If a bin has >2000 counts, and if more than 50% of those come from <1% of pixels, then it is considered to be noise-dominated and hence unusable.
| Quadrant | # 1 sec bins | Bins with >0 counts | Bins with >2000 counts | High rate bins dominated by noise | Noise dominated (total time) | Noise dominated (detector-on time) | Marked lightcurve |
|---|---|---|---|---|---|---|---|
| A | 7512 | 6347 | 0 | 0 | 0.00% | 0.00% | 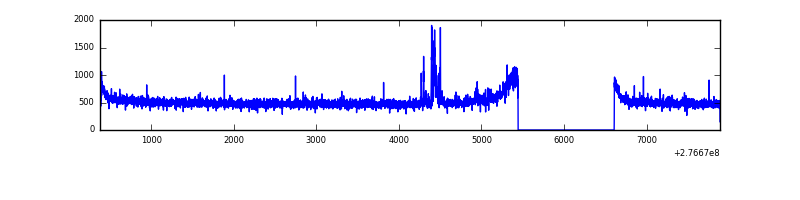 |
| B | 7512 | 6347 | 35 | 35 | 0.47% | 0.55% |  |
| C | 7512 | 6348 | 0 | 0 | 0.00% | 0.00% | 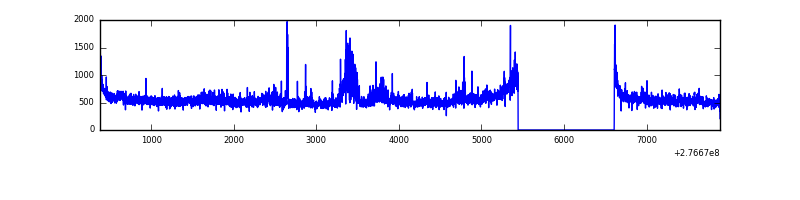 |
| D | 7512 | 6348 | 24 | 24 | 0.32% | 0.38% | 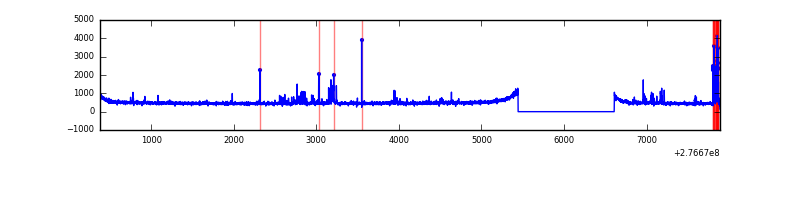 |
Top three noisy pixels from each quadrant. If the there are fewer than three noisy pixels in the level2.evt file, extra rows are filled as -1
| Pixel properties | Quadrant properties | ||||||
|---|---|---|---|---|---|---|---|
| Quadrant | DetID | PixID | Counts | Sigma | Mean | Median | Sigma |
| A | 15 | 174 | 70705 | 420.21 | 830 | 815 | 166.3 |
| A | 3 | 1 | 15060 | 85.65 | 830 | 815 | 166.3 |
| A | 15 | 223 | 13457 | 76.01 | 830 | 815 | 166.3 |
| B | 10 | 16 | 187372 | 1179.56 | 830 | 811 | 158.2 |
| B | 4 | 173 | 119715 | 751.79 | 830 | 811 | 158.2 |
| B | 0 | 189 | 34941 | 215.79 | 830 | 811 | 158.2 |
| C | 3 | 233 | 402154 | 2185.86 | 785 | 791 | 183.6 |
| C | 14 | 238 | 123558 | 668.6 | 785 | 791 | 183.6 |
| C | 7 | 247 | 8677 | 42.95 | 785 | 791 | 183.6 |
| D | 10 | 70 | 126465 | 648.24 | 795 | 774 | 193.9 |
| D | 12 | 218 | 65861 | 335.68 | 795 | 774 | 193.9 |
| D | 2 | 234 | 22995 | 114.6 | 795 | 774 | 193.9 |
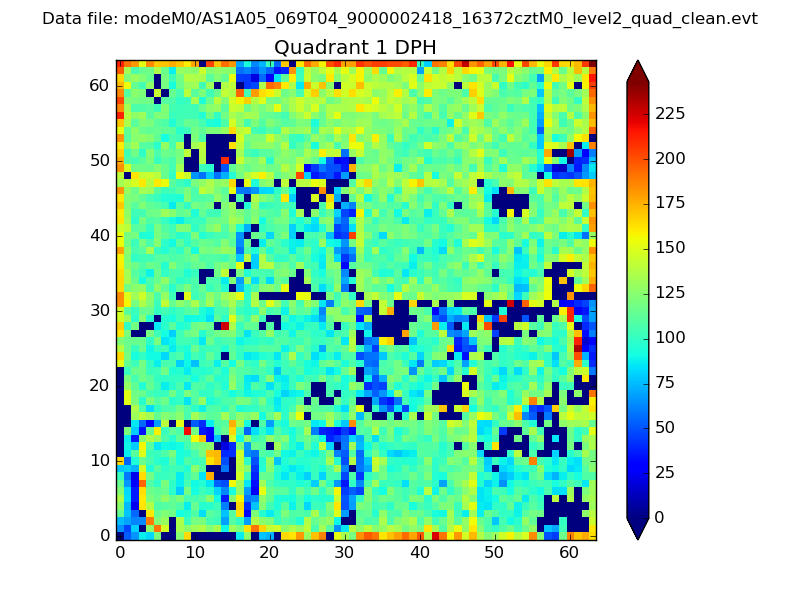
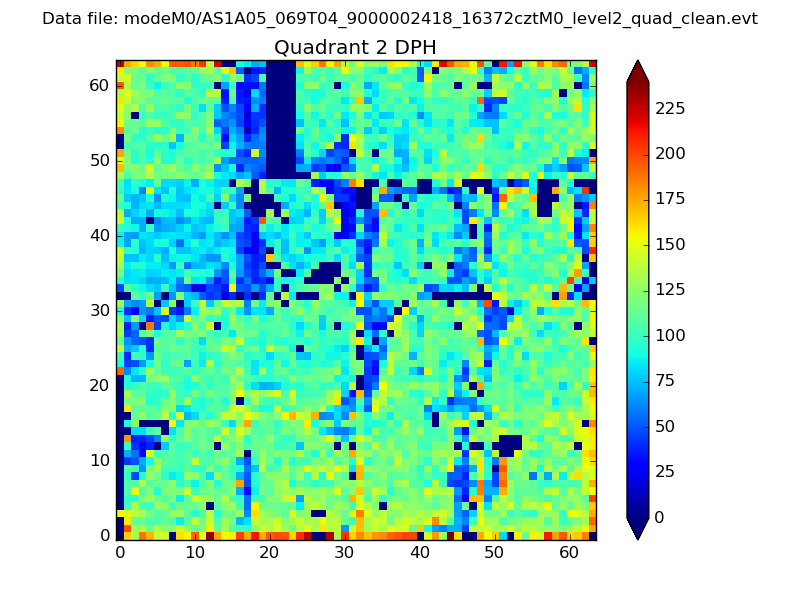
Histogram calculated using DETX and DETY for each event in the final _common_clean file
| Quadrant A | 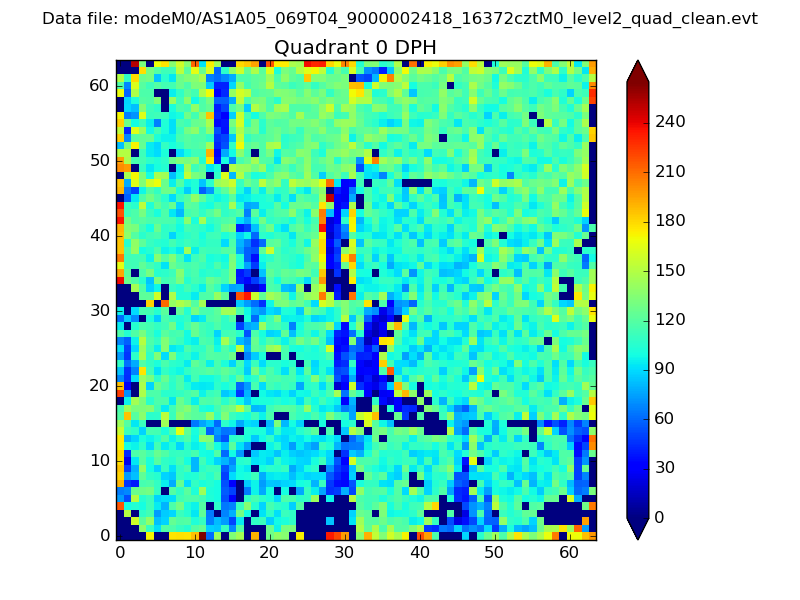 |
 |
Quadrant B |
|---|---|---|---|
| Quadrant D | 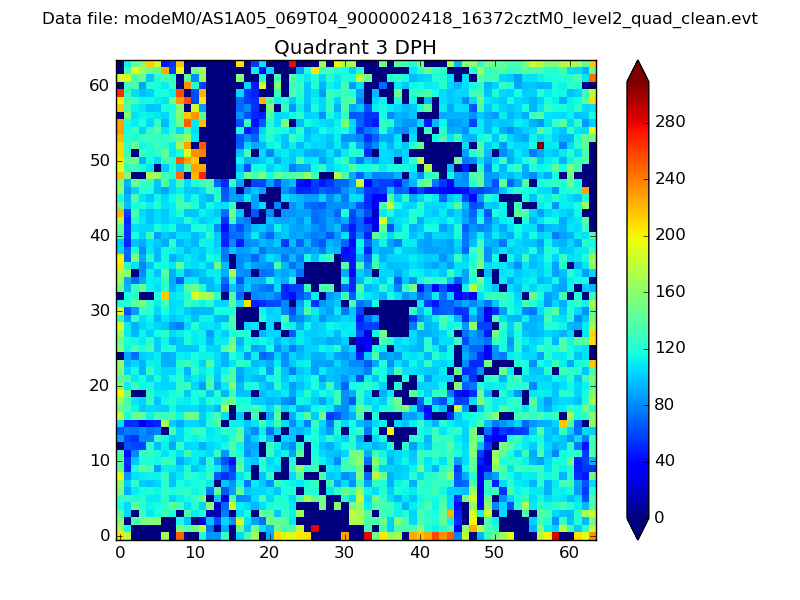 |
 |
Quadrant C |
| Plot type | Count rate plots | Images |
|---|---|---|
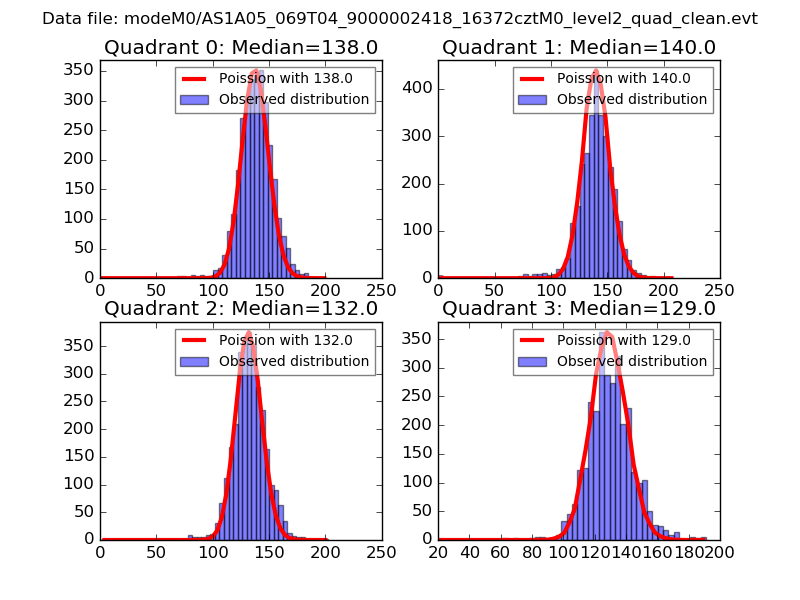
| Comparison with Poisson distribution Blue bars denote a histogram of data divided into 1 sec bins. Red curve is a Poisson curve with rate = median count rate of data. |
 |
 |
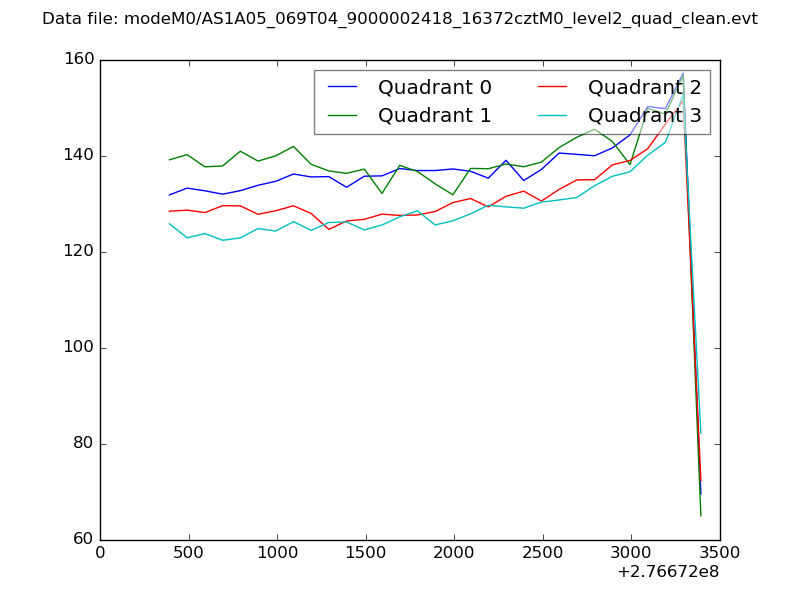
| Quadrant-wise count rates Data is divided into 100 sec bins |
 |
|
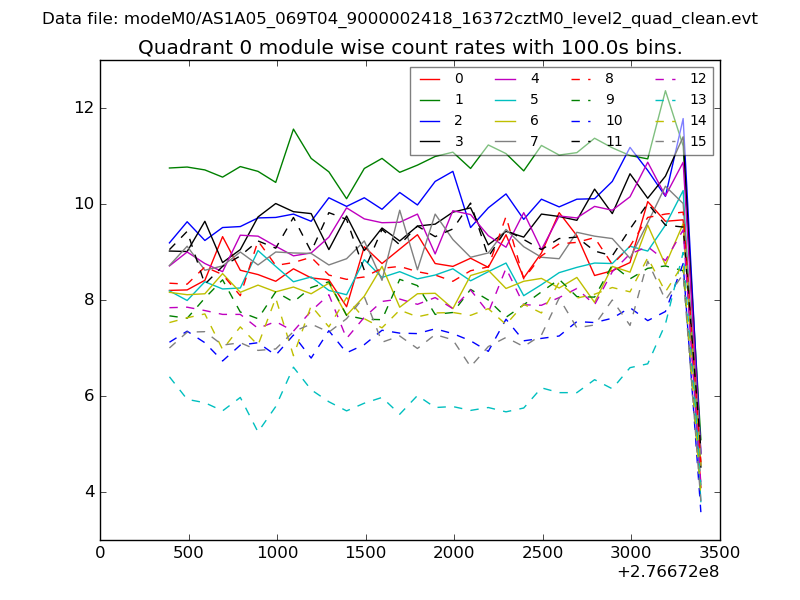
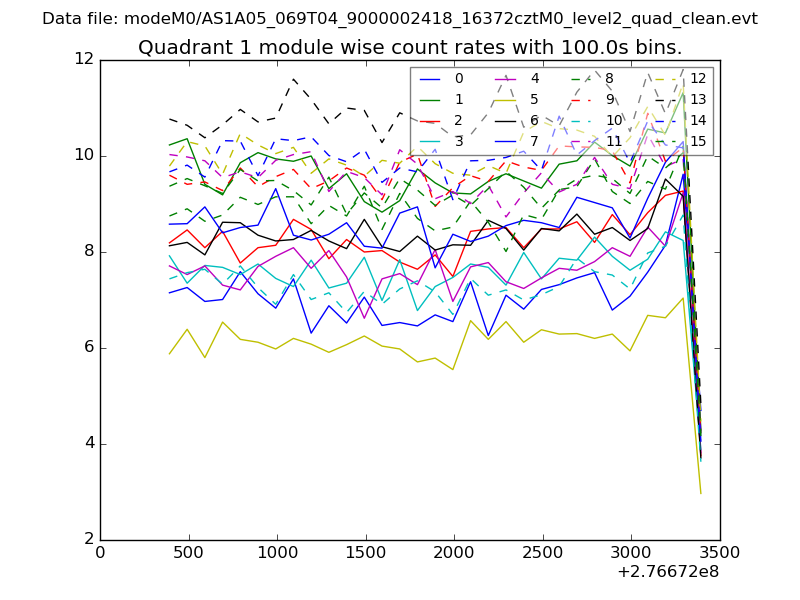
| Module-wise count rates for Quadrant A Data is divided into 100 sec bins |
 |
 |
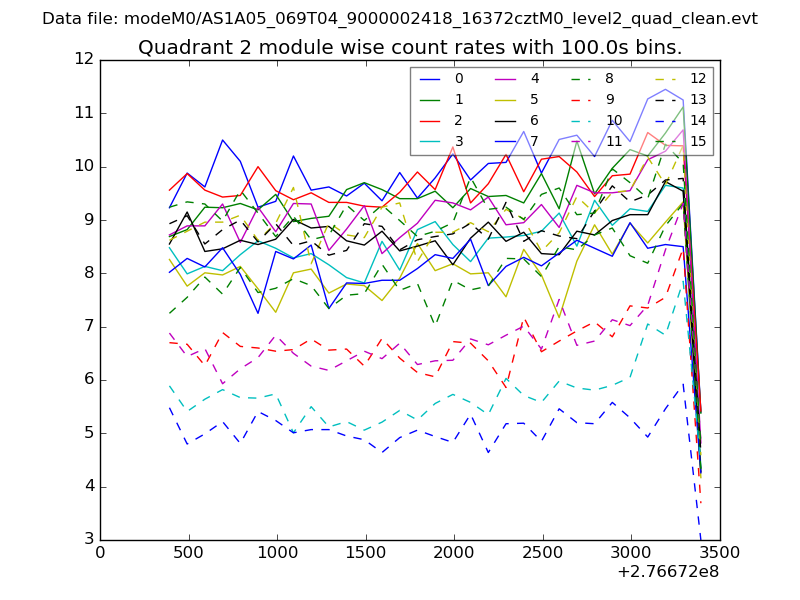
| Module-wise count rates for Quadrant B Data is divided into 100 sec bins |
 |
 |
| Module-wise count rates for Quadrant C Data is divided into 100 sec bins |
 |
 |
| Module-wise count rates for Quadrant D Data is divided into 100 sec bins |
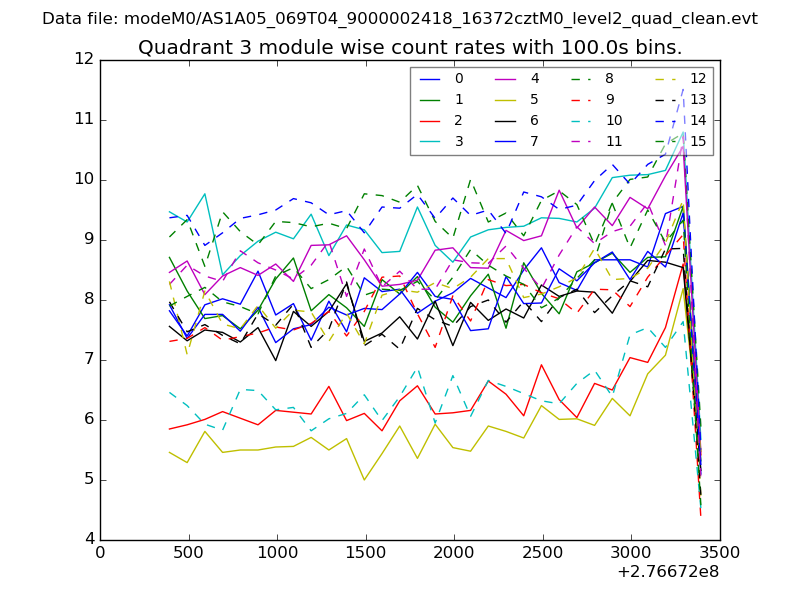 |
 |
| Parameter | Plot |
|---|---|
| CZT HV Monitor | 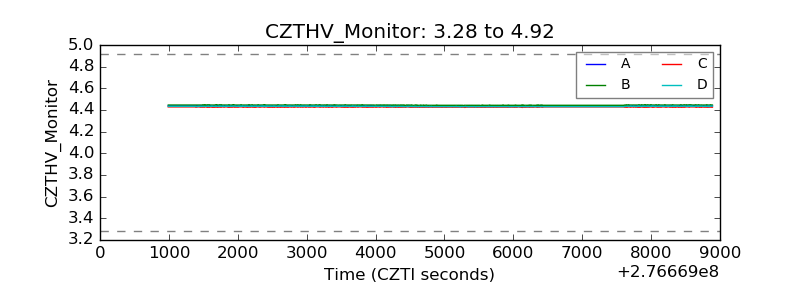 |
| D_VDD |  |
| Temperature 1 |  |
| Veto HV Monitor | 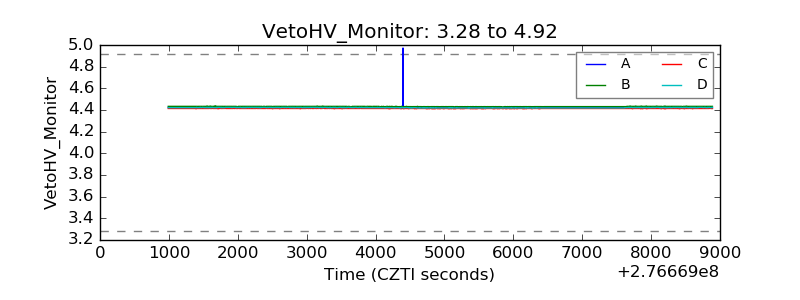 |
| Veto LLD | 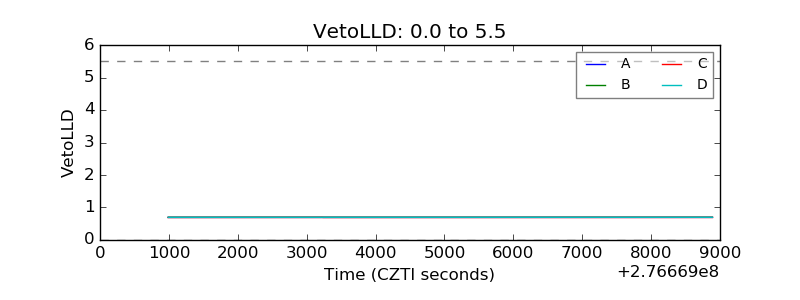 |
| Alpha Counter | 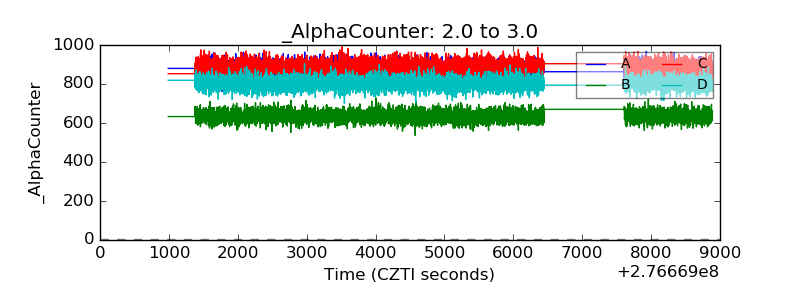 |
| _CPM_Rate | 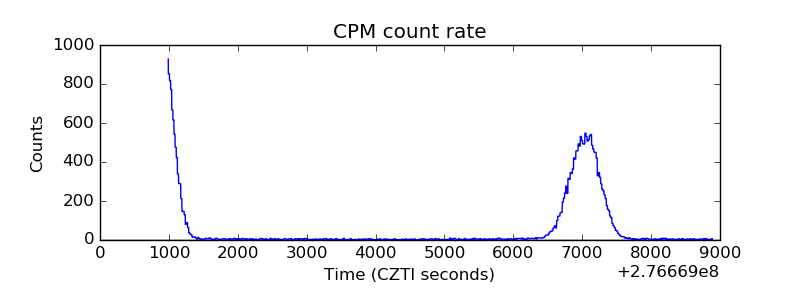 |
| CZT Counter | 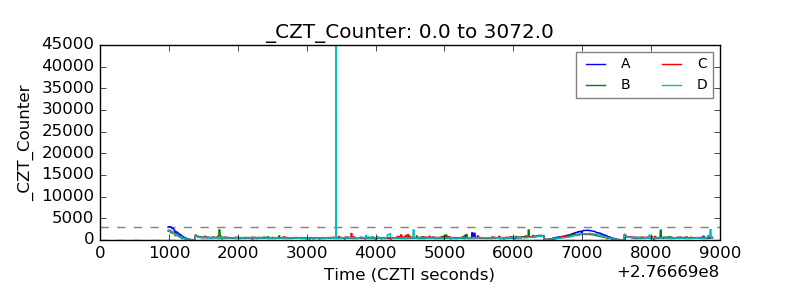 |
| +2.5 Volts monitor |  |
| +5 Volts monitor | 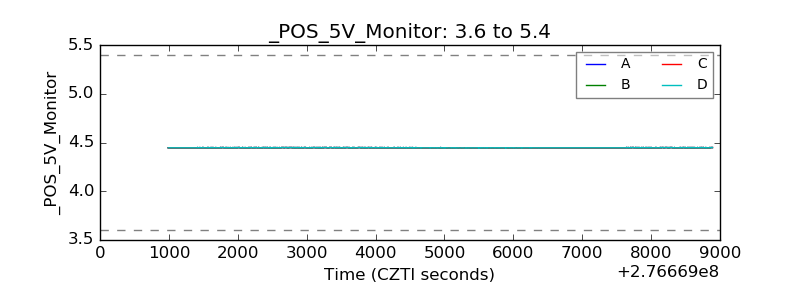 |
| _ROLL_ROT | 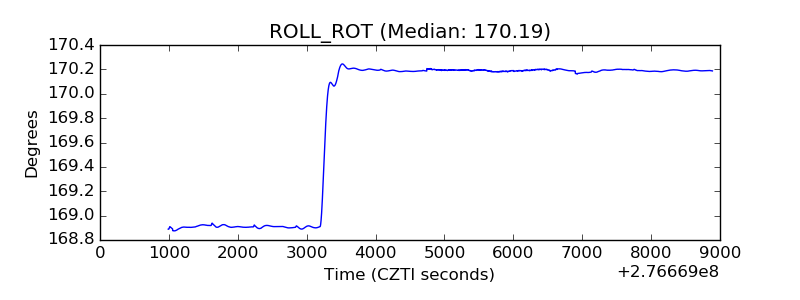 |
| _Roll_DEC | 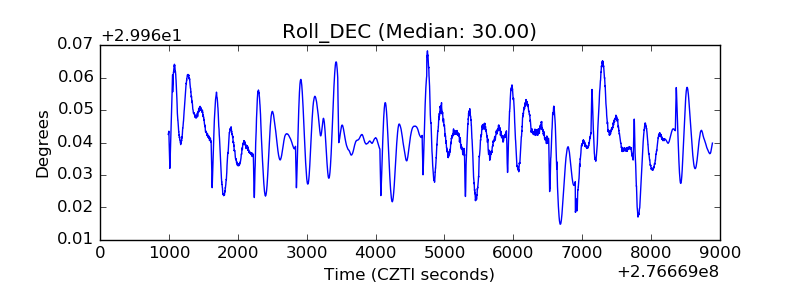 |
| _Roll_RA | 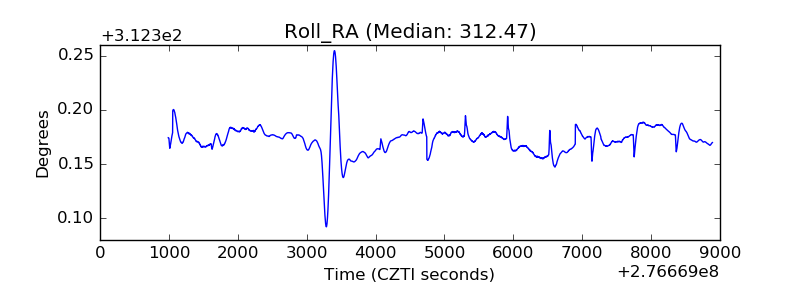 |
| Veto Counter | 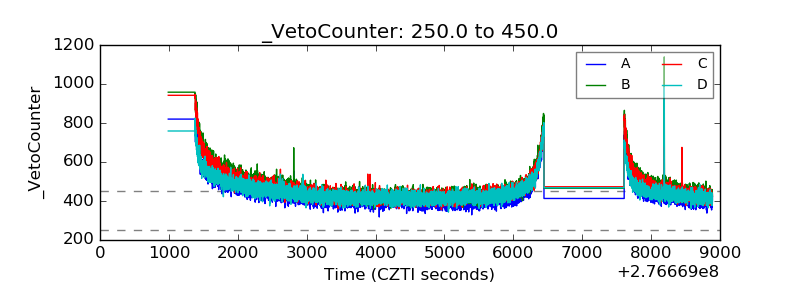 |