| Param | Original file | Final file |
|---|---|---|
| Filename | modeM0/AS1A05_069T04_9000002418_16373cztM0_level2.evt | modeM0/AS1A05_069T04_9000002418_16373cztM0_level2_quad_clean.evt |
| Size (bytes) | 570,093,120 | 94,950,720 |
| Size | 543.7 MB | 90.6 MB |
| Events in quadrant A | 3,717,635 | 607,579 |
| Events in quadrant B | 4,382,989 | 608,287 |
| Events in quadrant C | 4,738,661 | 574,380 |
| Events in quadrant D | 3,924,426 | 570,221 |
| Mode M0 | |||
|---|---|---|---|
| Quadrant | BADHDUFLAG | Total packets | Discarded packets |
| A | 0 | 15644 | 3 |
| B | 0 | 17580 | 2 |
| C | 0 | 18810 | 2 |
| D | 0 | 16587 | 2 |
| Mode M9 | |||
|---|---|---|---|
| Quadrant | BADHDUFLAG | Total packets | Discarded packets |
| A | 0 | 21 | 0 |
| B | 0 | 21 | 0 |
| C | 0 | 21 | 0 |
| D | 0 | 21 | 0 |
| Mode SS | |||
|---|---|---|---|
| Quadrant | BADHDUFLAG | Total packets | Discarded packets |
| A | 0 | 152 | 0 |
| B | 0 | 152 | 0 |
| C | 0 | 152 | 0 |
| D | 0 | 152 | 0 |
| Quadrant | Total seconds | Saturated seconds | Saturation percentage |
|---|---|---|---|
| A | 7405 | 173 | 2.336259% |
| B | 7405 | 262 | 3.538150% |
| C | 7405 | 262 | 3.538150% |
| D | 7405 | 156 | 2.106685% |
Noise dominated data is calculated using 1-second bins in cleaned event files. If a bin has >2000 counts, and if more than 50% of those come from <1% of pixels, then it is considered to be noise-dominated and hence unusable.
| Quadrant | # 1 sec bins | Bins with >0 counts | Bins with >2000 counts | High rate bins dominated by noise | Noise dominated (total time) | Noise dominated (detector-on time) | Marked lightcurve |
|---|---|---|---|---|---|---|---|
| A | 9421 | 7406 | 0 | 0 | 0.00% | 0.00% | 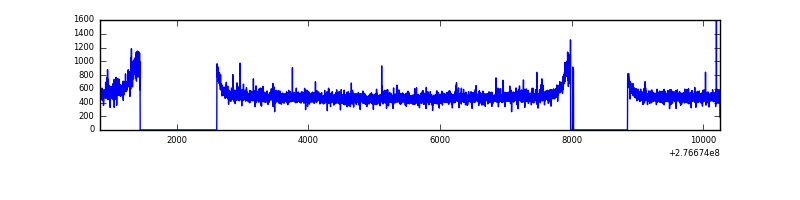 |
| B | 9421 | 7406 | 29 | 29 | 0.31% | 0.39% | 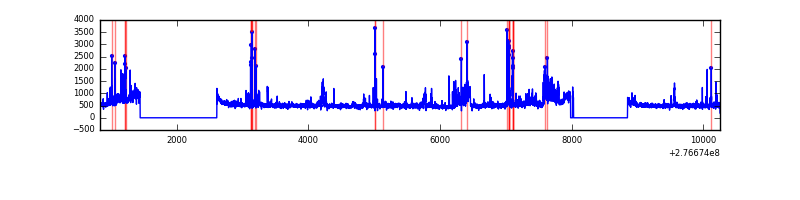 |
| C | 9421 | 7407 | 3 | 3 | 0.03% | 0.04% | 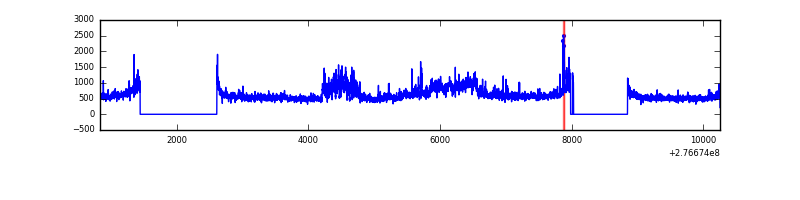 |
| D | 9421 | 7408 | 54 | 54 | 0.57% | 0.73% | 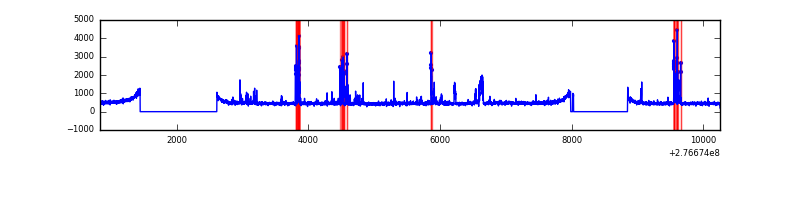 |
Top three noisy pixels from each quadrant. If the there are fewer than three noisy pixels in the level2.evt file, extra rows are filled as -1
| Pixel properties | Quadrant properties | ||||||
|---|---|---|---|---|---|---|---|
| Quadrant | DetID | PixID | Counts | Sigma | Mean | Median | Sigma |
| A | 15 | 174 | 26977 | 135.46 | 953 | 935 | 192.2 |
| A | 3 | 1 | 20813 | 103.4 | 953 | 935 | 192.2 |
| A | 0 | 226 | 8500 | 39.35 | 953 | 935 | 192.2 |
| B | 15 | 35 | 197931 | 1077.72 | 949 | 924 | 182.8 |
| B | 10 | 16 | 156816 | 852.8 | 949 | 924 | 182.8 |
| B | 0 | 182 | 90075 | 487.7 | 949 | 924 | 182.8 |
| C | 3 | 233 | 1075378 | 5104.28 | 900 | 905 | 210.5 |
| C | 14 | 238 | 139052 | 656.27 | 900 | 905 | 210.5 |
| C | 10 | 169 | 9229 | 39.54 | 900 | 905 | 210.5 |
| D | 10 | 70 | 268302 | 1198.52 | 917 | 891 | 223.1 |
| D | 2 | 122 | 107229 | 476.6 | 917 | 891 | 223.1 |
| D | 12 | 218 | 30227 | 131.48 | 917 | 891 | 223.1 |
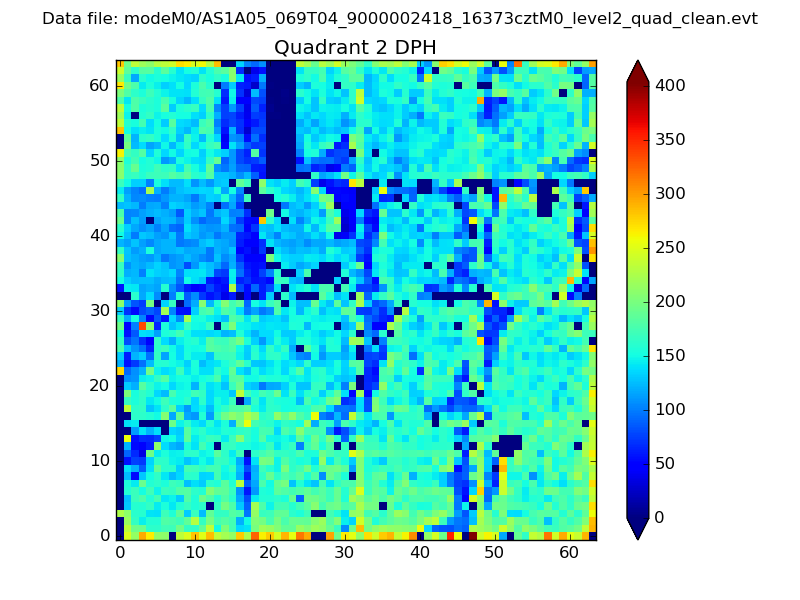
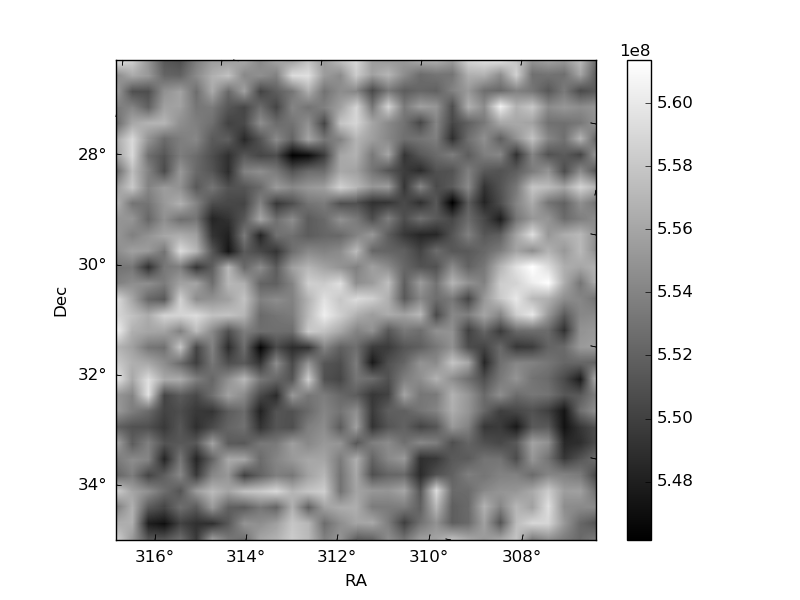
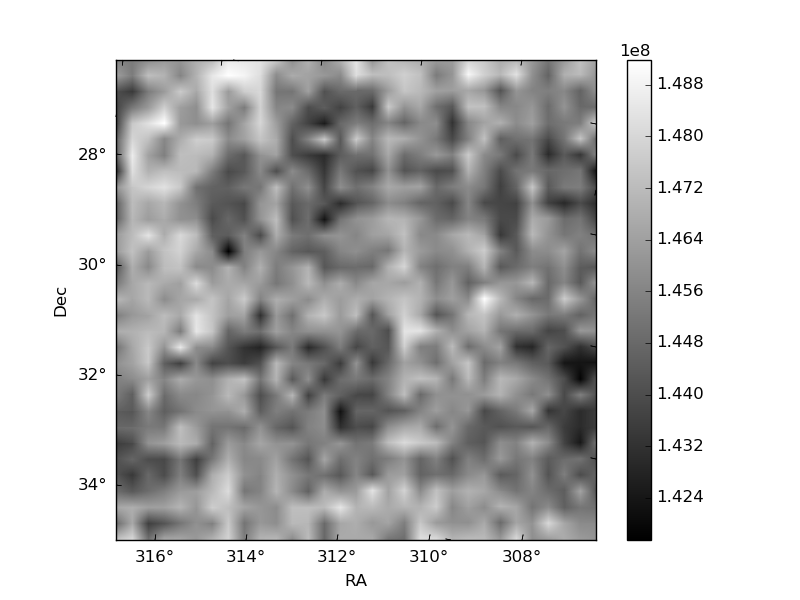
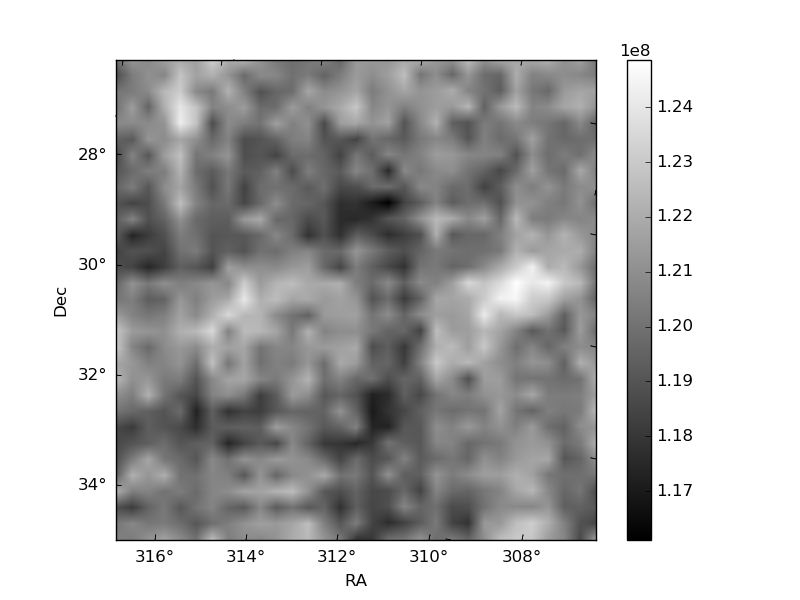
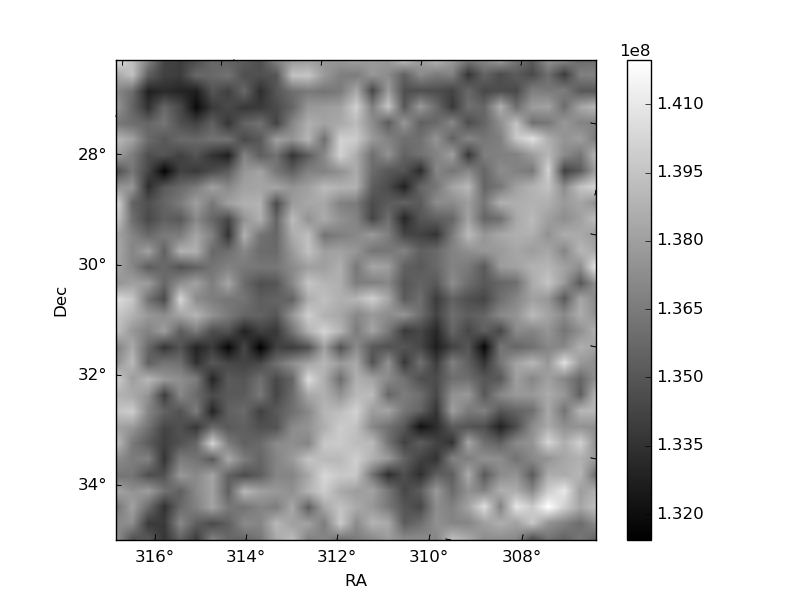
Histogram calculated using DETX and DETY for each event in the final _common_clean file
| Quadrant A | 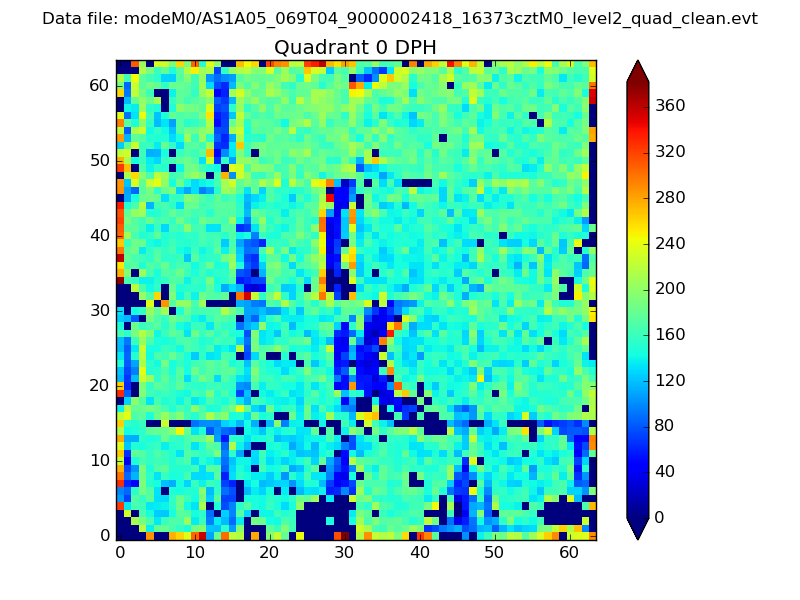 |
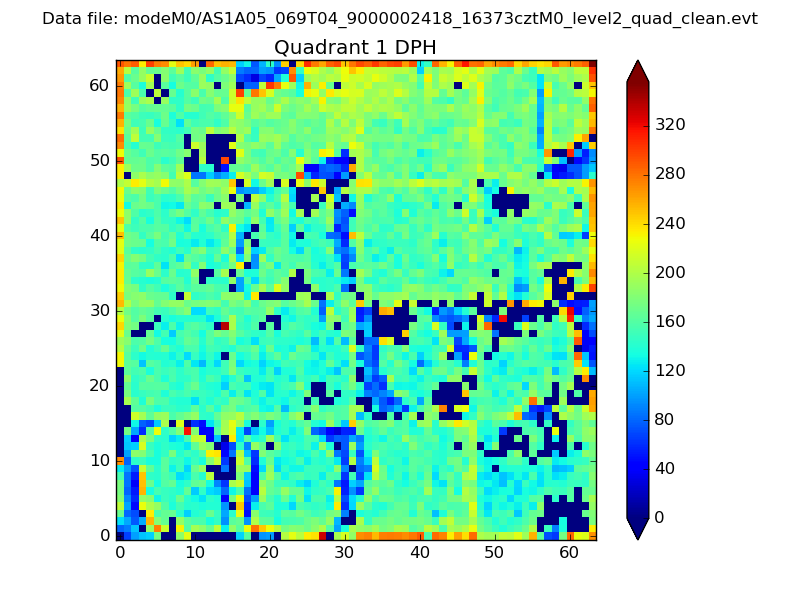 |
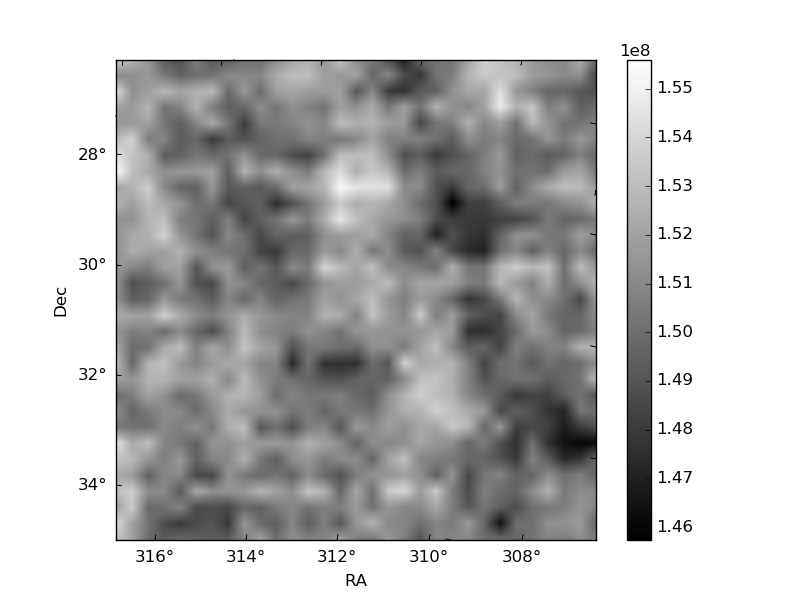
Quadrant B |
|---|---|---|---|
| Quadrant D | 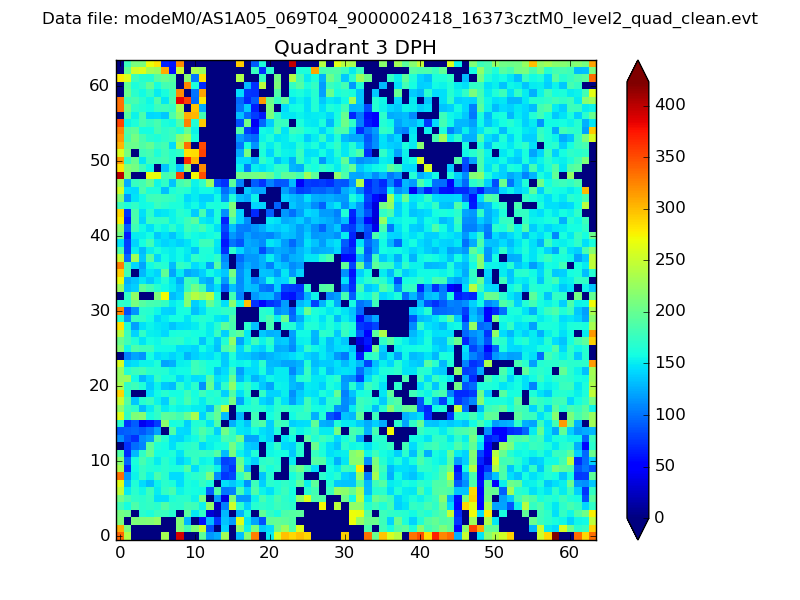 |
 |
Quadrant C |
| Plot type | Count rate plots | Images |
|---|---|---|
| Comparison with Poisson distribution Blue bars denote a histogram of data divided into 1 sec bins. Red curve is a Poisson curve with rate = median count rate of data. |
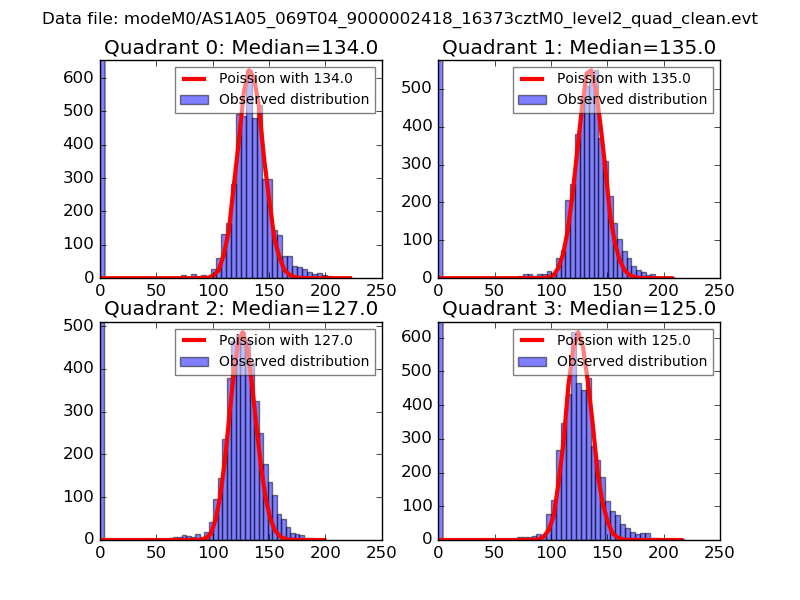 |
 |
| Quadrant-wise count rates Data is divided into 100 sec bins |
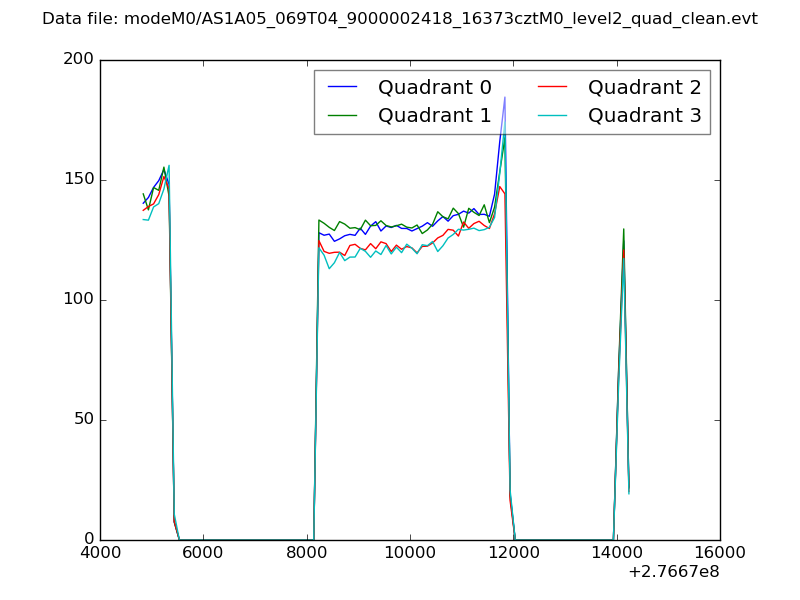 |
|
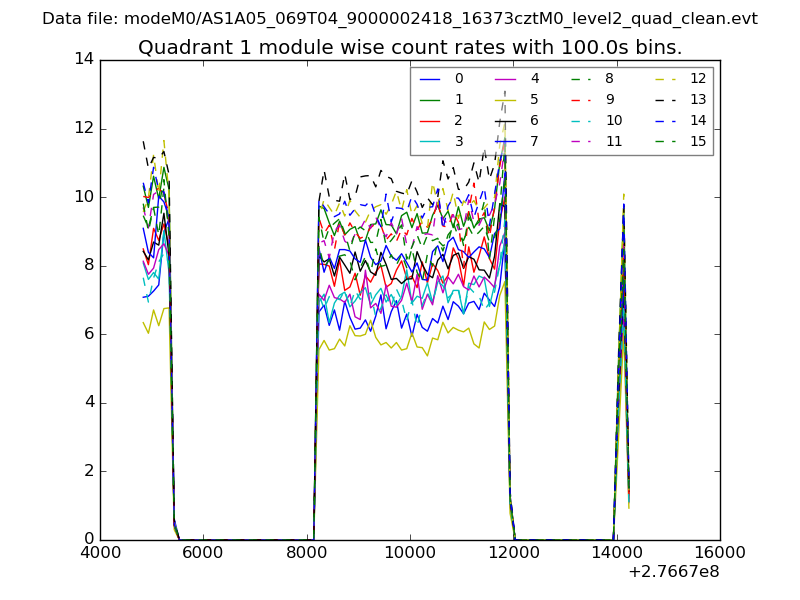
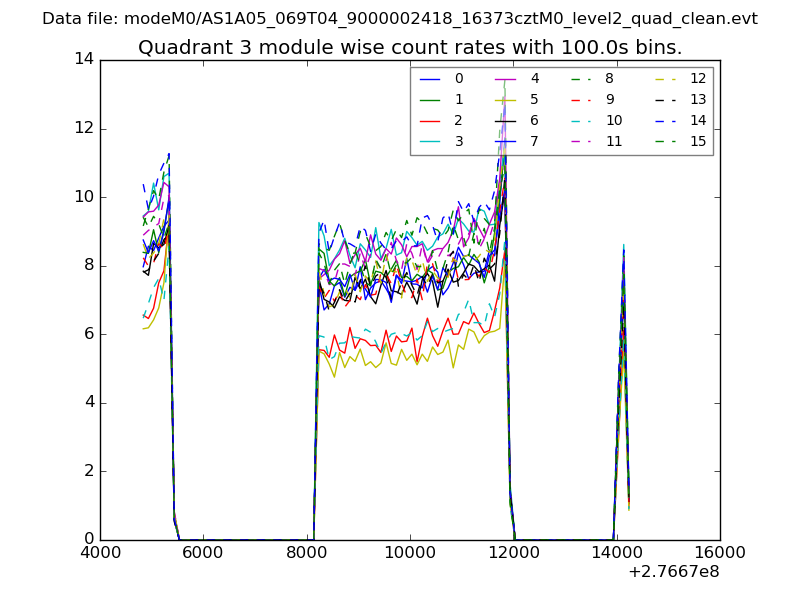
| Module-wise count rates for Quadrant A Data is divided into 100 sec bins |
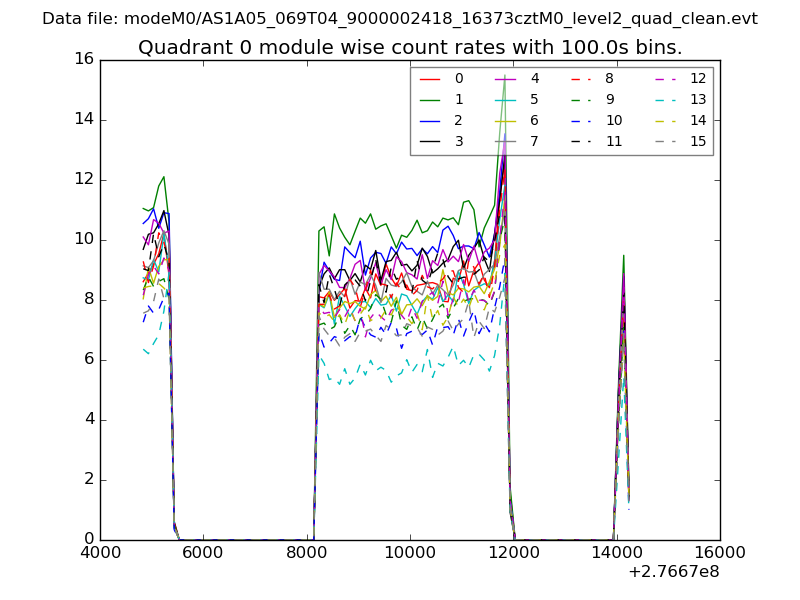 |
 |
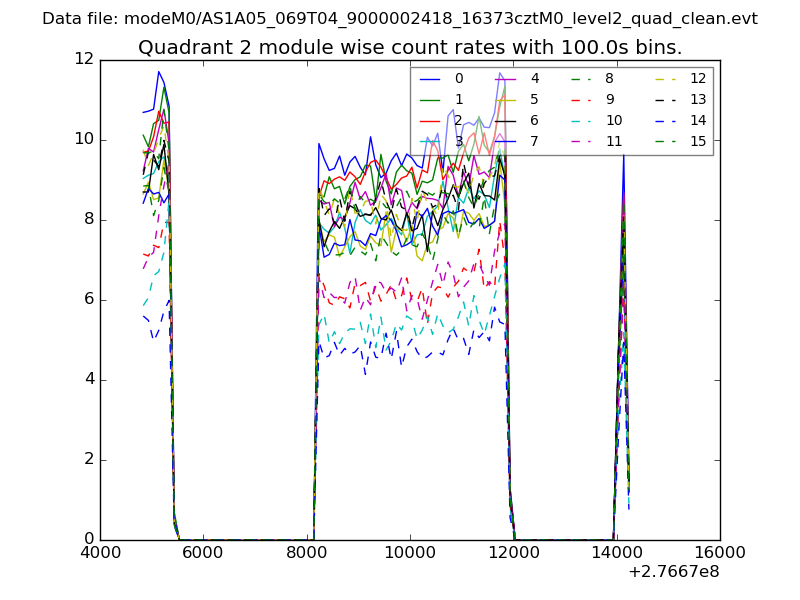
| Module-wise count rates for Quadrant B Data is divided into 100 sec bins |
 |
 |
| Module-wise count rates for Quadrant C Data is divided into 100 sec bins |
 |
 |
| Module-wise count rates for Quadrant D Data is divided into 100 sec bins |
 |
 |
| Parameter | Plot |
|---|---|
| CZT HV Monitor | 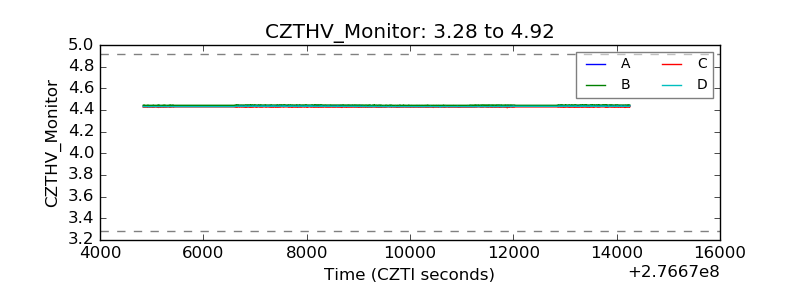 |
| D_VDD | 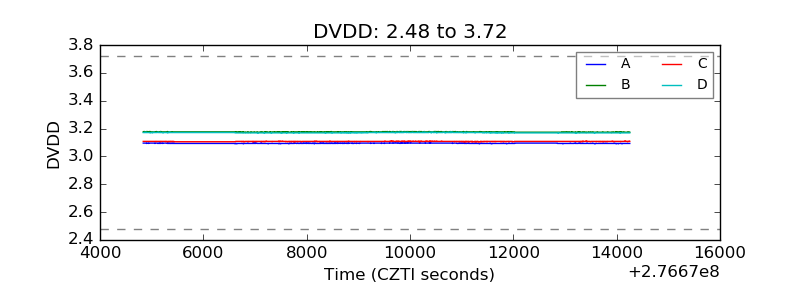 |
| Temperature 1 | 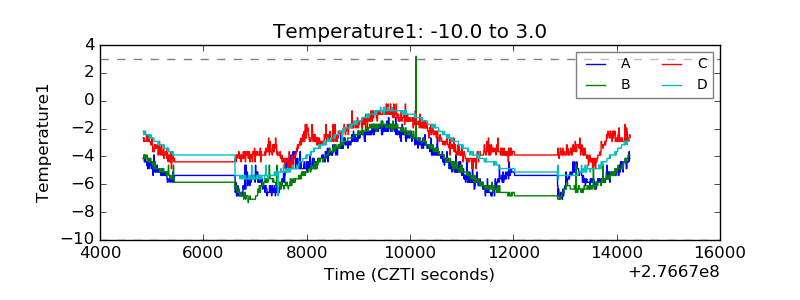 |
| Veto HV Monitor | 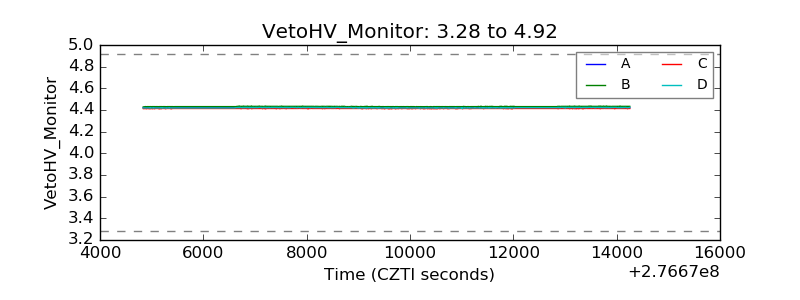 |
| Veto LLD | 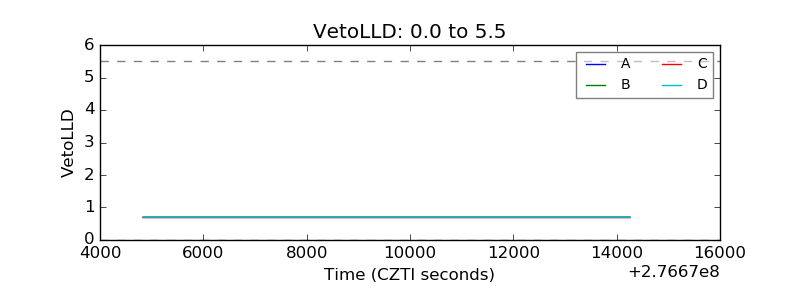 |
| Alpha Counter |  |
| _CPM_Rate | 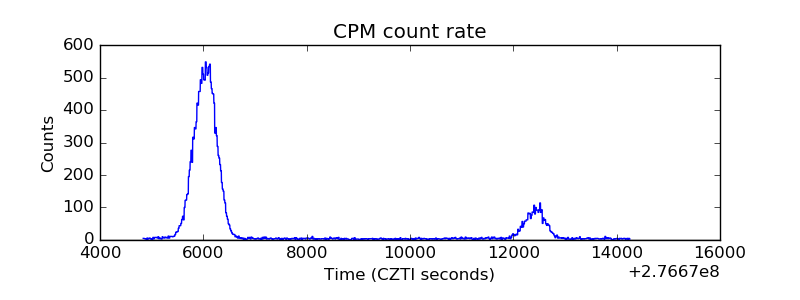 |
| CZT Counter | 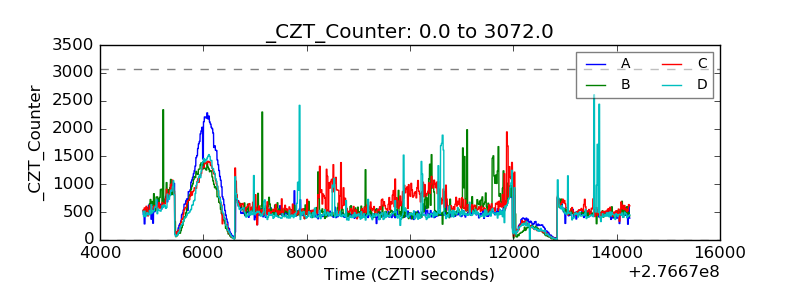 |
| +2.5 Volts monitor |  |
| +5 Volts monitor |  |
| _ROLL_ROT | 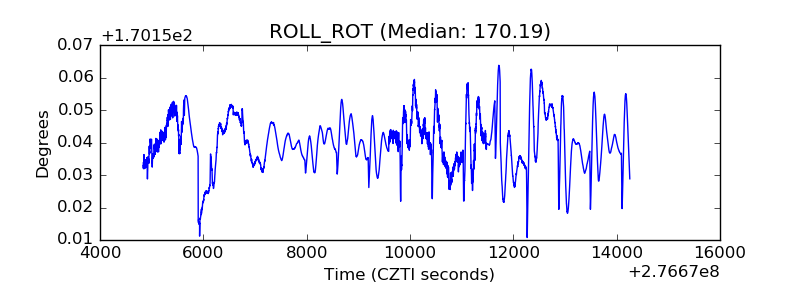 |
| _Roll_DEC | 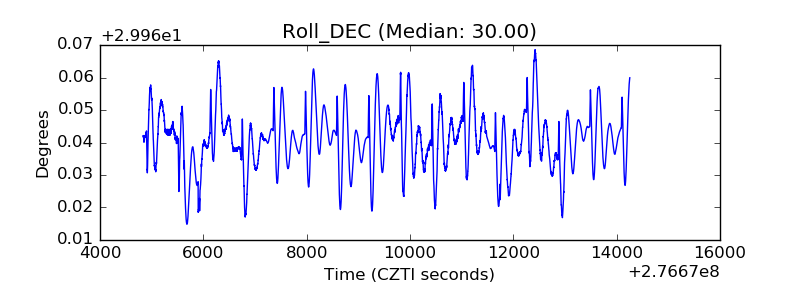 |
| _Roll_RA | 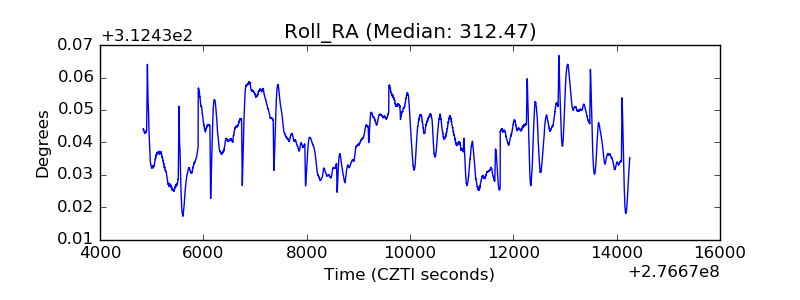 |
| Veto Counter | 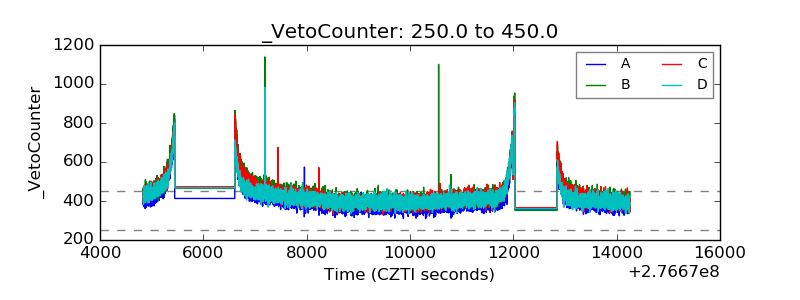 |