| Param | Original file | Final file |
|---|---|---|
| Filename | modeM0/AS1A05_069T04_9000002418_16374cztM0_level2.evt | modeM0/AS1A05_069T04_9000002418_16374cztM0_level2_quad_clean.evt |
| Size (bytes) | 590,520,960 | 99,901,440 |
| Size | 563.2 MB | 95.3 MB |
| Events in quadrant A | 3,892,454 | 632,952 |
| Events in quadrant B | 5,155,792 | 626,699 |
| Events in quadrant C | 4,391,164 | 606,658 |
| Events in quadrant D | 3,898,622 | 599,924 |
| Mode M0 | |||
|---|---|---|---|
| Quadrant | BADHDUFLAG | Total packets | Discarded packets |
| A | 0 | 16774 | 3 |
| B | 0 | 20388 | 2 |
| C | 0 | 17947 | 2 |
| D | 0 | 17141 | 2 |
| Mode M9 | |||
|---|---|---|---|
| Quadrant | BADHDUFLAG | Total packets | Discarded packets |
| A | 0 | 12 | 0 |
| B | 0 | 12 | 0 |
| C | 0 | 12 | 0 |
| D | 0 | 12 | 0 |
| Mode SS | |||
|---|---|---|---|
| Quadrant | BADHDUFLAG | Total packets | Discarded packets |
| A | 0 | 166 | 0 |
| B | 0 | 166 | 0 |
| C | 0 | 166 | 0 |
| D | 0 | 166 | 0 |
| Quadrant | Total seconds | Saturated seconds | Saturation percentage |
|---|---|---|---|
| A | 8047 | 228 | 2.833354% |
| B | 8047 | 552 | 6.859699% |
| C | 8047 | 308 | 3.827513% |
| D | 8047 | 207 | 2.572387% |
Noise dominated data is calculated using 1-second bins in cleaned event files. If a bin has >2000 counts, and if more than 50% of those come from <1% of pixels, then it is considered to be noise-dominated and hence unusable.
| Quadrant | # 1 sec bins | Bins with >0 counts | Bins with >2000 counts | High rate bins dominated by noise | Noise dominated (total time) | Noise dominated (detector-on time) | Marked lightcurve |
|---|---|---|---|---|---|---|---|
| A | 9208 | 8048 | 0 | 0 | 0.00% | 0.00% | 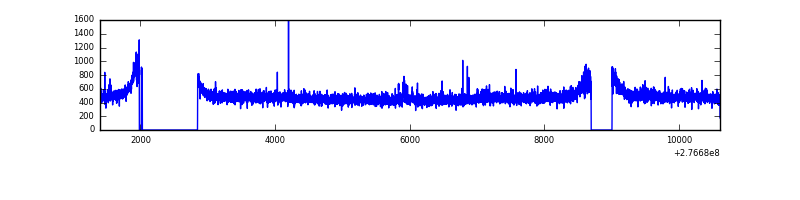 |
| B | 9208 | 8048 | 198 | 198 | 2.15% | 2.46% | 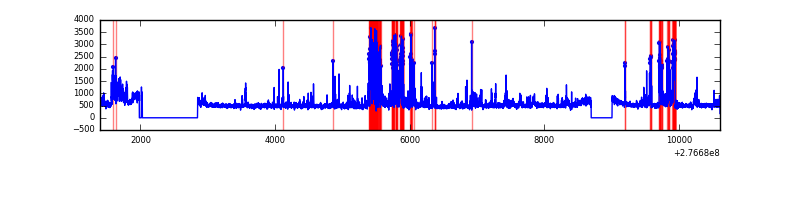 |
| C | 9208 | 8049 | 3 | 3 | 0.03% | 0.04% | 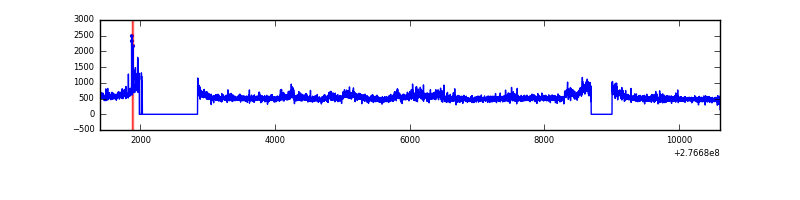 |
| D | 9208 | 8050 | 26 | 26 | 0.28% | 0.32% | 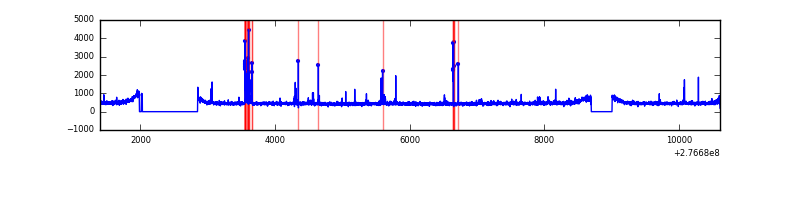 |
Top three noisy pixels from each quadrant. If the there are fewer than three noisy pixels in the level2.evt file, extra rows are filled as -1
| Pixel properties | Quadrant properties | ||||||
|---|---|---|---|---|---|---|---|
| Quadrant | DetID | PixID | Counts | Sigma | Mean | Median | Sigma |
| A | 3 | 1 | 16414 | 76.13 | 1001 | 979 | 202.7 |
| A | 15 | 174 | 15795 | 73.08 | 1001 | 979 | 202.7 |
| A | 9 | 143 | 12697 | 57.8 | 1001 | 979 | 202.7 |
| B | 10 | 16 | 407614 | 2148.09 | 987 | 962 | 189.3 |
| B | 4 | 173 | 344030 | 1812.22 | 987 | 962 | 189.3 |
| B | 15 | 35 | 241186 | 1268.96 | 987 | 962 | 189.3 |
| C | 3 | 233 | 520292 | 2341.98 | 953 | 958 | 221.8 |
| C | 14 | 238 | 146269 | 655.29 | 953 | 958 | 221.8 |
| C | 13 | 61 | 6807 | 26.38 | 953 | 958 | 221.8 |
| D | 10 | 70 | 135071 | 559.74 | 974 | 941 | 239.6 |
| D | 1 | 52 | 47008 | 192.24 | 974 | 941 | 239.6 |
| D | 2 | 234 | 30111 | 121.73 | 974 | 941 | 239.6 |
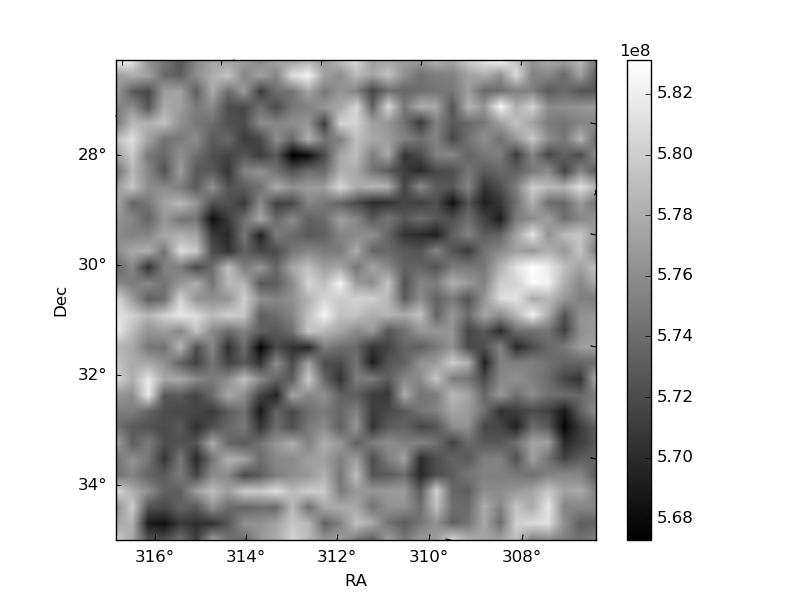
Histogram calculated using DETX and DETY for each event in the final _common_clean file
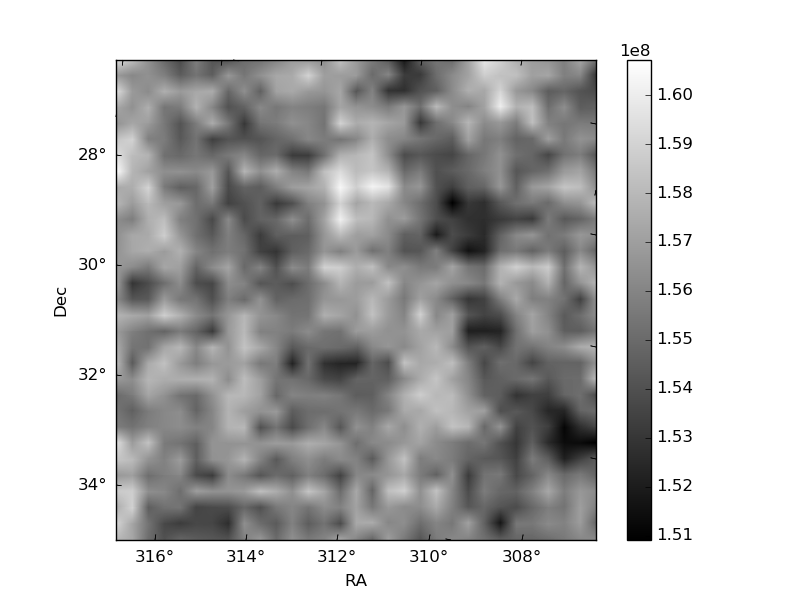
| Quadrant A | 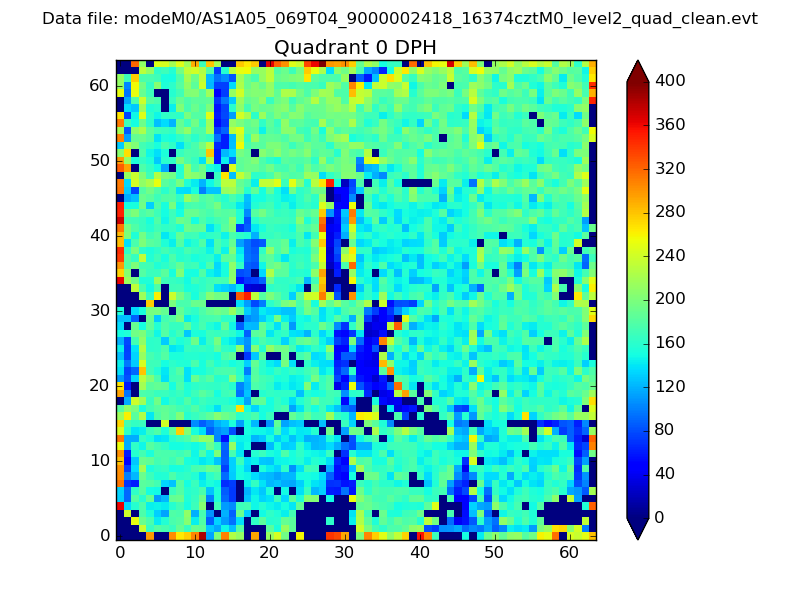 |
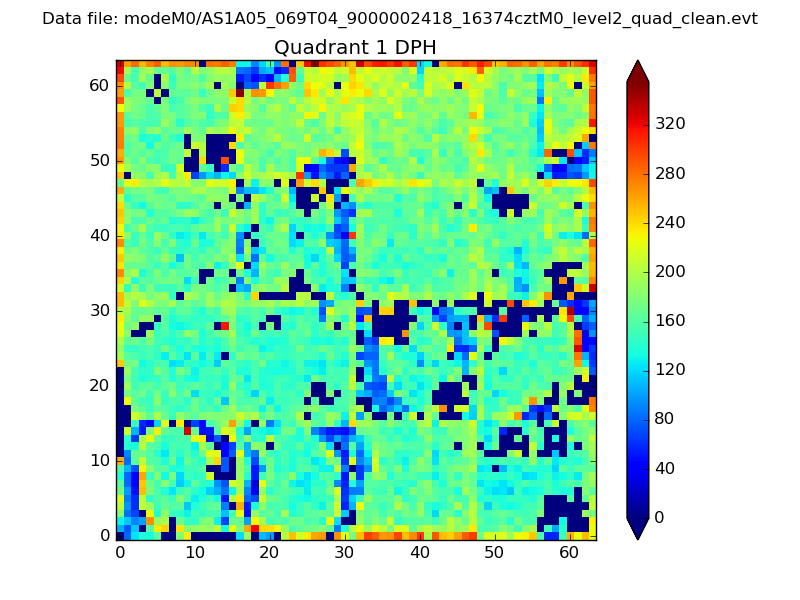 |
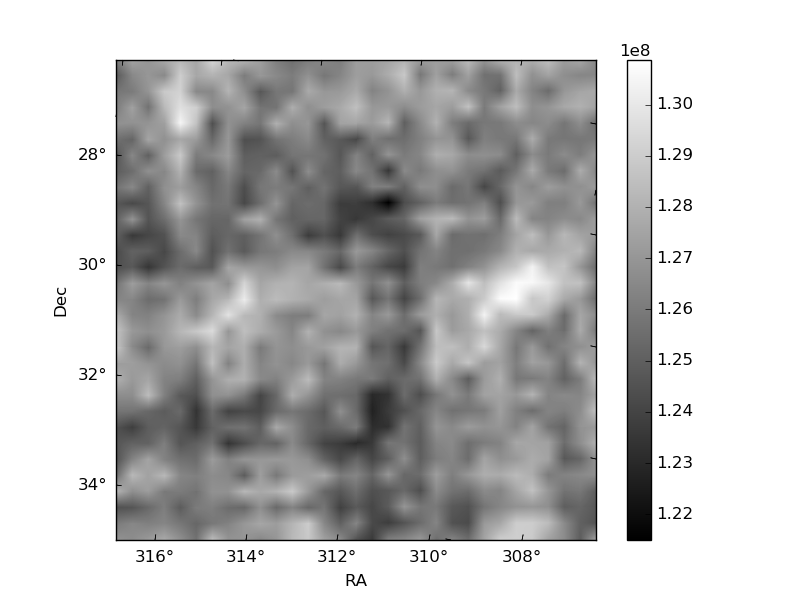
Quadrant B |
|---|---|---|---|
| Quadrant D | 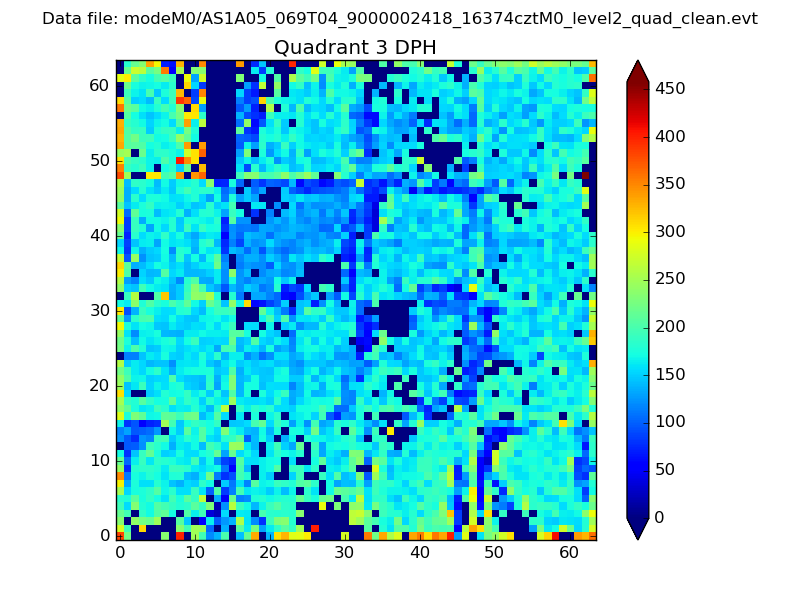 |
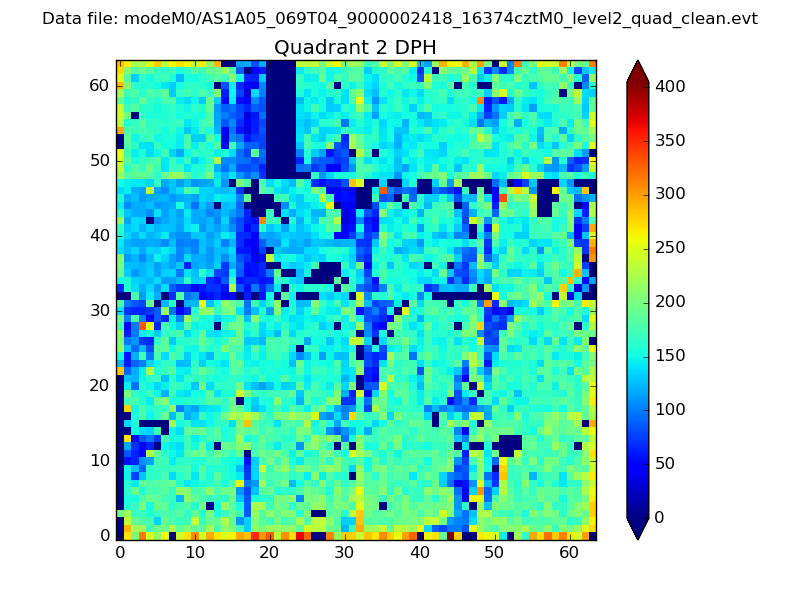 |
Quadrant C |
| Plot type | Count rate plots | Images |
|---|---|---|
| Comparison with Poisson distribution Blue bars denote a histogram of data divided into 1 sec bins. Red curve is a Poisson curve with rate = median count rate of data. |
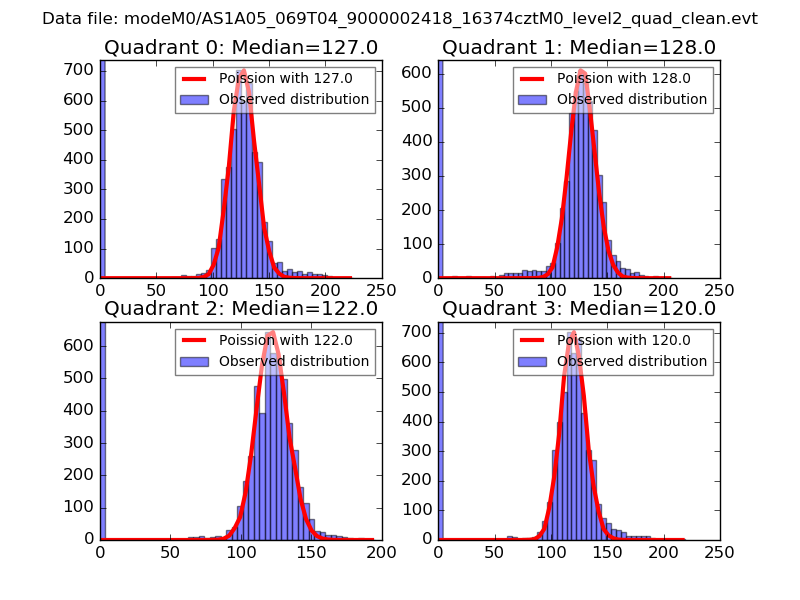 |
 |
| Quadrant-wise count rates Data is divided into 100 sec bins |
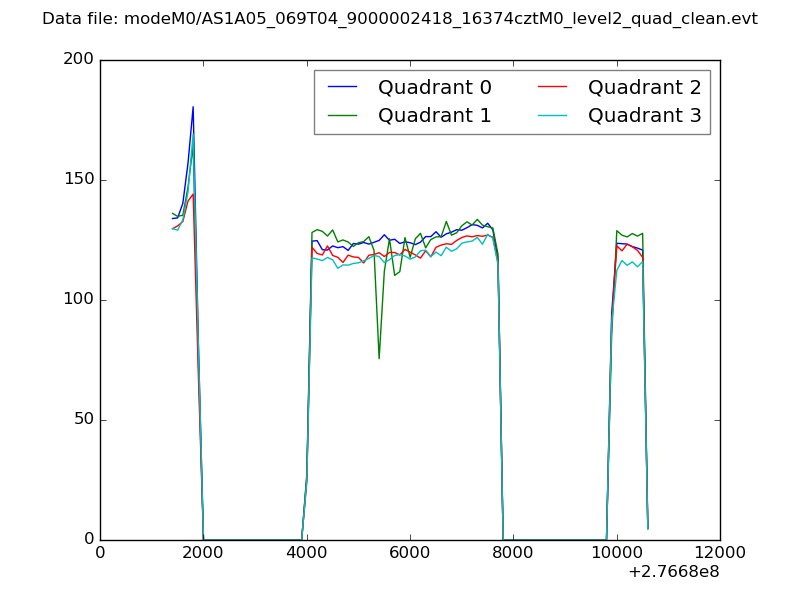 |
|
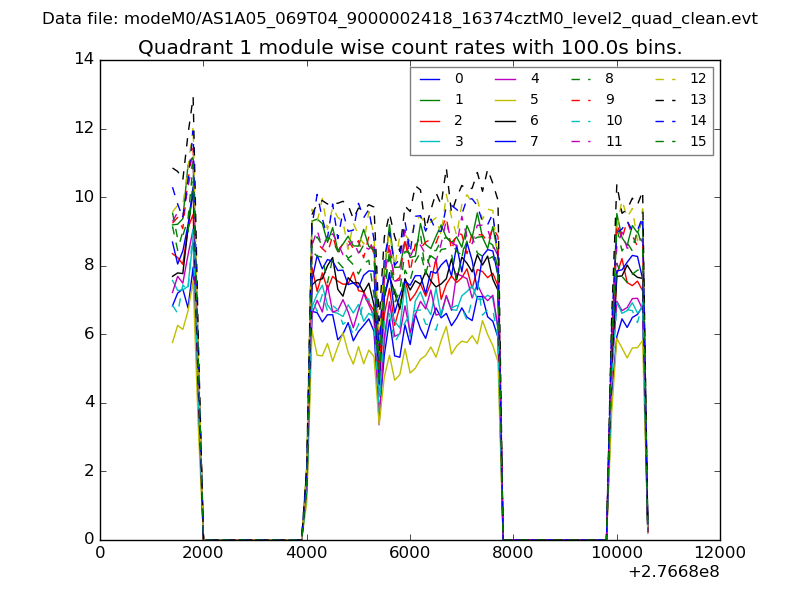
| Module-wise count rates for Quadrant A Data is divided into 100 sec bins |
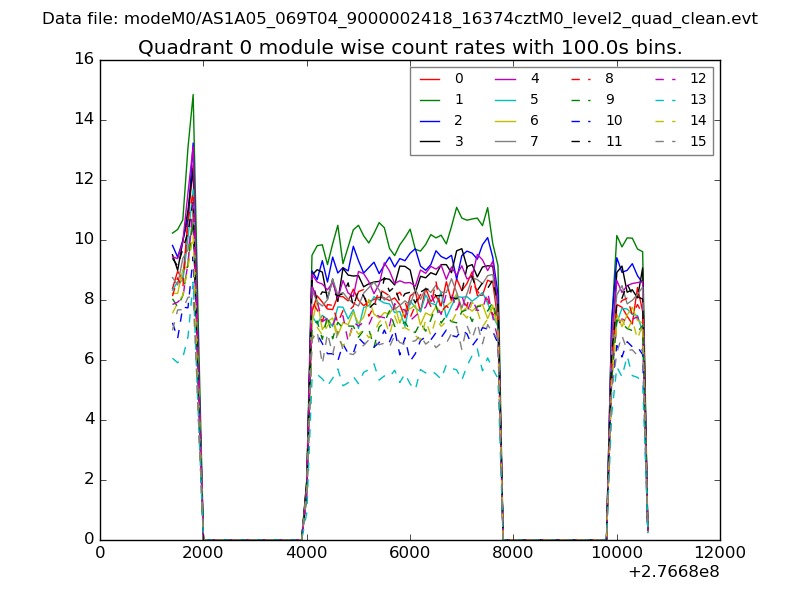 |
 |
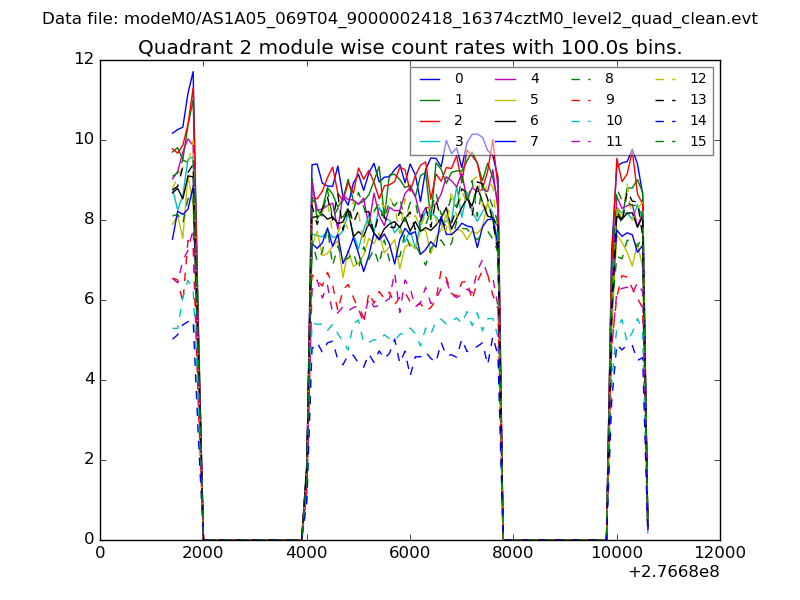
| Module-wise count rates for Quadrant B Data is divided into 100 sec bins |
 |
 |
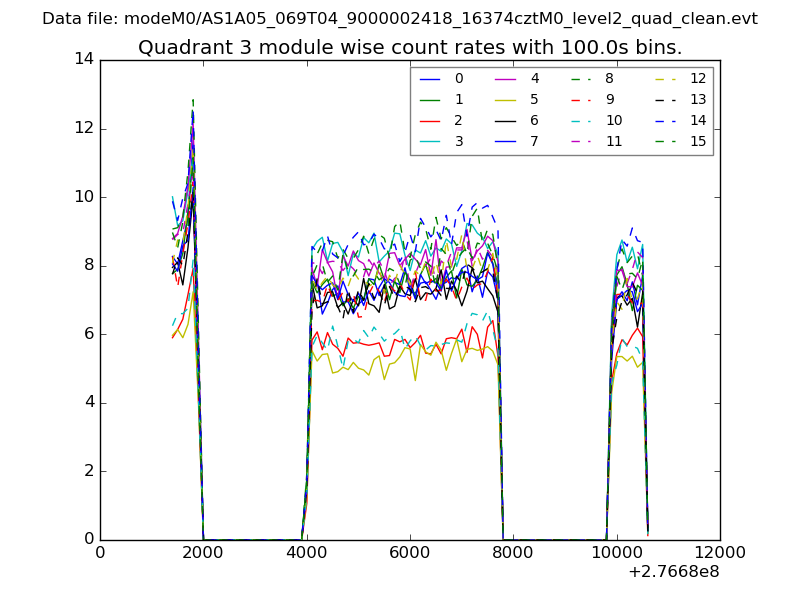
| Module-wise count rates for Quadrant C Data is divided into 100 sec bins |
 |
 |
| Module-wise count rates for Quadrant D Data is divided into 100 sec bins |
 |
 |
| Parameter | Plot |
|---|---|
| CZT HV Monitor | 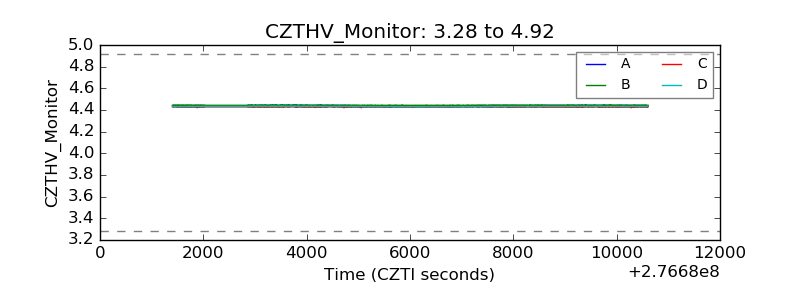 |
| D_VDD | 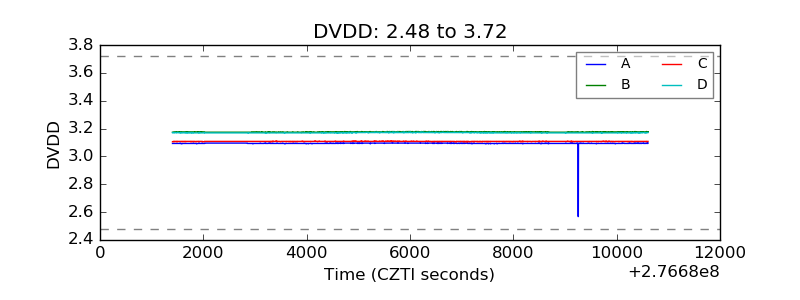 |
| Temperature 1 | 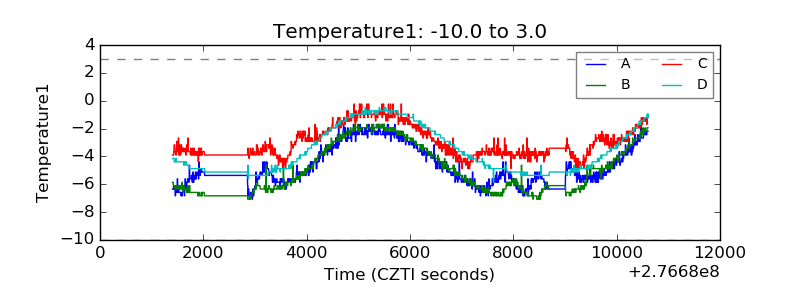 |
| Veto HV Monitor | 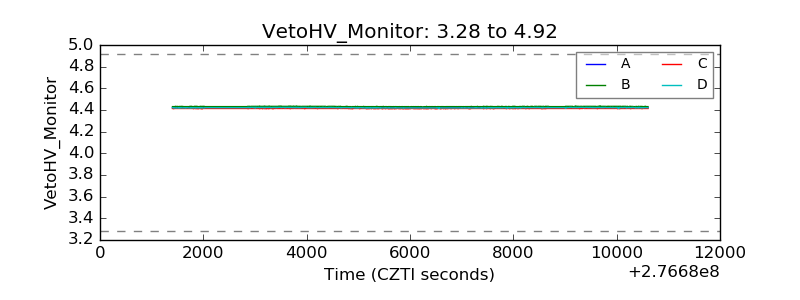 |
| Veto LLD | 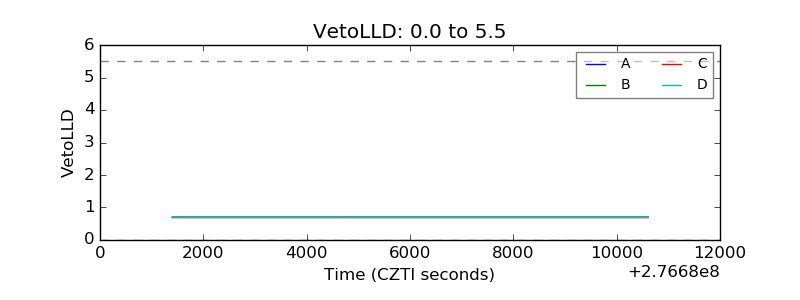 |
| Alpha Counter | 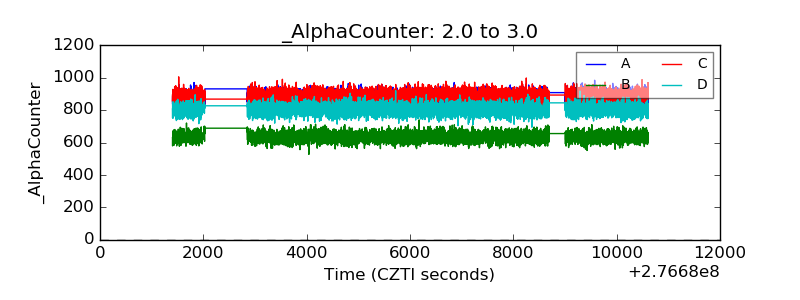 |
| _CPM_Rate | 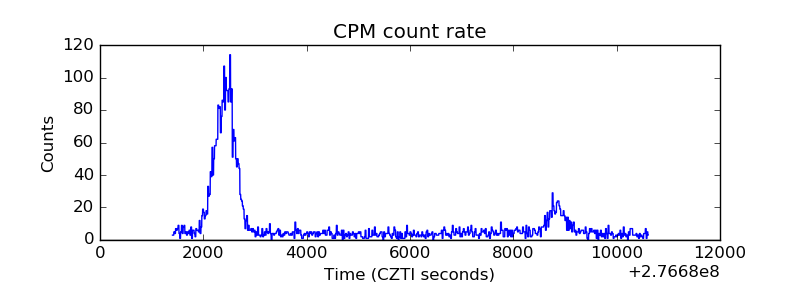 |
| CZT Counter | 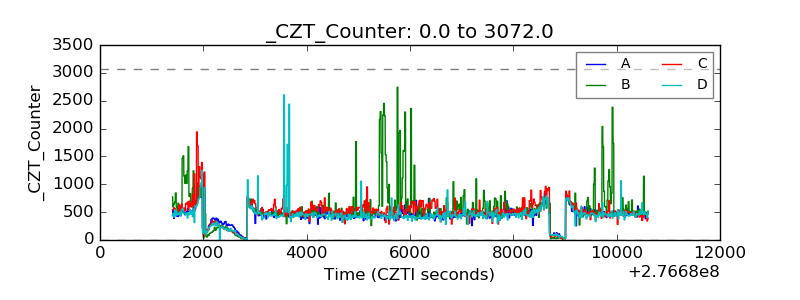 |
| +2.5 Volts monitor |  |
| +5 Volts monitor |  |
| _ROLL_ROT | 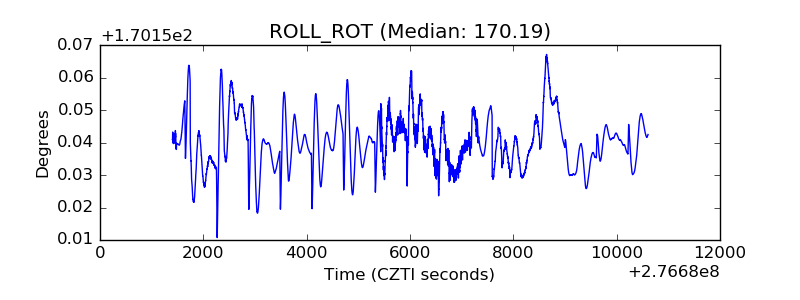 |
| _Roll_DEC | 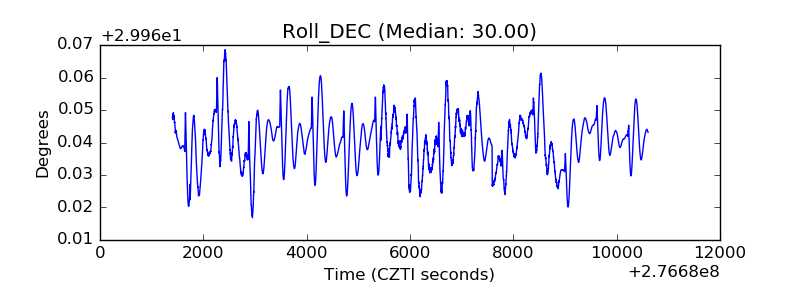 |
| _Roll_RA | 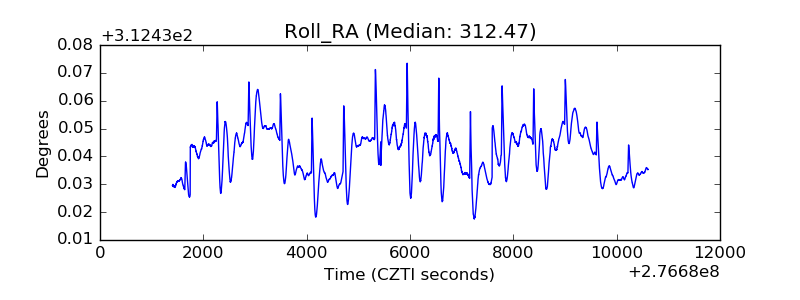 |
| Veto Counter | 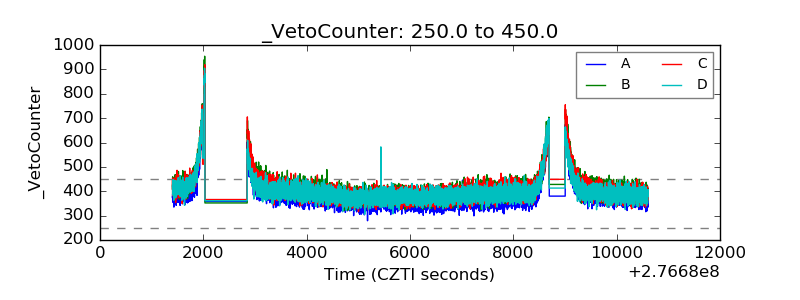 |