| Param | Original file | Final file |
|---|---|---|
| Filename | modeM0/AS1A05_069T04_9000002418_16375cztM0_level2.evt | modeM0/AS1A05_069T04_9000002418_16375cztM0_level2_quad_clean.evt |
| Size (bytes) | 522,270,720 | 93,467,520 |
| Size | 498.1 MB | 89.1 MB |
| Events in quadrant A | 3,898,020 | 592,842 |
| Events in quadrant B | 3,876,858 | 606,324 |
| Events in quadrant C | 3,651,947 | 578,960 |
| Events in quadrant D | 3,907,713 | 557,653 |
| Mode M0 | |||
|---|---|---|---|
| Quadrant | BADHDUFLAG | Total packets | Discarded packets |
| A | 0 | 16151 | 1 |
| B | 0 | 15901 | 0 |
| C | 0 | 15219 | 0 |
| D | 0 | 16321 | 0 |
| Mode SS | |||
|---|---|---|---|
| Quadrant | BADHDUFLAG | Total packets | Discarded packets |
| A | 0 | 142 | 0 |
| B | 0 | 142 | 0 |
| C | 0 | 142 | 0 |
| D | 0 | 142 | 0 |
| Quadrant | Total seconds | Saturated seconds | Saturation percentage |
|---|---|---|---|
| A | 7107 | 264 | 3.714648% |
| B | 7107 | 279 | 3.925707% |
| C | 7107 | 247 | 3.475447% |
| D | 7107 | 263 | 3.700577% |
Noise dominated data is calculated using 1-second bins in cleaned event files. If a bin has >2000 counts, and if more than 50% of those come from <1% of pixels, then it is considered to be noise-dominated and hence unusable.
| Quadrant | # 1 sec bins | Bins with >0 counts | Bins with >2000 counts | High rate bins dominated by noise | Noise dominated (total time) | Noise dominated (detector-on time) | Marked lightcurve |
|---|---|---|---|---|---|---|---|
| A | 7108 | 7108 | 19 | 19 | 0.27% | 0.27% | 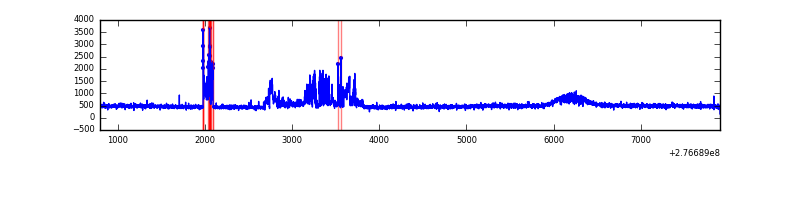 |
| B | 7108 | 7108 | 38 | 38 | 0.53% | 0.53% | 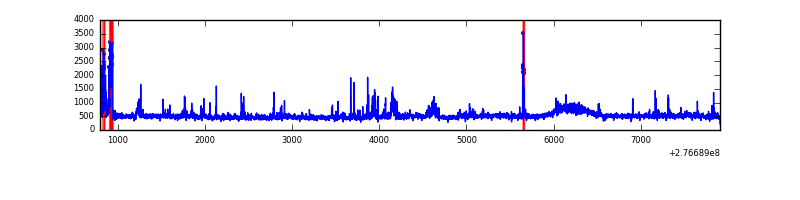 |
| C | 7108 | 7108 | 2 | 2 | 0.03% | 0.03% | 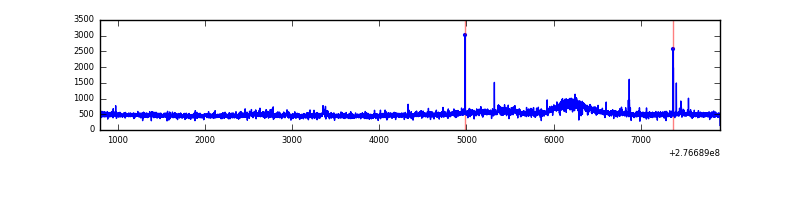 |
| D | 7108 | 7108 | 85 | 85 | 1.20% | 1.20% | 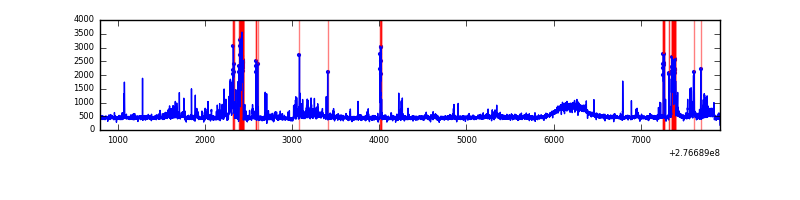 |
Top three noisy pixels from each quadrant. If the there are fewer than three noisy pixels in the level2.evt file, extra rows are filled as -1
| Pixel properties | Quadrant properties | ||||||
|---|---|---|---|---|---|---|---|
| Quadrant | DetID | PixID | Counts | Sigma | Mean | Median | Sigma |
| A | 15 | 174 | 517325 | 2898.39 | 872 | 853 | 178.2 |
| A | 3 | 1 | 11071 | 57.34 | 872 | 853 | 178.2 |
| A | 9 | 143 | 9751 | 49.93 | 872 | 853 | 178.2 |
| B | 10 | 16 | 165525 | 984.87 | 869 | 844 | 167.2 |
| B | 15 | 35 | 125257 | 744.05 | 869 | 844 | 167.2 |
| B | 4 | 173 | 48300 | 283.81 | 869 | 844 | 167.2 |
| C | 3 | 233 | 234277 | 1186.95 | 835 | 840 | 196.7 |
| C | 14 | 238 | 127138 | 642.18 | 835 | 840 | 196.7 |
| C | 10 | 169 | 31887 | 157.86 | 835 | 840 | 196.7 |
| D | 12 | 218 | 325166 | 1545.47 | 852 | 827 | 209.9 |
| D | 1 | 52 | 233512 | 1108.74 | 852 | 827 | 209.9 |
| D | 12 | 110 | 52158 | 244.59 | 852 | 827 | 209.9 |
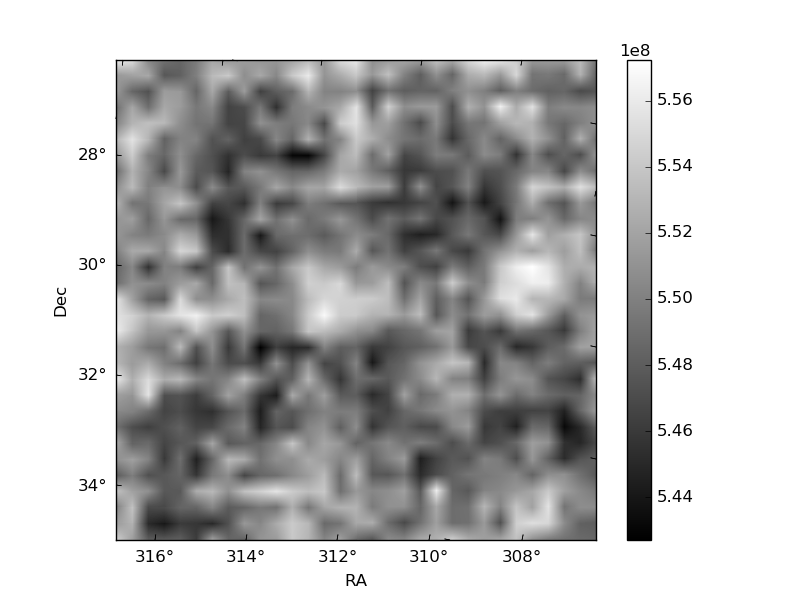
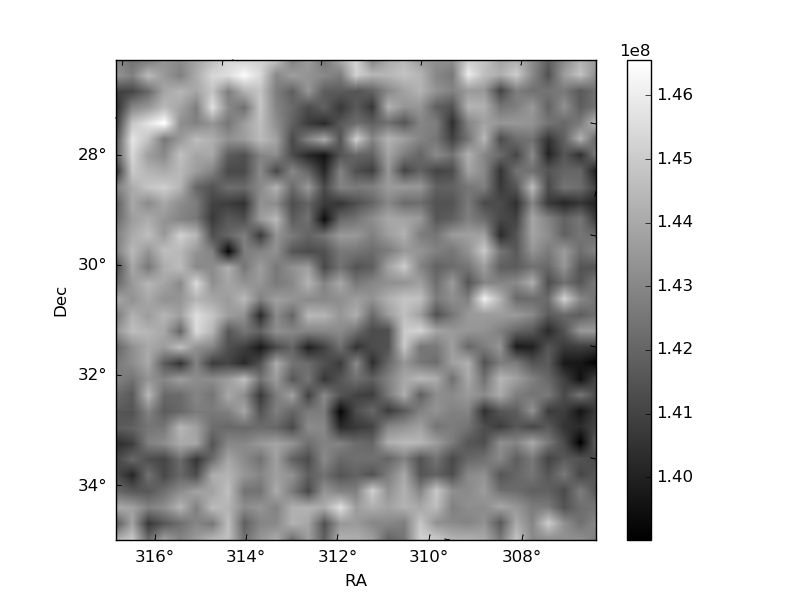
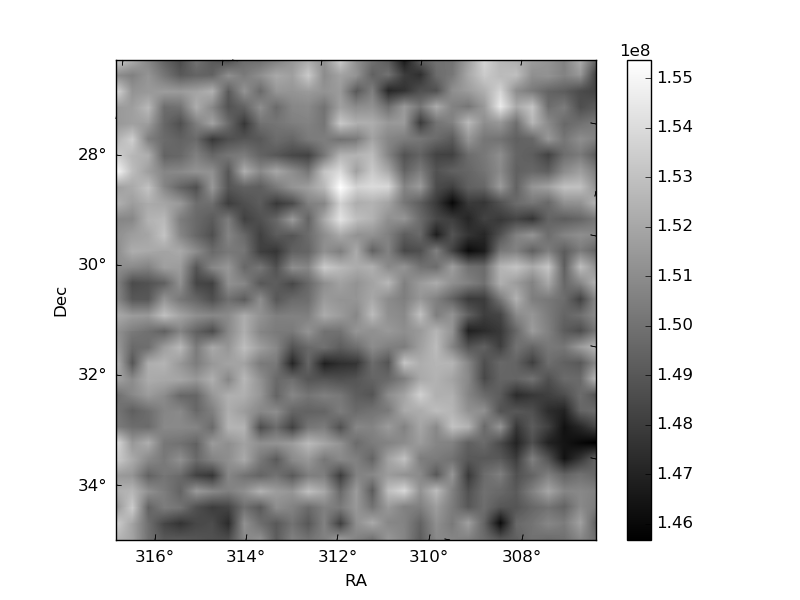
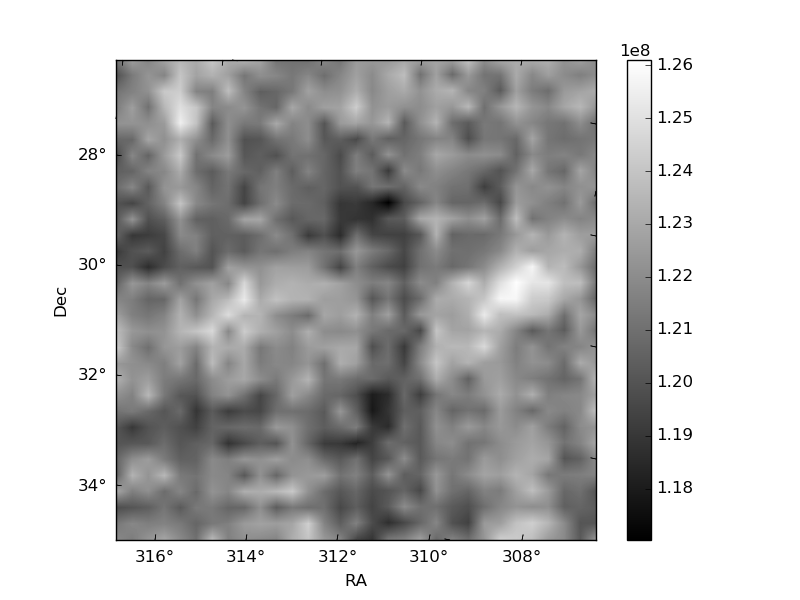
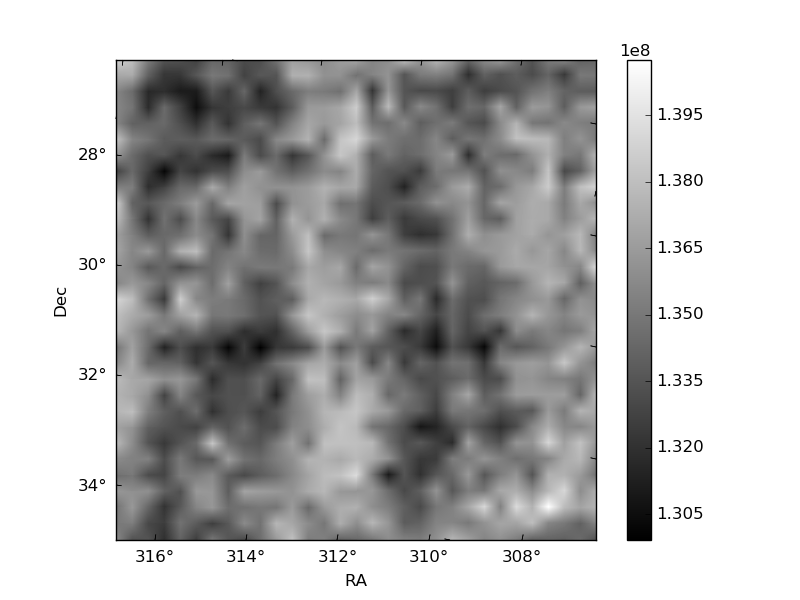
Histogram calculated using DETX and DETY for each event in the final _common_clean file
| Quadrant A | 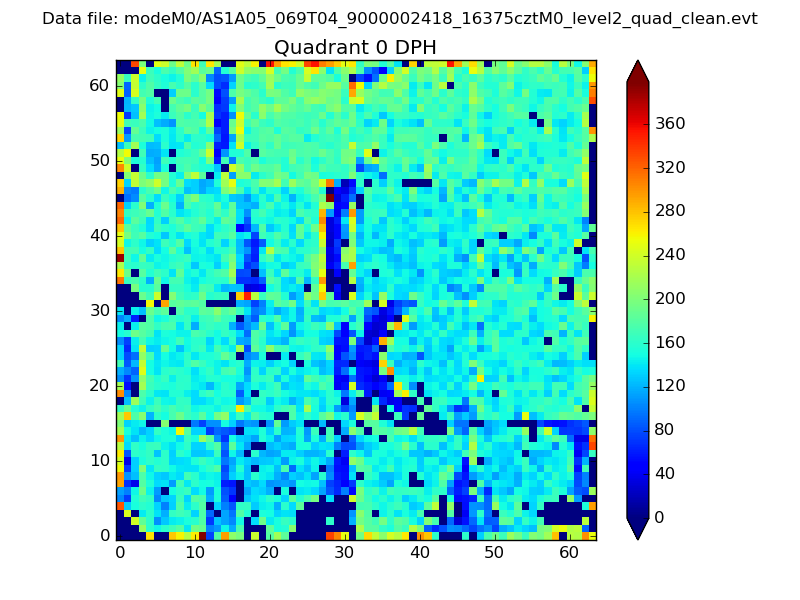 |
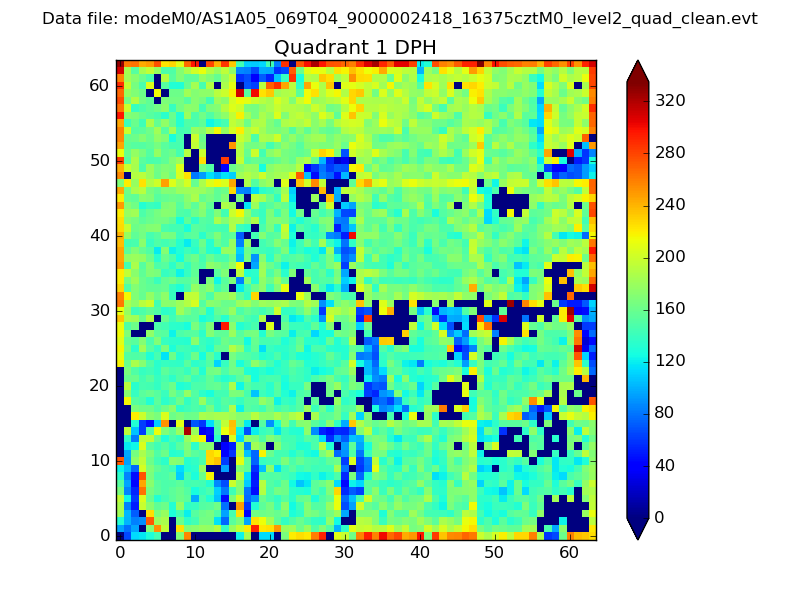 |
Quadrant B |
|---|---|---|---|
| Quadrant D | 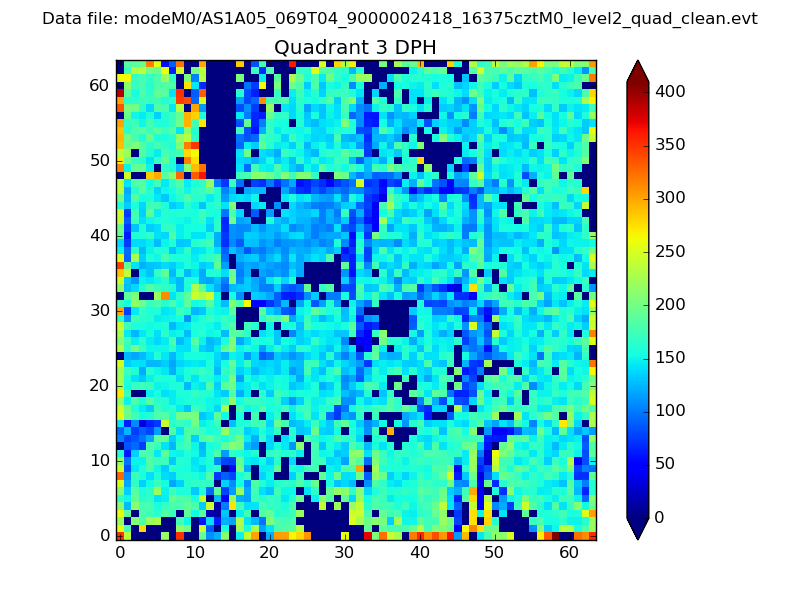 |
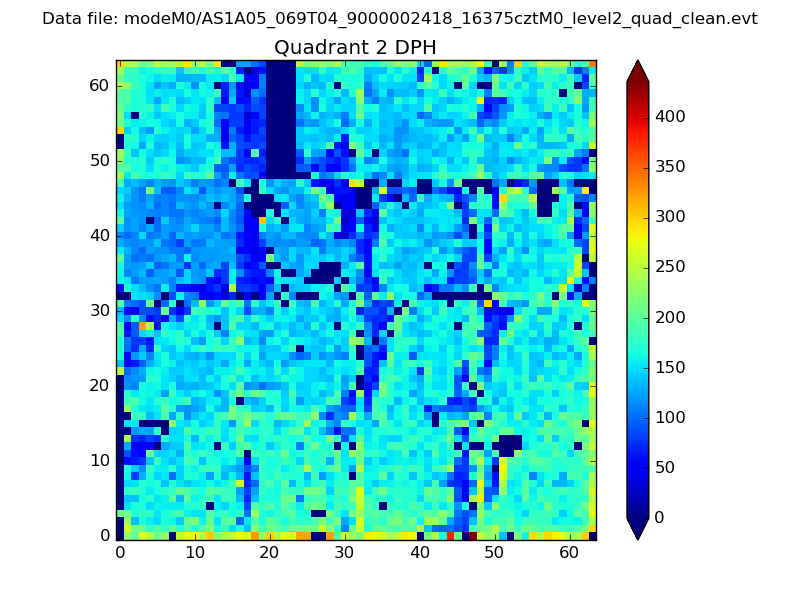 |
Quadrant C |
| Plot type | Count rate plots | Images |
|---|---|---|
| Comparison with Poisson distribution Blue bars denote a histogram of data divided into 1 sec bins. Red curve is a Poisson curve with rate = median count rate of data. |
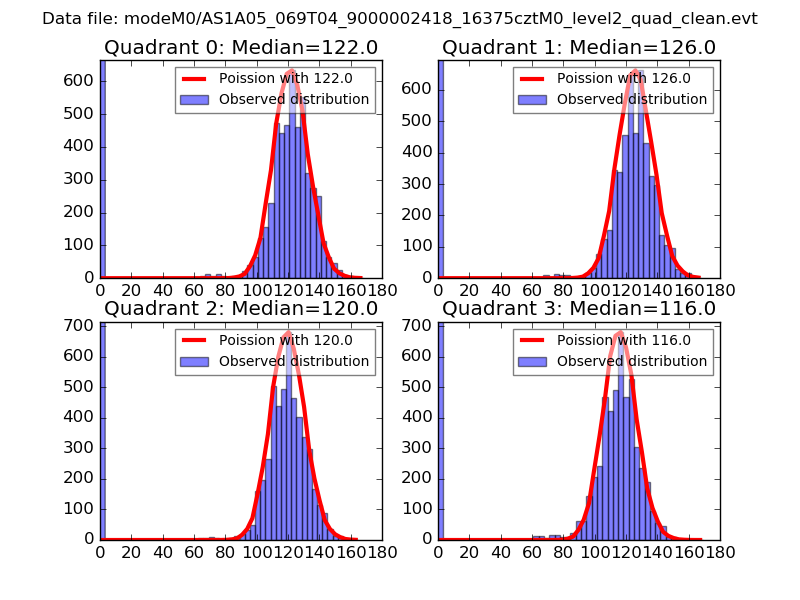 |
 |
| Quadrant-wise count rates Data is divided into 100 sec bins |
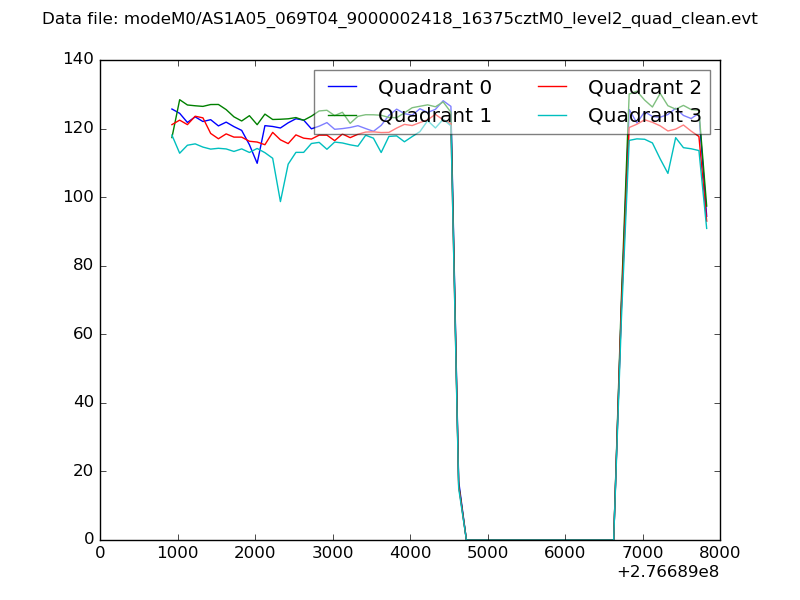 |
|
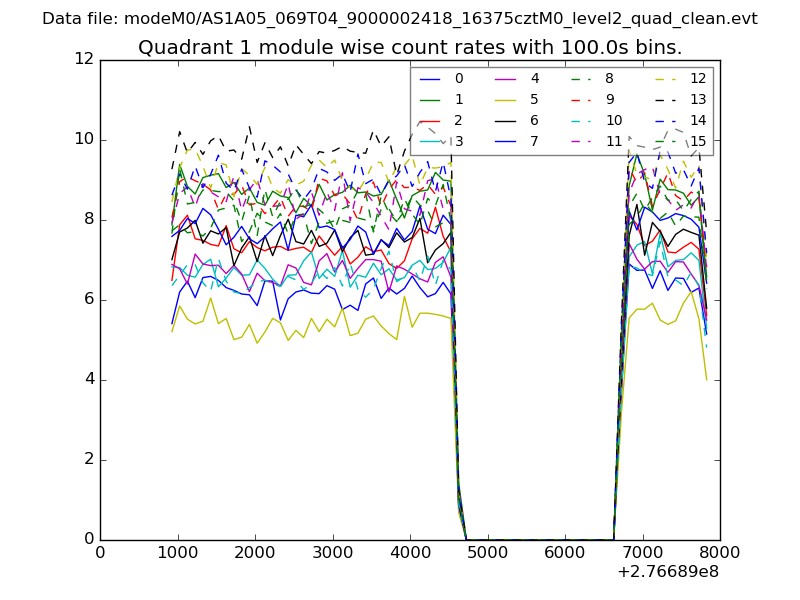
| Module-wise count rates for Quadrant A Data is divided into 100 sec bins |
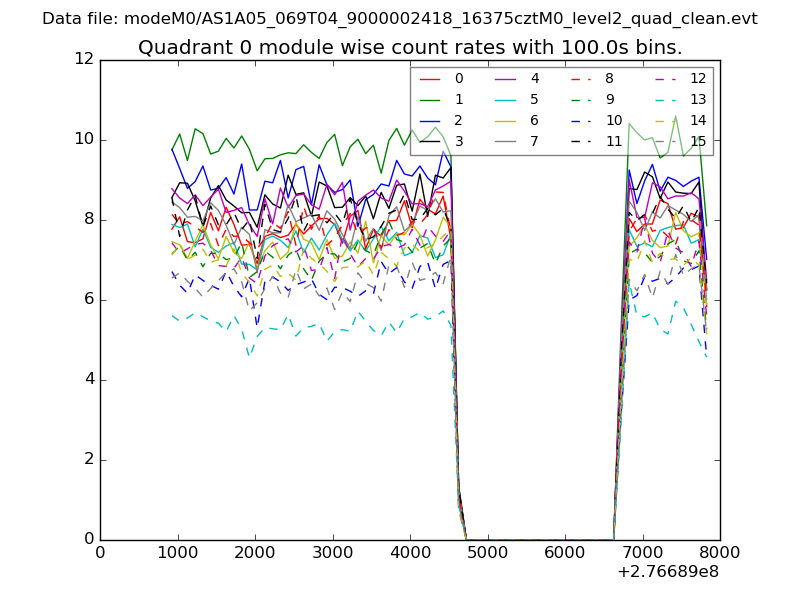 |
 |
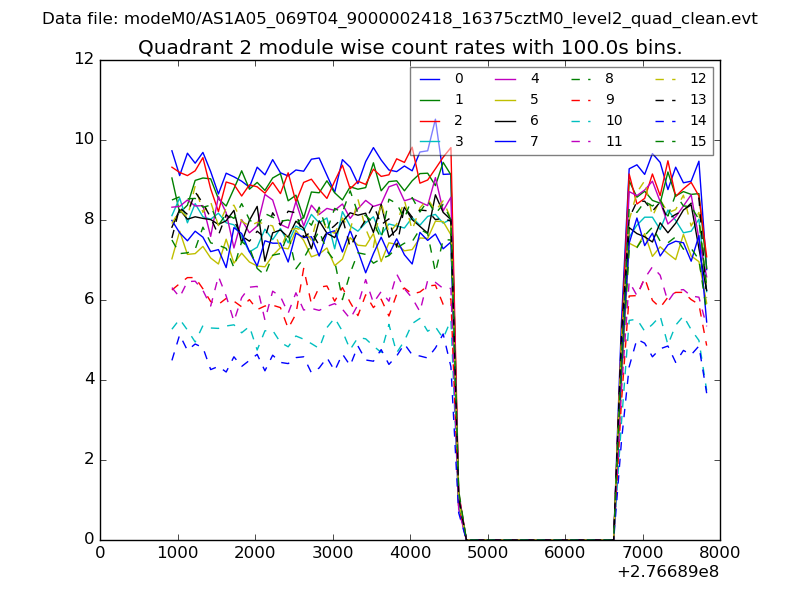
| Module-wise count rates for Quadrant B Data is divided into 100 sec bins |
 |
 |
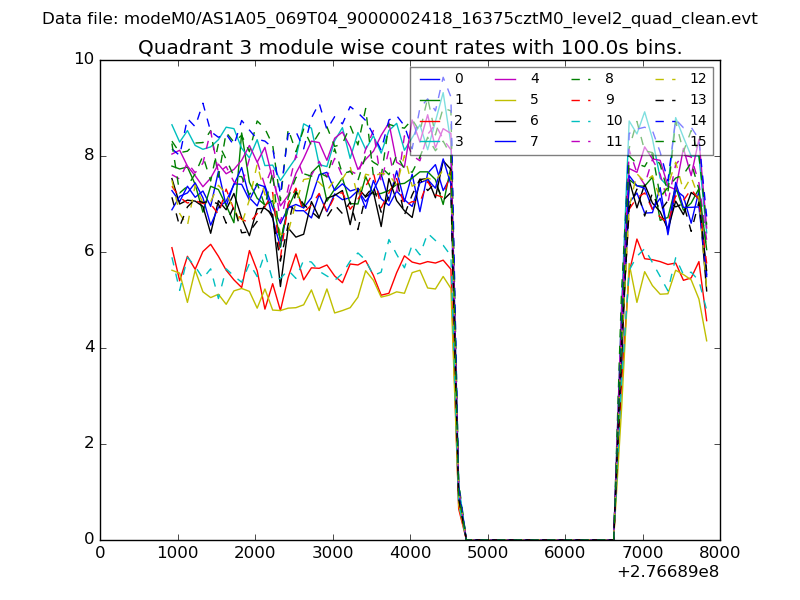
| Module-wise count rates for Quadrant C Data is divided into 100 sec bins |
 |
 |
| Module-wise count rates for Quadrant D Data is divided into 100 sec bins |
 |
 |
| Parameter | Plot |
|---|---|
| CZT HV Monitor | 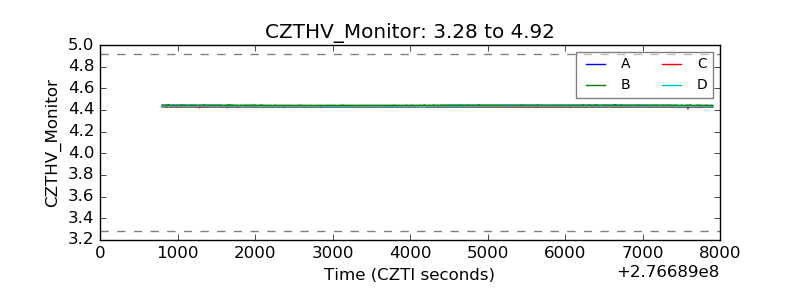 |
| D_VDD | 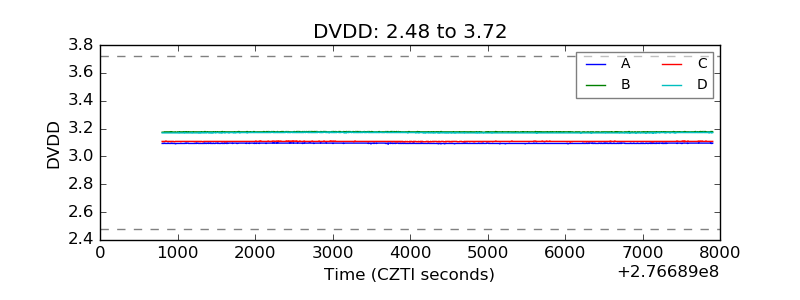 |
| Temperature 1 | 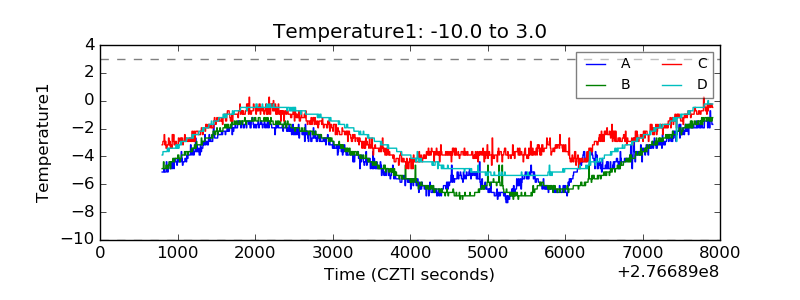 |
| Veto HV Monitor | 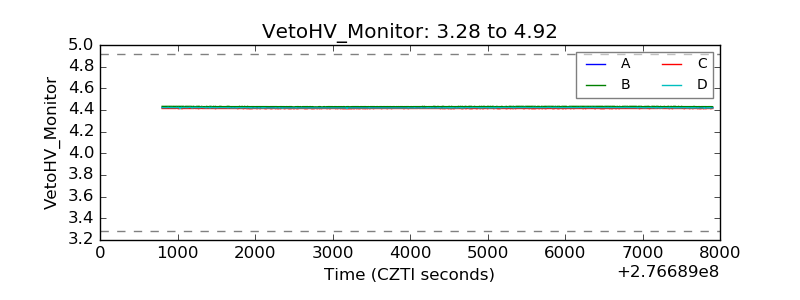 |
| Veto LLD | 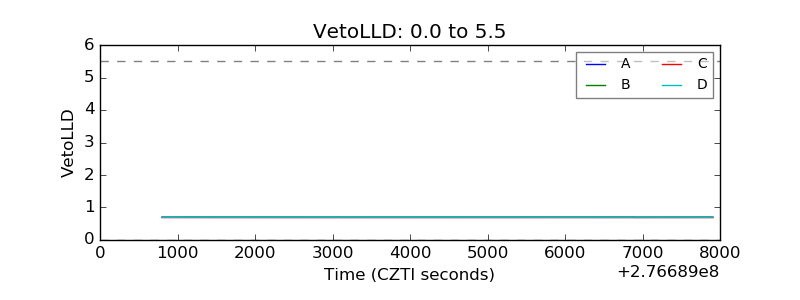 |
| Alpha Counter | 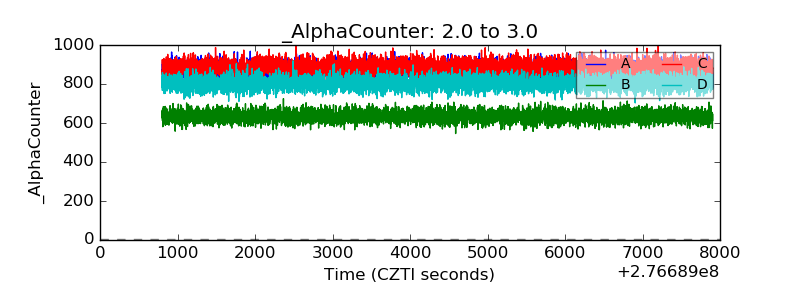 |
| _CPM_Rate | 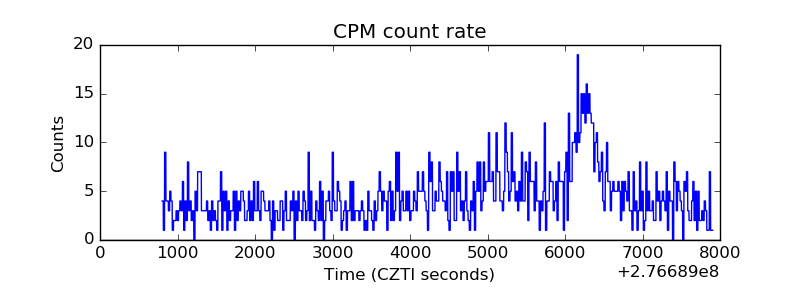 |
| CZT Counter | 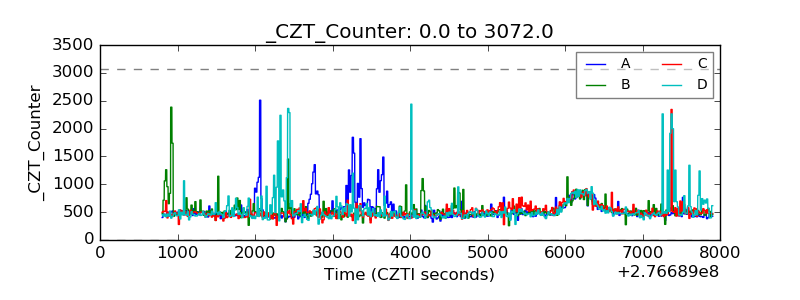 |
| +2.5 Volts monitor | 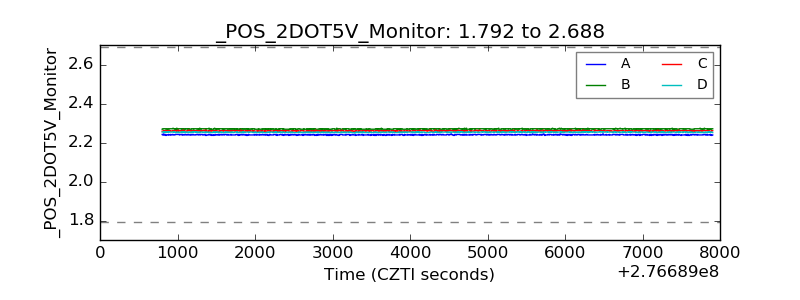 |
| +5 Volts monitor | 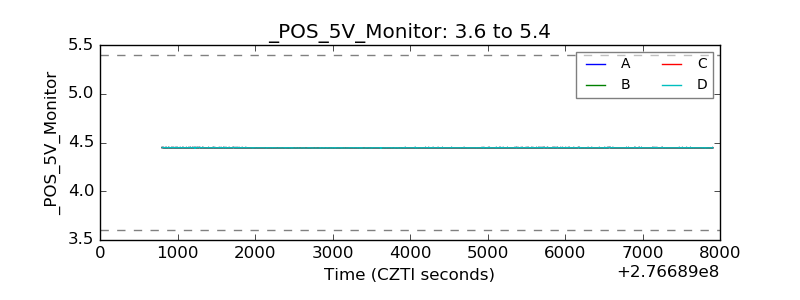 |
| _ROLL_ROT | 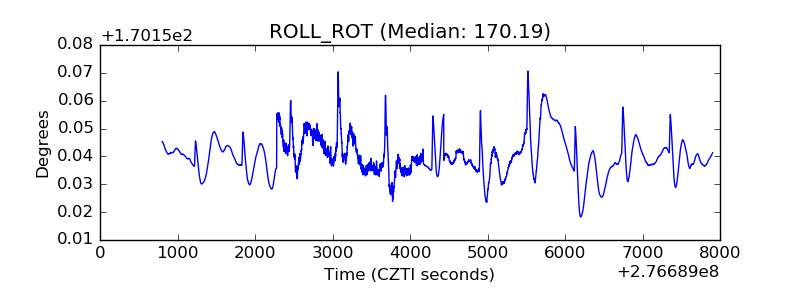 |
| _Roll_DEC | 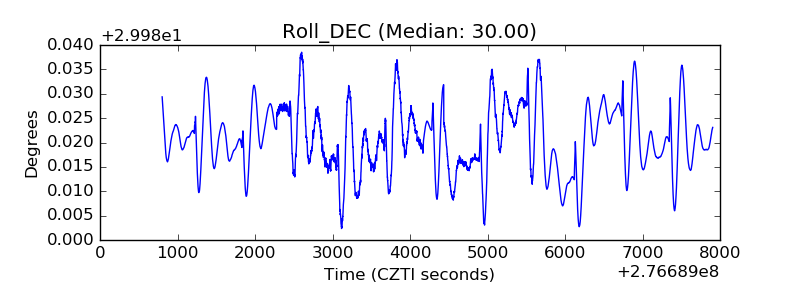 |
| _Roll_RA | 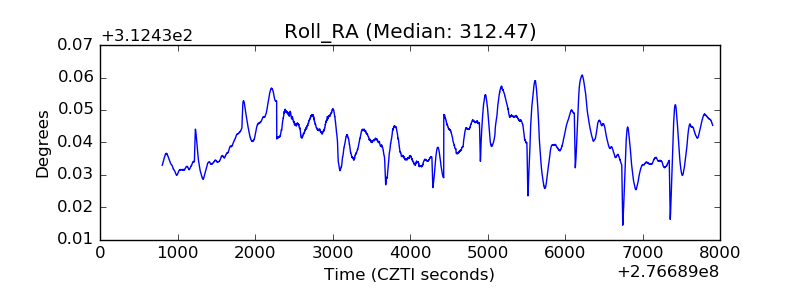 |
| Veto Counter | 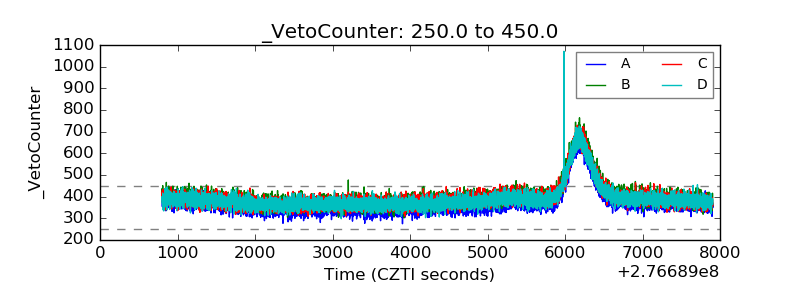 |