| Param | Original file | Final file |
|---|---|---|
| Filename | modeM0/AS1A05_069T04_9000002418_16378cztM0_level2.evt | modeM0/AS1A05_069T04_9000002418_16378cztM0_level2_quad_clean.evt |
| Size (bytes) | 589,429,440 | 95,019,840 |
| Size | 562.1 MB | 90.6 MB |
| Events in quadrant A | 4,607,139 | 589,348 |
| Events in quadrant B | 4,484,885 | 601,121 |
| Events in quadrant C | 4,353,401 | 590,876 |
| Events in quadrant D | 3,902,235 | 580,044 |
| Mode M0 | |||
|---|---|---|---|
| Quadrant | BADHDUFLAG | Total packets | Discarded packets |
| A | 0 | 25380 | 6756 |
| B | 0 | 23580 | 5611 |
| C | 0 | 23110 | 5263 |
| D | 0 | 22174 | 5298 |
| Mode M9 | |||
|---|---|---|---|
| Quadrant | BADHDUFLAG | Total packets | Discarded packets |
| A | 0 | 10 | 4 |
| B | 0 | 10 | 5 |
| C | 0 | 11 | 6 |
| D | 0 | 10 | 5 |
| Mode SS | |||
|---|---|---|---|
| Quadrant | BADHDUFLAG | Total packets | Discarded packets |
| A | 0 | 205 | 57 |
| B | 0 | 206 | 50 |
| C | 0 | 198 | 46 |
| D | 0 | 203 | 57 |
| Quadrant | Total seconds | Saturated seconds | Saturation percentage |
|---|---|---|---|
| A | 7408 | 390 | 5.264579% |
| B | 7365 | 271 | 3.679566% |
| C | 7426 | 347 | 4.672771% |
| D | 7431 | 98 | 1.318800% |
Noise dominated data is calculated using 1-second bins in cleaned event files. If a bin has >2000 counts, and if more than 50% of those come from <1% of pixels, then it is considered to be noise-dominated and hence unusable.
| Quadrant | # 1 sec bins | Bins with >0 counts | Bins with >2000 counts | High rate bins dominated by noise | Noise dominated (total time) | Noise dominated (detector-on time) | Marked lightcurve |
|---|---|---|---|---|---|---|---|
| A | 11348 | 7755 | 334 | 334 | 2.94% | 4.31% | 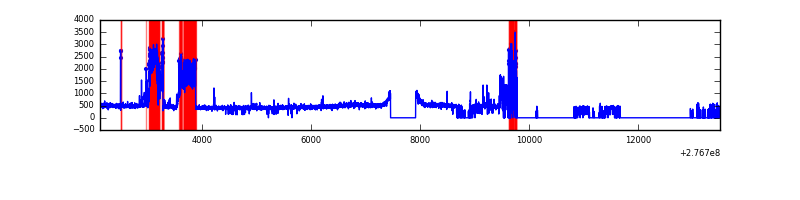 |
| B | 11354 | 7702 | 150 | 150 | 1.32% | 1.95% | 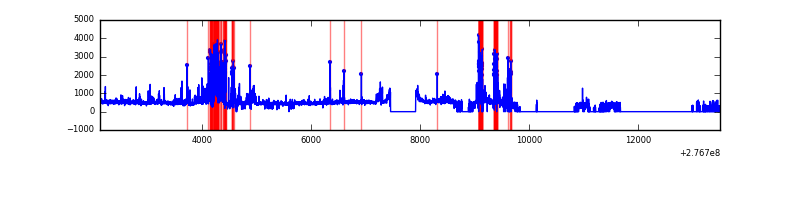 |
| C | 11359 | 7736 | 80 | 80 | 0.70% | 1.03% | 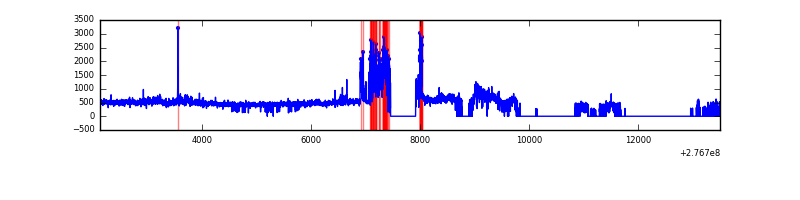 |
| D | 11352 | 7770 | 47 | 47 | 0.41% | 0.60% | 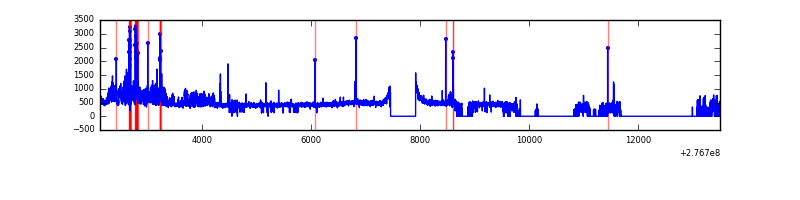 |
Top three noisy pixels from each quadrant. If the there are fewer than three noisy pixels in the level2.evt file, extra rows are filled as -1
| Pixel properties | Quadrant properties | ||||||
|---|---|---|---|---|---|---|---|
| Quadrant | DetID | PixID | Counts | Sigma | Mean | Median | Sigma |
| A | 15 | 174 | 1239437 | 7101.62 | 864 | 843 | 174.4 |
| A | 15 | 223 | 26288 | 145.89 | 864 | 843 | 174.4 |
| A | 9 | 143 | 18538 | 101.45 | 864 | 843 | 174.4 |
| B | 10 | 16 | 673647 | 4033.64 | 864 | 843 | 166.8 |
| B | 15 | 35 | 94579 | 561.97 | 864 | 843 | 166.8 |
| B | 0 | 197 | 64783 | 383.34 | 864 | 843 | 166.8 |
| C | 3 | 233 | 978324 | 5030.53 | 831 | 835 | 194.3 |
| C | 14 | 238 | 126183 | 645.09 | 831 | 835 | 194.3 |
| C | 13 | 61 | 6155 | 27.38 | 831 | 835 | 194.3 |
| D | 12 | 110 | 379054 | 1802.78 | 854 | 827 | 209.8 |
| D | 12 | 218 | 174713 | 828.81 | 854 | 827 | 209.8 |
| D | 1 | 52 | 55954 | 262.76 | 854 | 827 | 209.8 |
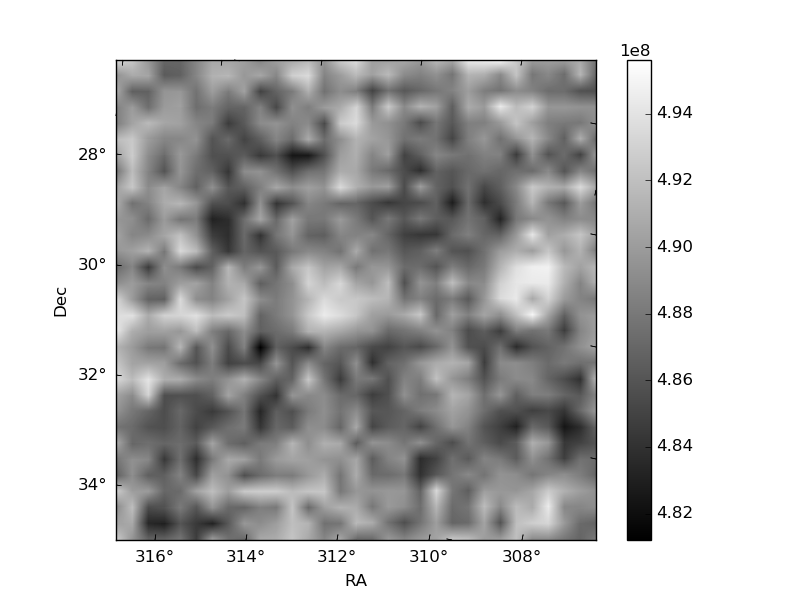
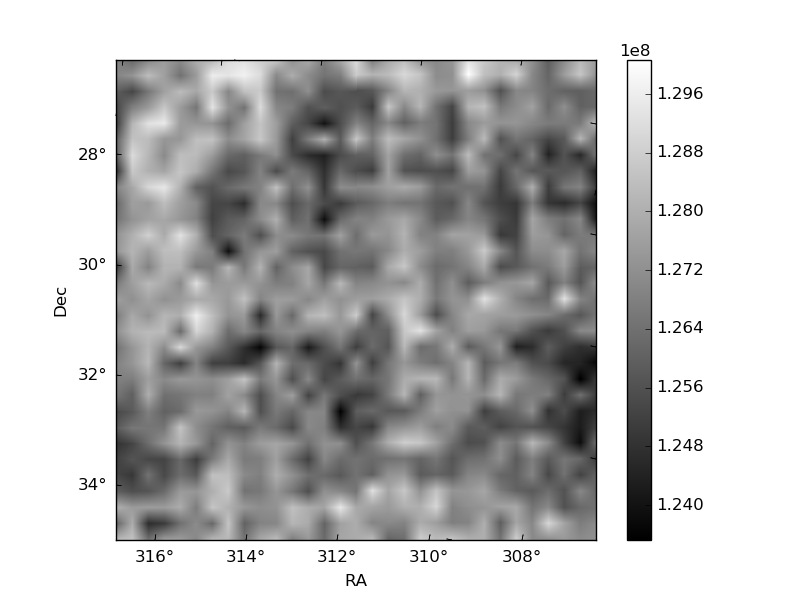
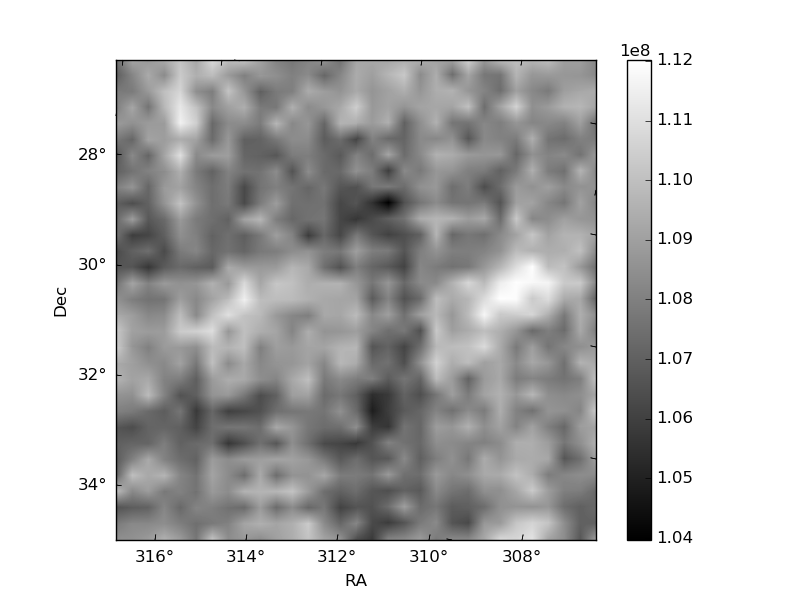
Histogram calculated using DETX and DETY for each event in the final _common_clean file
| Quadrant A | 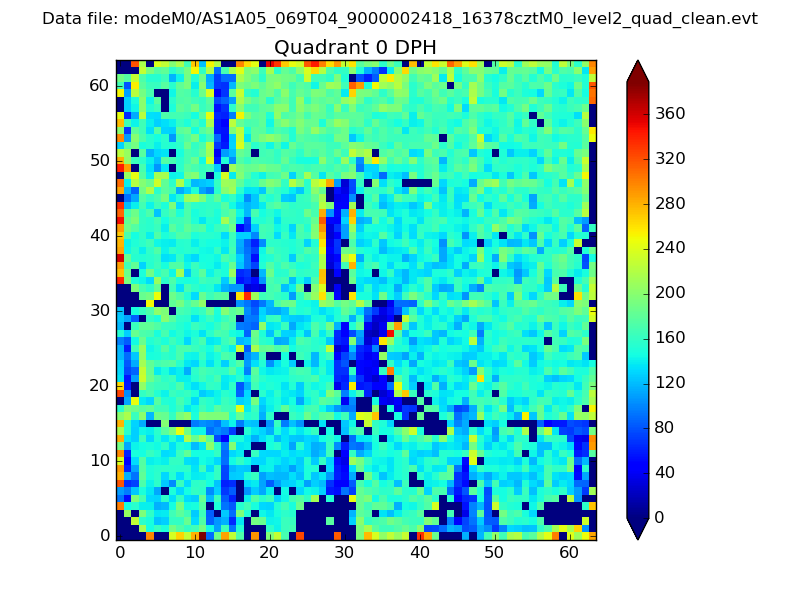 |
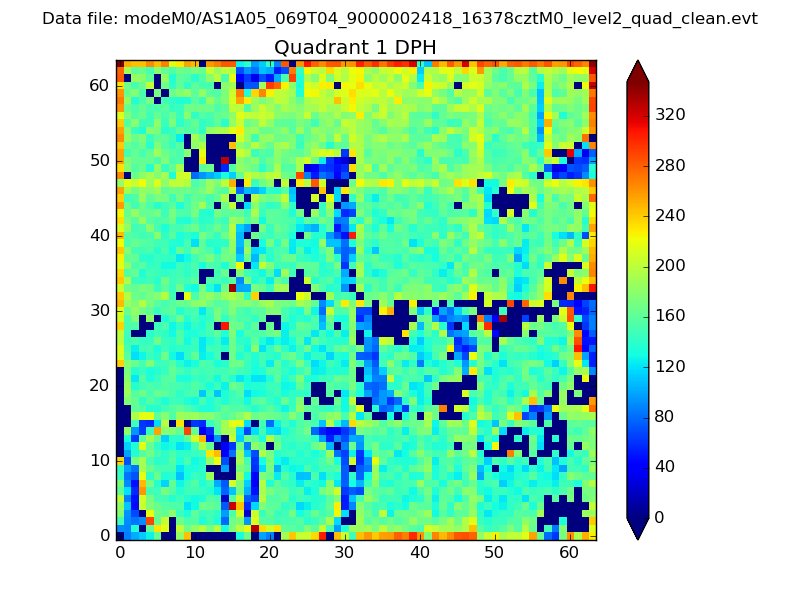 |
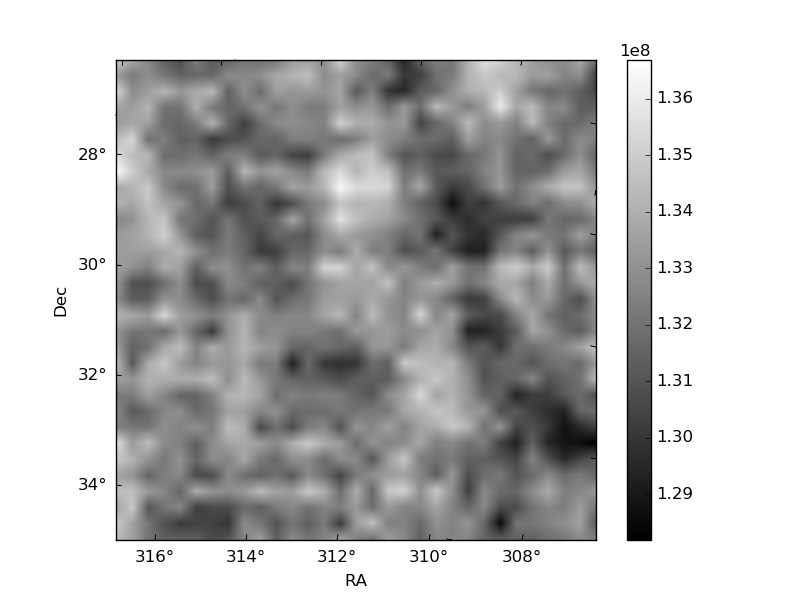
Quadrant B |
|---|---|---|---|
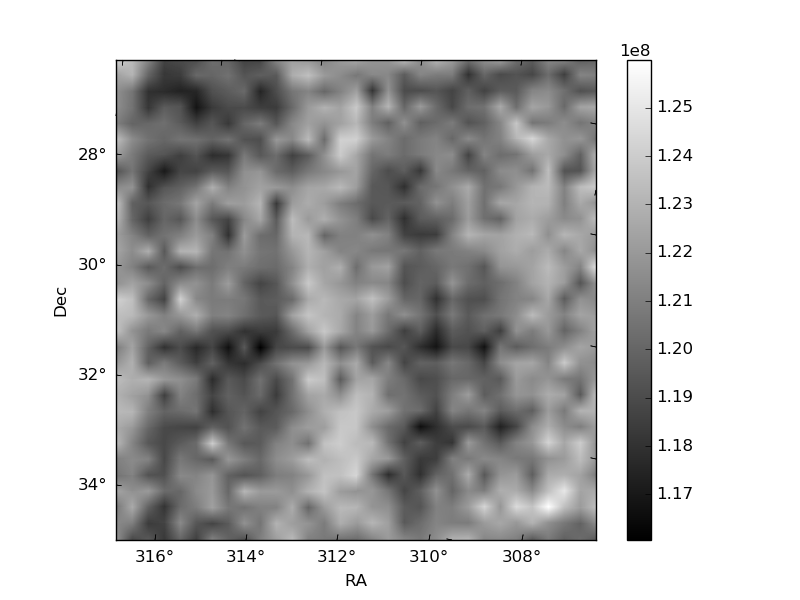
| Quadrant D | 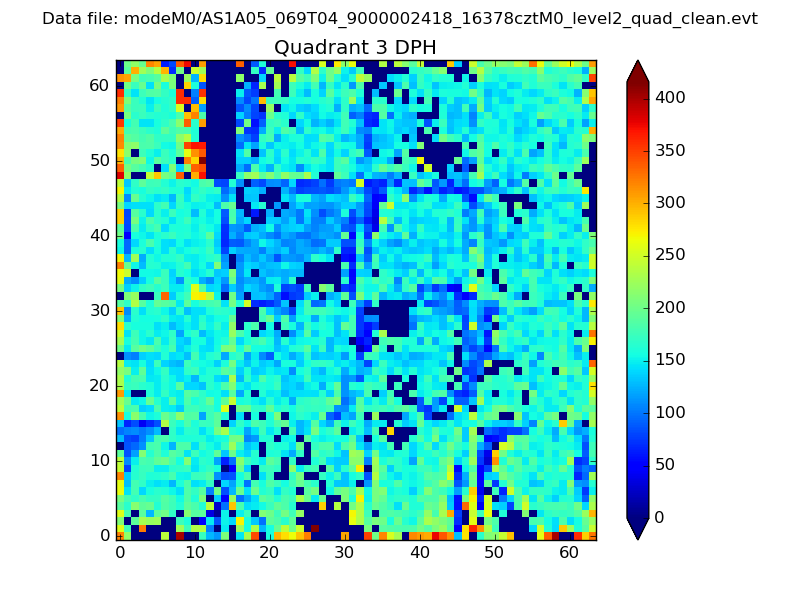 |
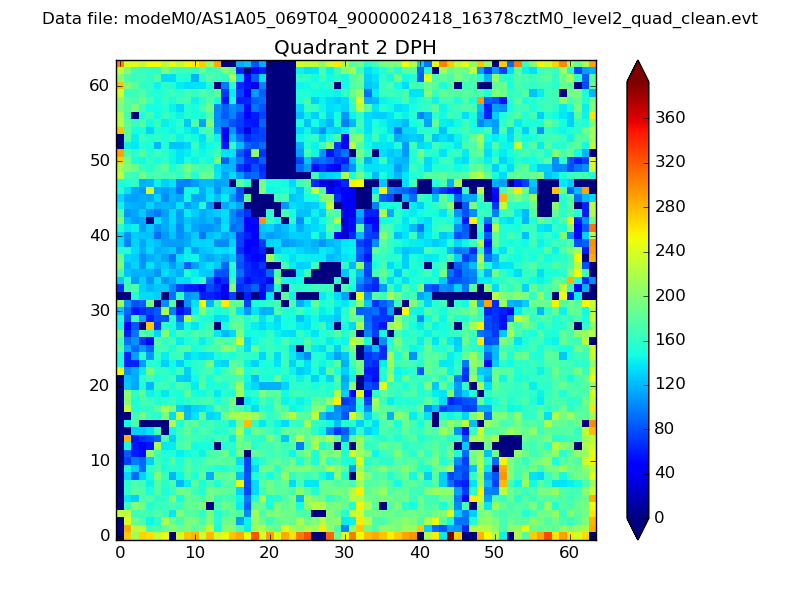 |
Quadrant C |
| Plot type | Count rate plots | Images |
|---|---|---|
| Comparison with Poisson distribution Blue bars denote a histogram of data divided into 1 sec bins. Red curve is a Poisson curve with rate = median count rate of data. |
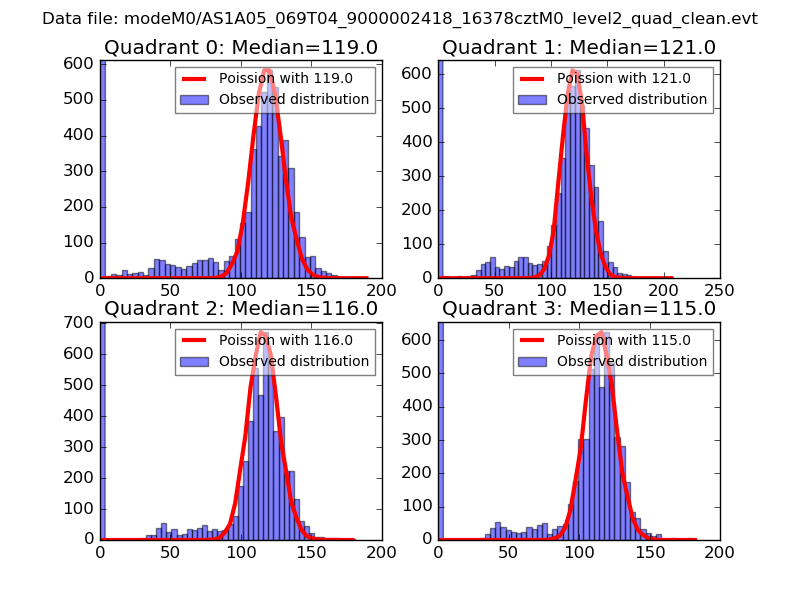 |
 |
| Quadrant-wise count rates Data is divided into 100 sec bins |
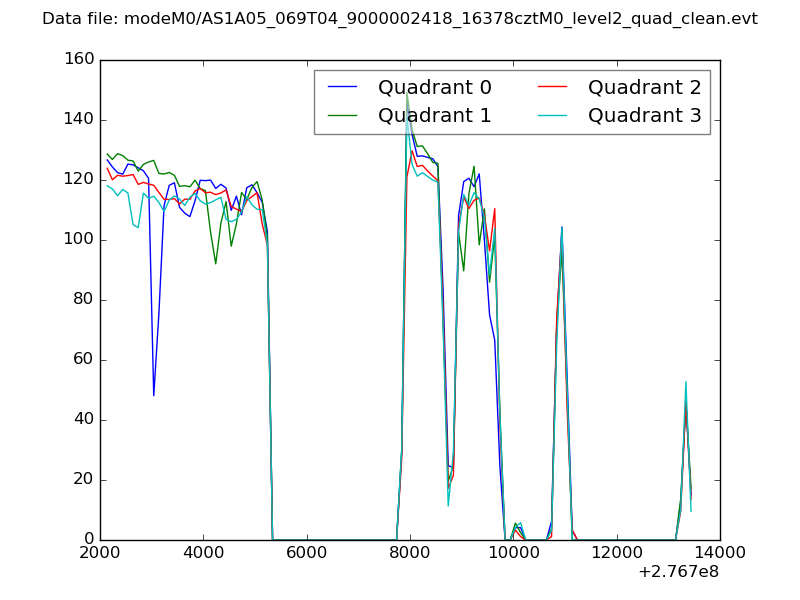 |
|
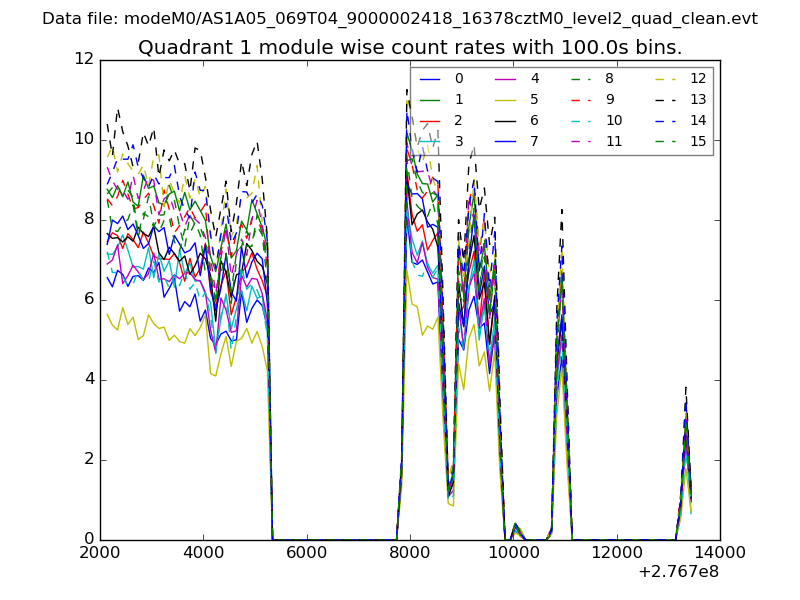
| Module-wise count rates for Quadrant A Data is divided into 100 sec bins |
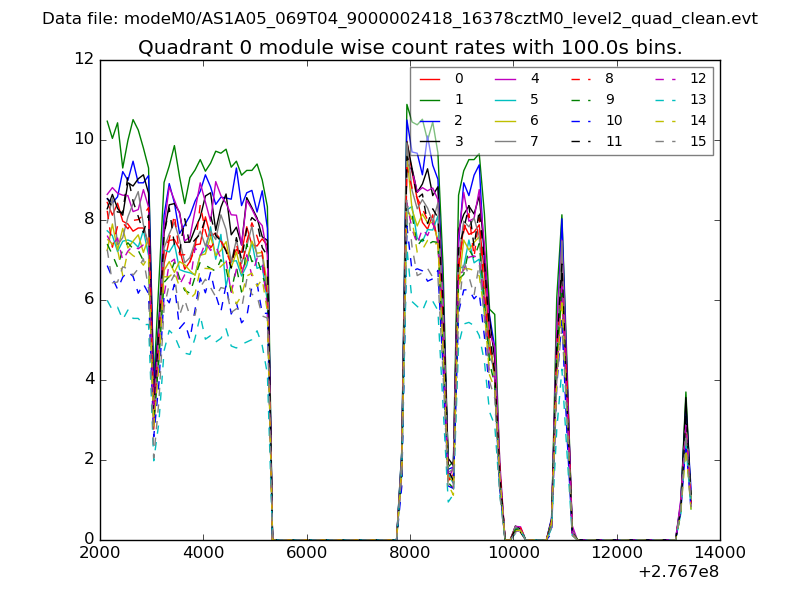 |
 |
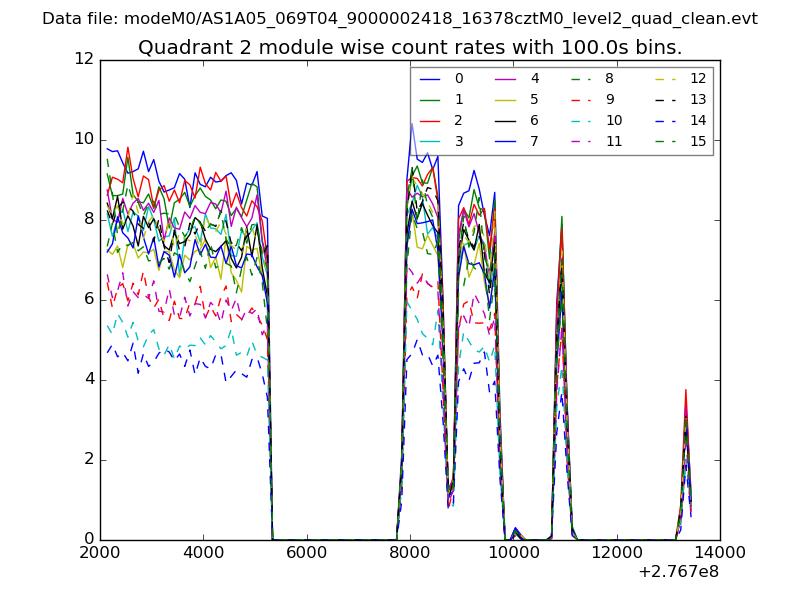
| Module-wise count rates for Quadrant B Data is divided into 100 sec bins |
 |
 |
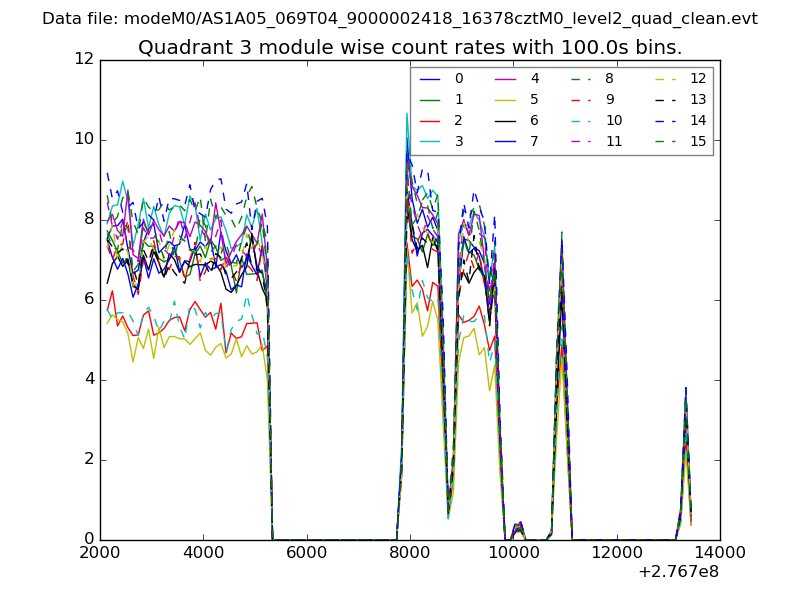
| Module-wise count rates for Quadrant C Data is divided into 100 sec bins |
 |
 |
| Module-wise count rates for Quadrant D Data is divided into 100 sec bins |
 |
 |
| Parameter | Plot |
|---|---|
| CZT HV Monitor | 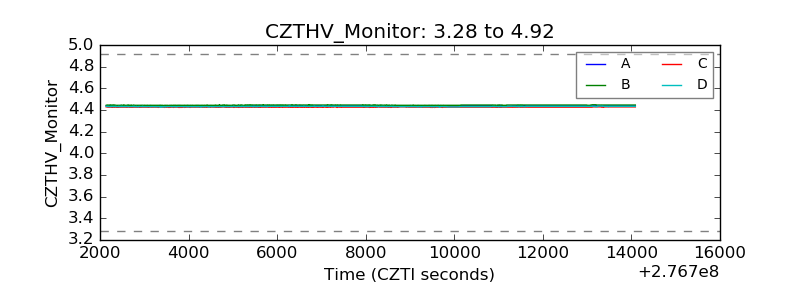 |
| D_VDD | 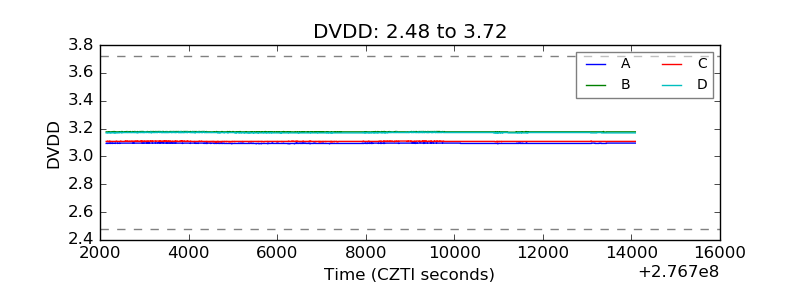 |
| Temperature 1 | 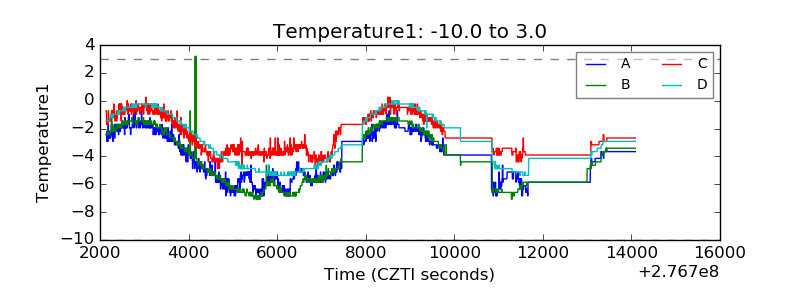 |
| Veto HV Monitor | 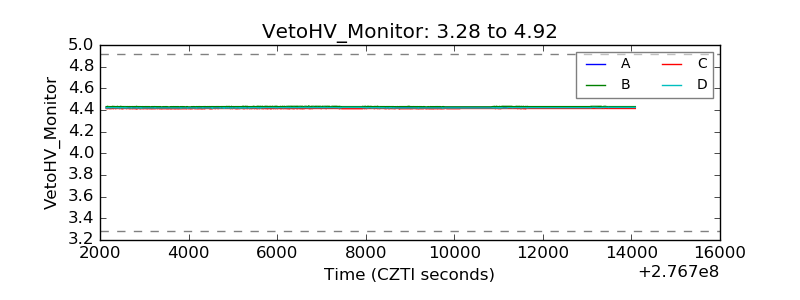 |
| Veto LLD | 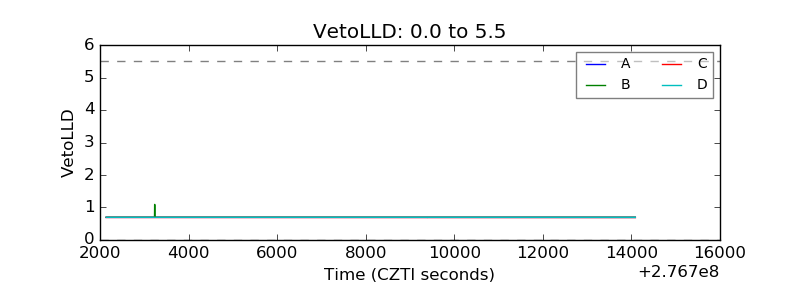 |
| Alpha Counter | 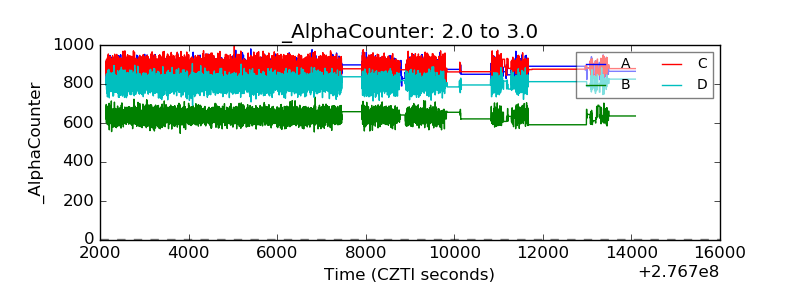 |
| _CPM_Rate | 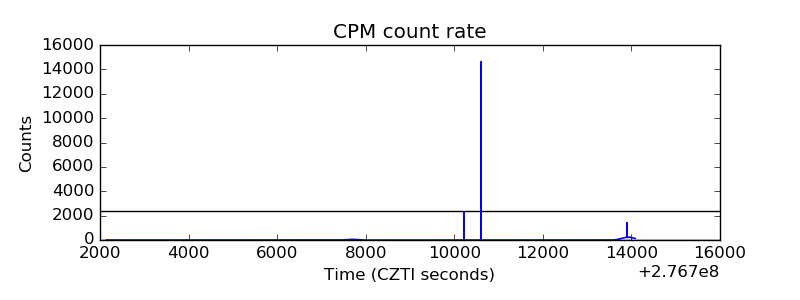 |
| CZT Counter | 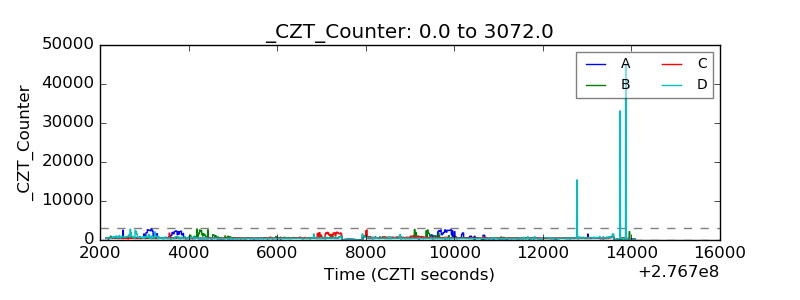 |
| +2.5 Volts monitor | 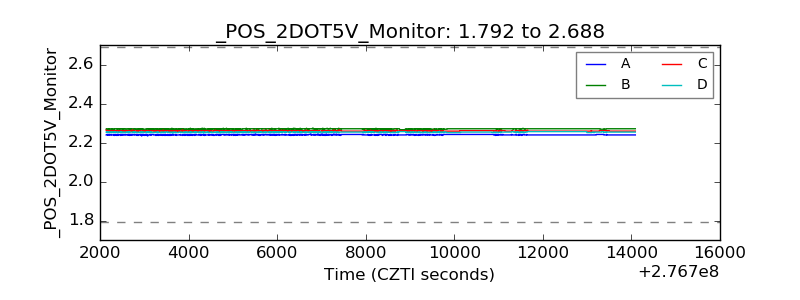 |
| +5 Volts monitor | 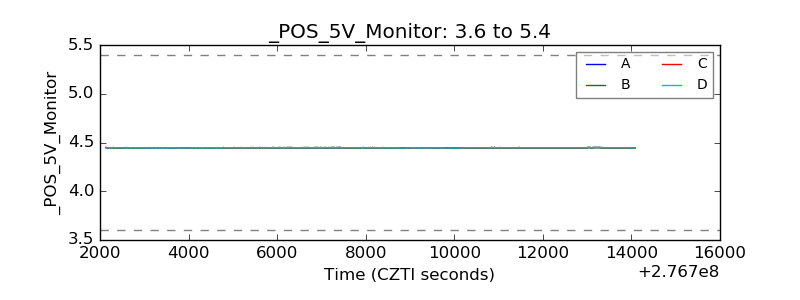 |
| _ROLL_ROT | 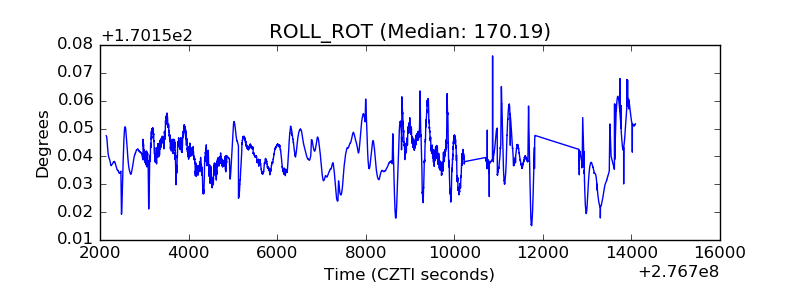 |
| _Roll_DEC | 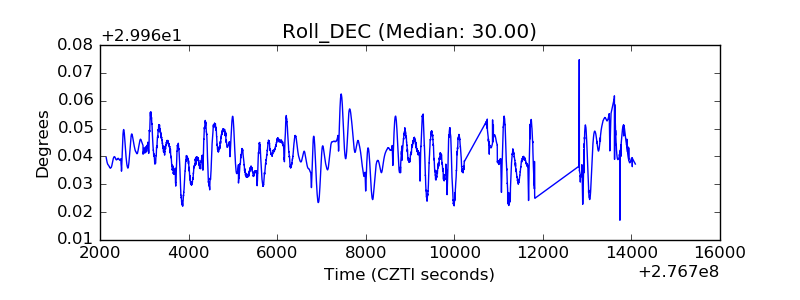 |
| _Roll_RA | 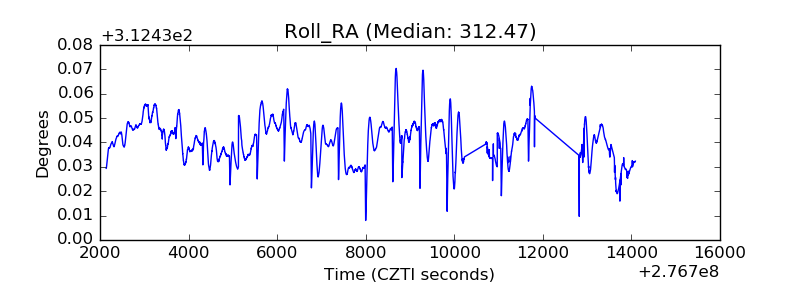 |
| Veto Counter | 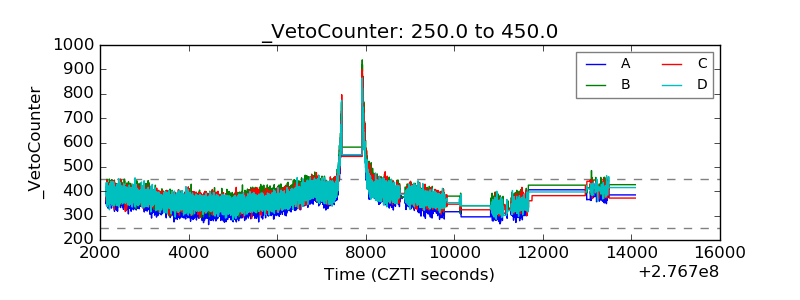 |