| Param | Original file | Final file |
|---|---|---|
| Filename | modeM0/AS1A05_069T04_9000002418_16379cztM0_level2.evt | modeM0/AS1A05_069T04_9000002418_16379cztM0_level2_quad_clean.evt |
| Size (bytes) | 481,674,240 | 83,986,560 |
| Size | 459.4 MB | 80.1 MB |
| Events in quadrant A | 3,504,314 | 535,836 |
| Events in quadrant B | 3,580,718 | 543,724 |
| Events in quadrant C | 3,255,976 | 521,183 |
| Events in quadrant D | 3,812,510 | 496,571 |
| Mode M0 | |||
|---|---|---|---|
| Quadrant | BADHDUFLAG | Total packets | Discarded packets |
| A | 0 | 14706 | 2 |
| B | 0 | 14846 | 2 |
| C | 0 | 13941 | 2 |
| D | 0 | 15754 | 2 |
| Mode M9 | |||
|---|---|---|---|
| Quadrant | BADHDUFLAG | Total packets | Discarded packets |
| A | 0 | 14 | 0 |
| B | 0 | 14 | 0 |
| C | 0 | 14 | 0 |
| D | 0 | 14 | 0 |
| Mode SS | |||
|---|---|---|---|
| Quadrant | BADHDUFLAG | Total packets | Discarded packets |
| A | 0 | 134 | 0 |
| B | 0 | 134 | 0 |
| C | 0 | 134 | 0 |
| D | 0 | 134 | 0 |
| Quadrant | Total seconds | Saturated seconds | Saturation percentage |
|---|---|---|---|
| A | 6384 | 96 | 1.503759% |
| B | 6384 | 115 | 1.801378% |
| C | 6384 | 115 | 1.801378% |
| D | 6384 | 256 | 4.010025% |
Noise dominated data is calculated using 1-second bins in cleaned event files. If a bin has >2000 counts, and if more than 50% of those come from <1% of pixels, then it is considered to be noise-dominated and hence unusable.
| Quadrant | # 1 sec bins | Bins with >0 counts | Bins with >2000 counts | High rate bins dominated by noise | Noise dominated (total time) | Noise dominated (detector-on time) | Marked lightcurve |
|---|---|---|---|---|---|---|---|
| A | 7900 | 6387 | 11 | 11 | 0.14% | 0.17% | 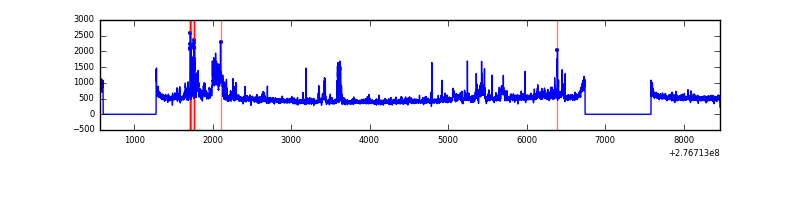 |
| B | 7900 | 6386 | 25 | 25 | 0.32% | 0.39% | 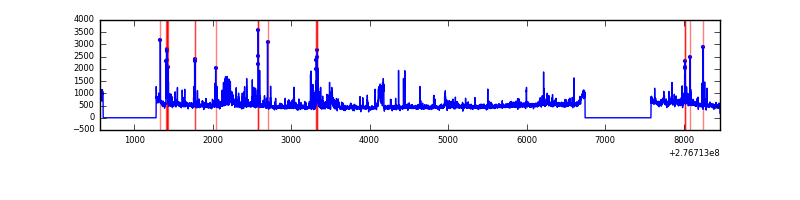 |
| C | 7900 | 6387 | 1 | 1 | 0.01% | 0.02% | 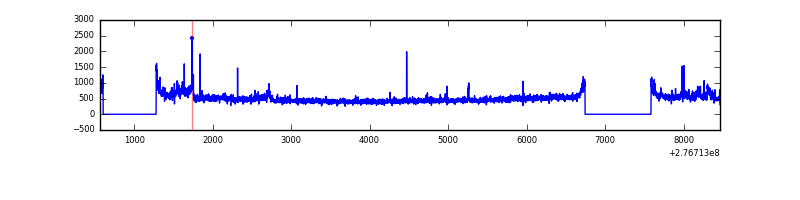 |
| D | 7900 | 6387 | 108 | 108 | 1.37% | 1.69% | 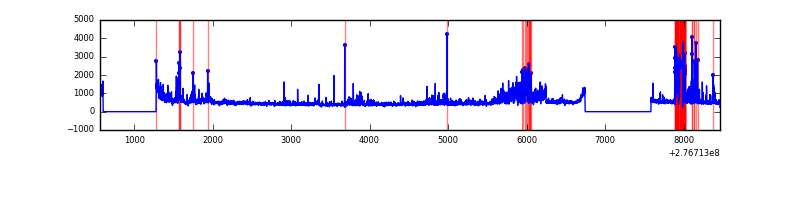 |
Top three noisy pixels from each quadrant. If the there are fewer than three noisy pixels in the level2.evt file, extra rows are filled as -1
| Pixel properties | Quadrant properties | ||||||
|---|---|---|---|---|---|---|---|
| Quadrant | DetID | PixID | Counts | Sigma | Mean | Median | Sigma |
| A | 15 | 174 | 474687 | 3049.17 | 764 | 746 | 155.4 |
| A | 15 | 223 | 48750 | 308.84 | 764 | 746 | 155.4 |
| A | 9 | 143 | 20921 | 129.8 | 764 | 746 | 155.4 |
| B | 10 | 16 | 201812 | 1360.99 | 765 | 745 | 147.7 |
| B | 15 | 35 | 105944 | 712.08 | 765 | 745 | 147.7 |
| B | 0 | 189 | 64772 | 433.39 | 765 | 745 | 147.7 |
| C | 3 | 233 | 261265 | 1502.9 | 736 | 742 | 173.3 |
| C | 14 | 238 | 111865 | 641.05 | 736 | 742 | 173.3 |
| C | 10 | 169 | 10499 | 56.29 | 736 | 742 | 173.3 |
| D | 1 | 52 | 565006 | 3115.52 | 735 | 714 | 181.1 |
| D | 12 | 218 | 368524 | 2030.72 | 735 | 714 | 181.1 |
| D | 10 | 70 | 28448 | 153.12 | 735 | 714 | 181.1 |
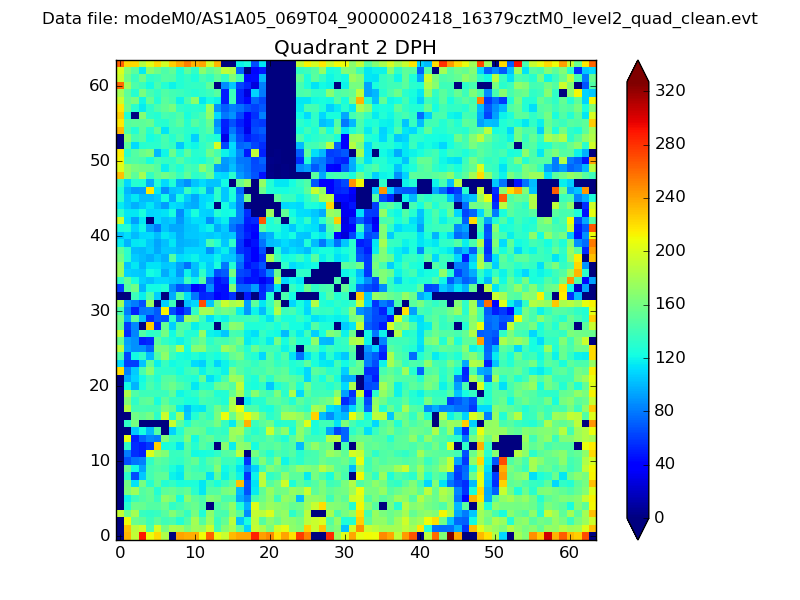
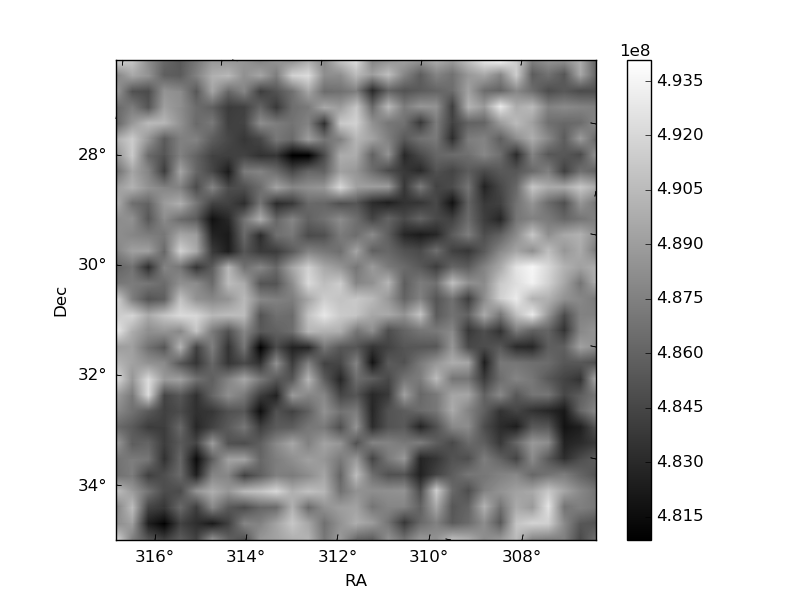
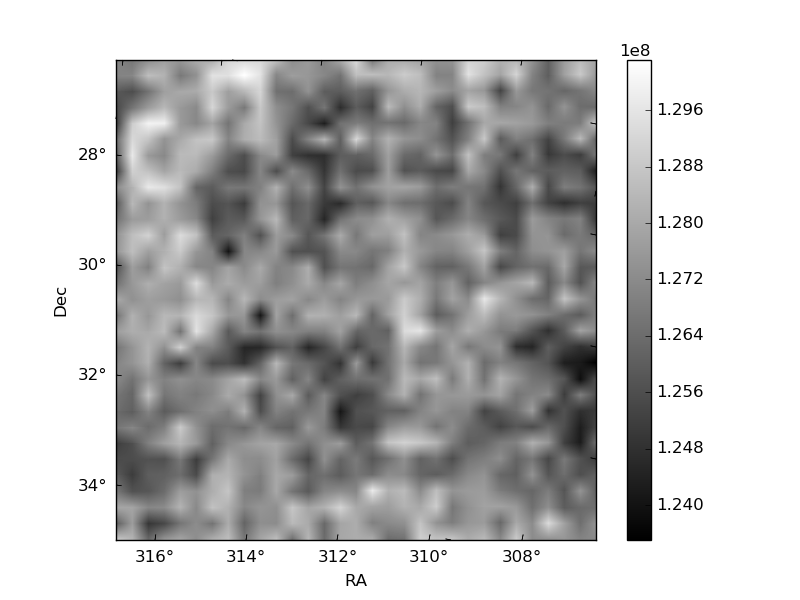
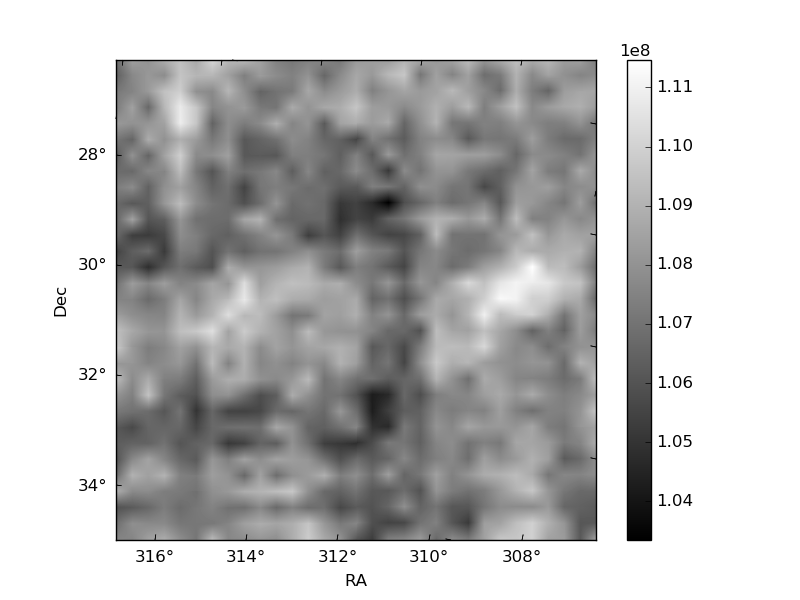
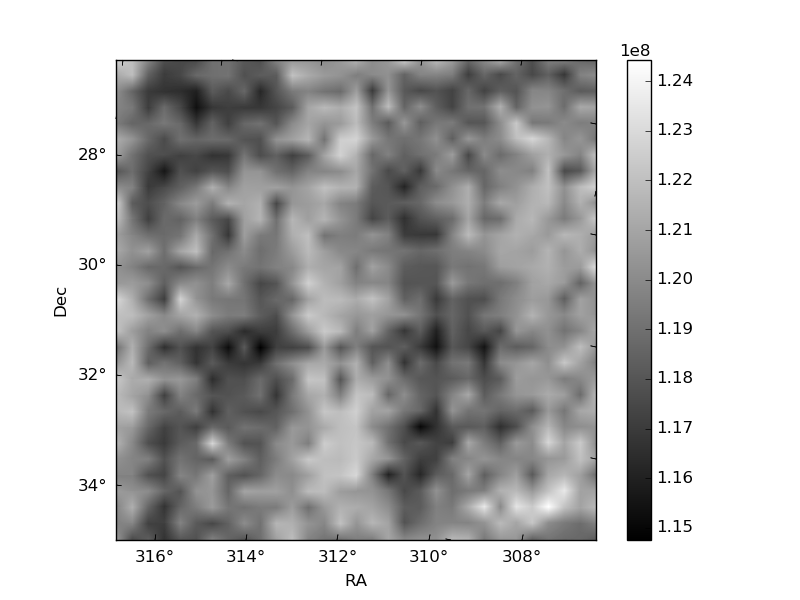
Histogram calculated using DETX and DETY for each event in the final _common_clean file
| Quadrant A | 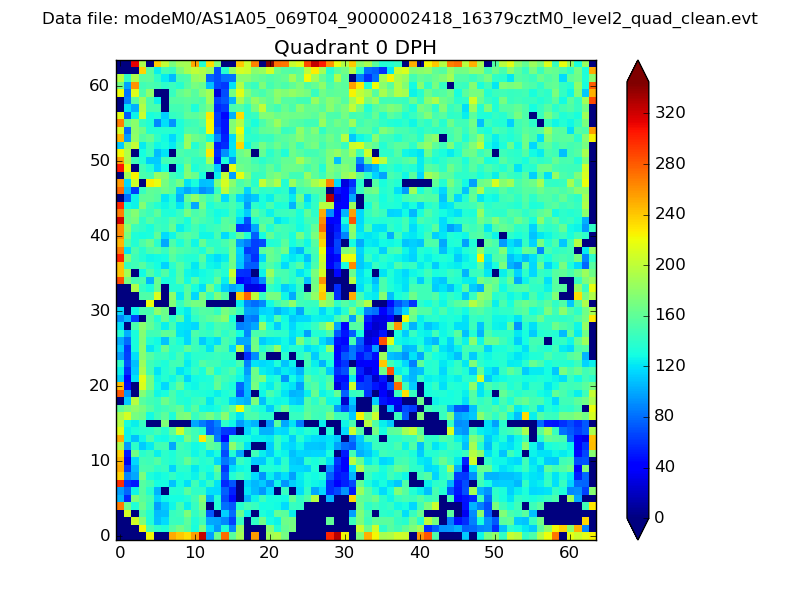 |
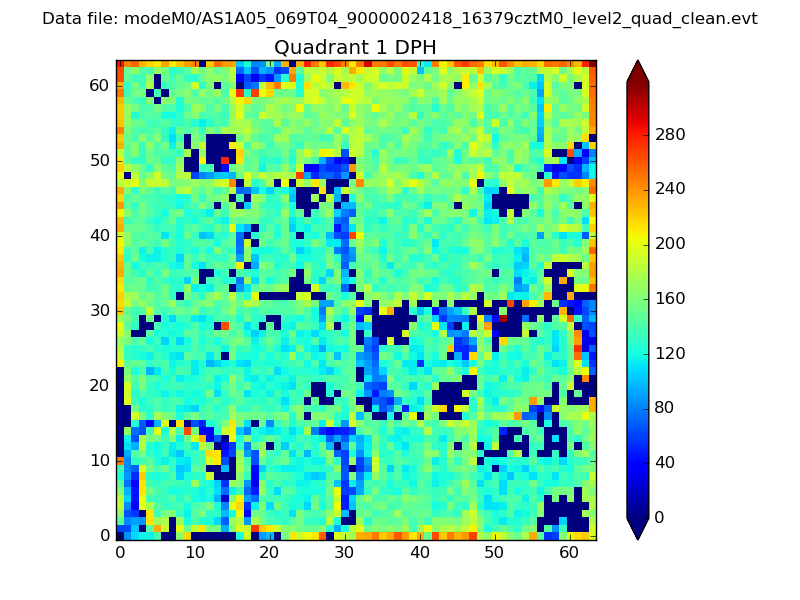 |
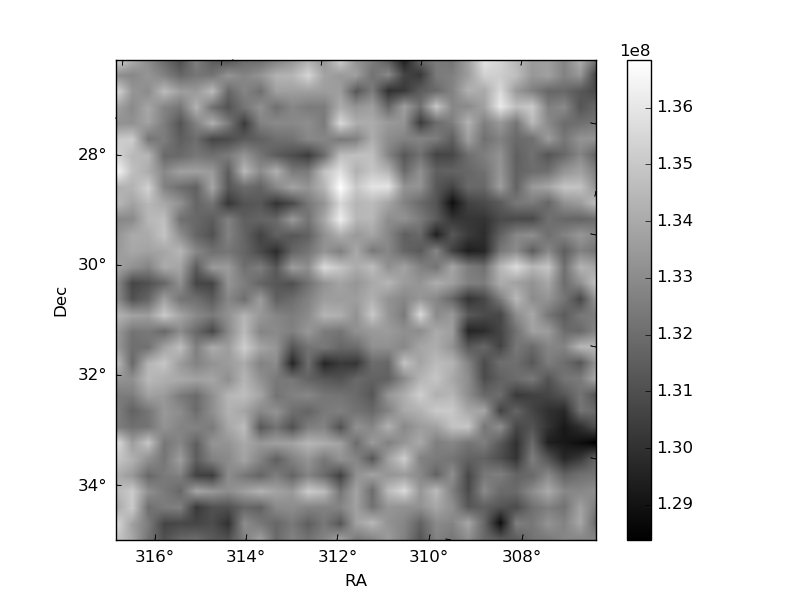
Quadrant B |
|---|---|---|---|
| Quadrant D | 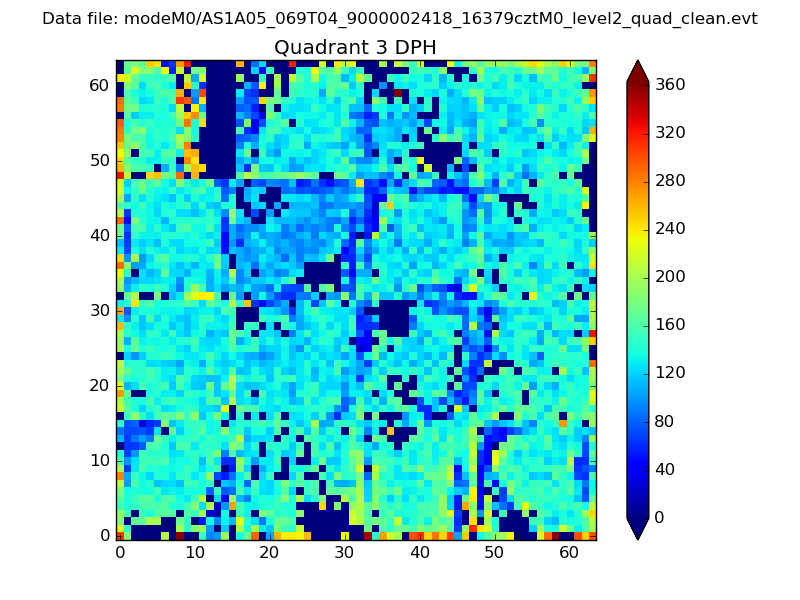 |
 |
Quadrant C |
| Plot type | Count rate plots | Images |
|---|---|---|
| Comparison with Poisson distribution Blue bars denote a histogram of data divided into 1 sec bins. Red curve is a Poisson curve with rate = median count rate of data. |
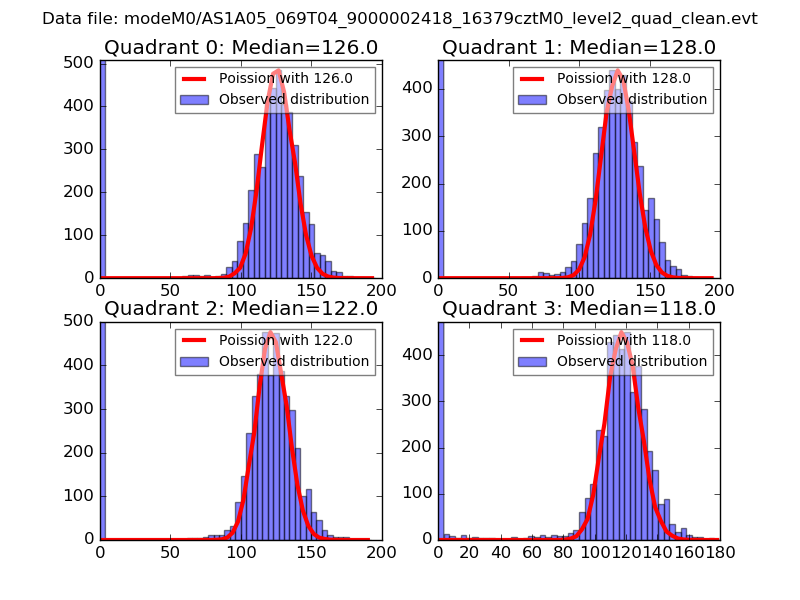 |
 |
| Quadrant-wise count rates Data is divided into 100 sec bins |
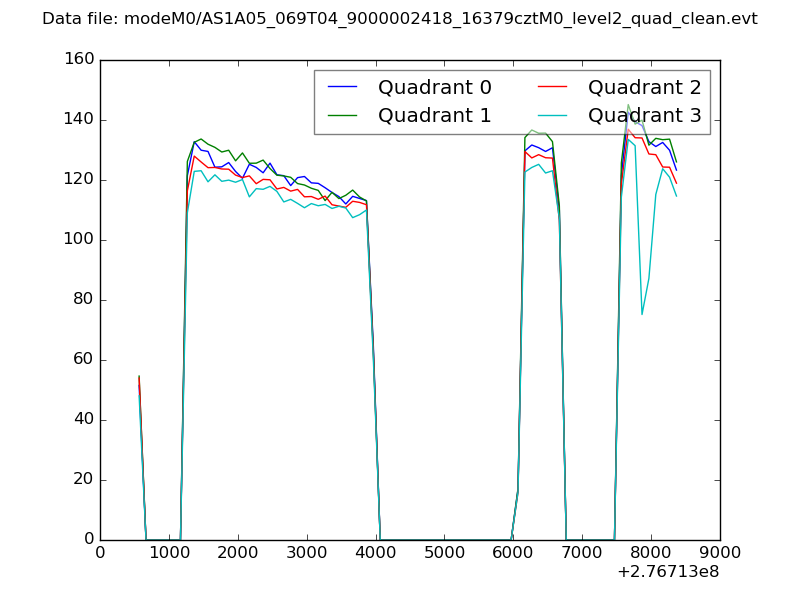 |
|
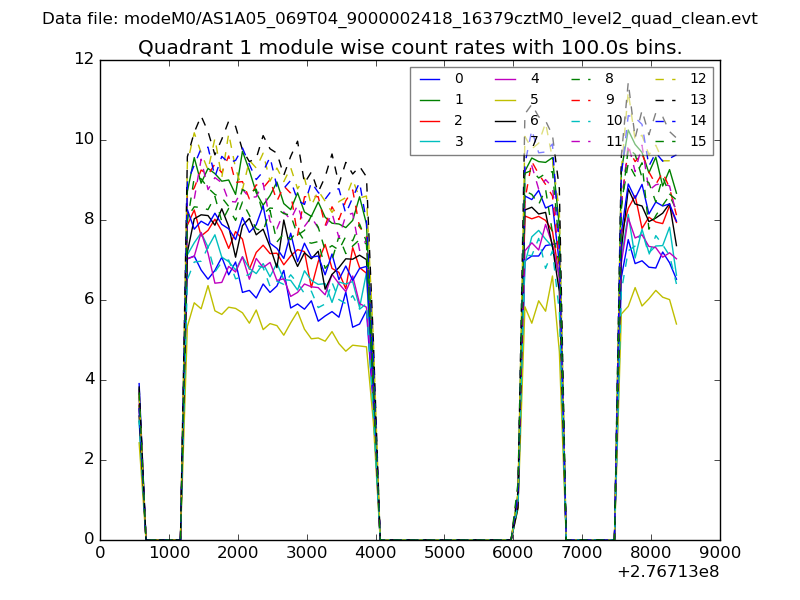
| Module-wise count rates for Quadrant A Data is divided into 100 sec bins |
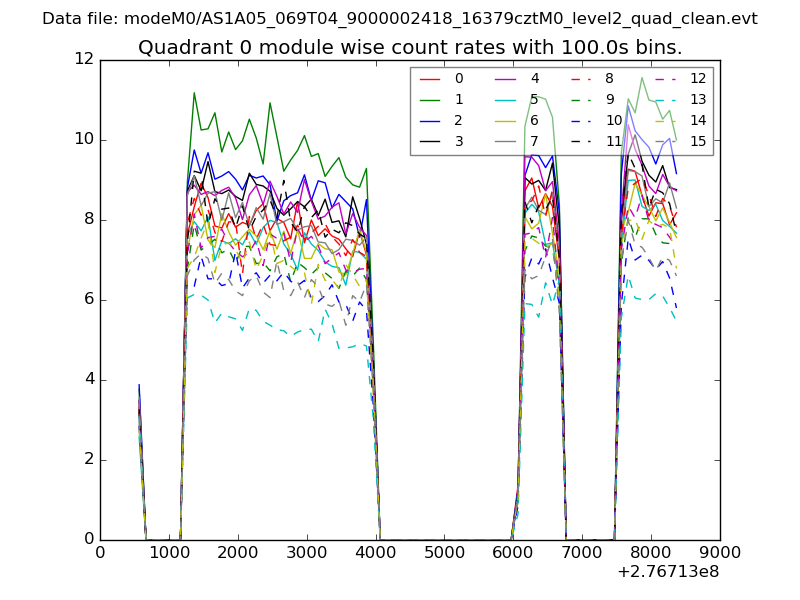 |
 |
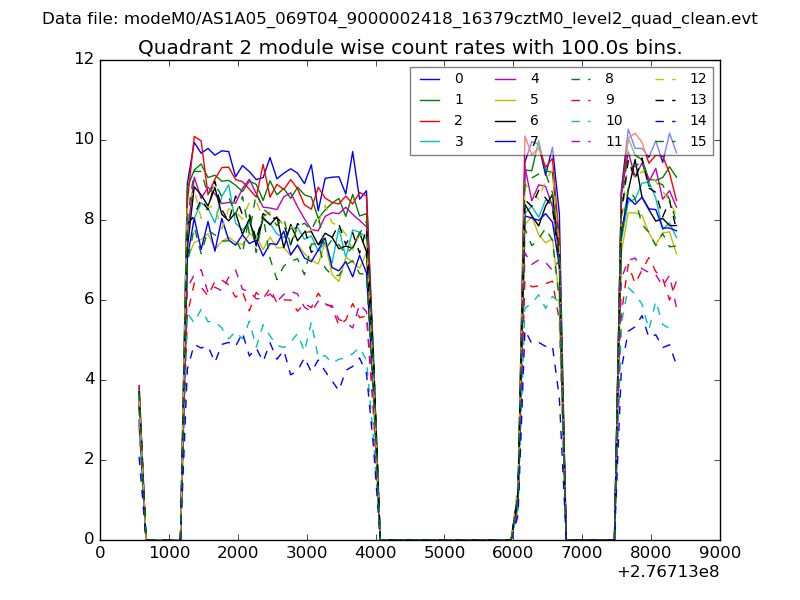
| Module-wise count rates for Quadrant B Data is divided into 100 sec bins |
 |
 |
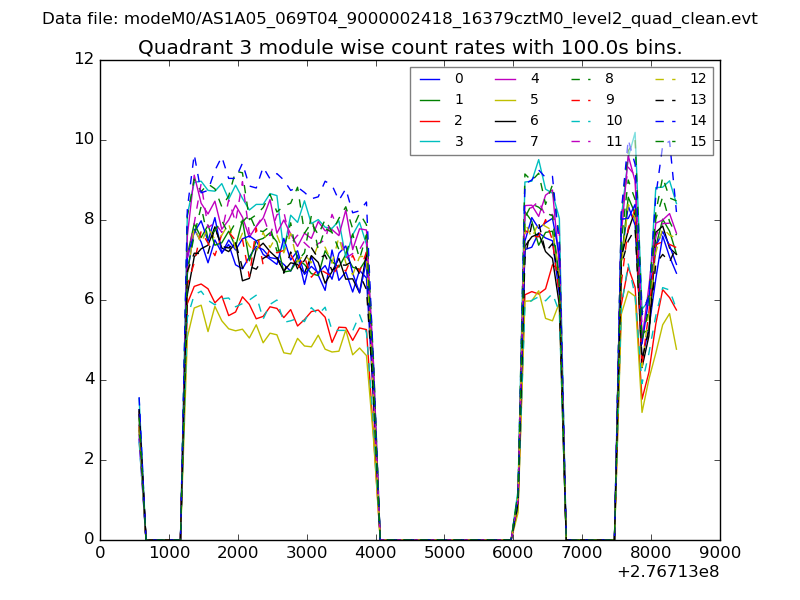
| Module-wise count rates for Quadrant C Data is divided into 100 sec bins |
 |
 |
| Module-wise count rates for Quadrant D Data is divided into 100 sec bins |
 |
 |
| Parameter | Plot |
|---|---|
| CZT HV Monitor | 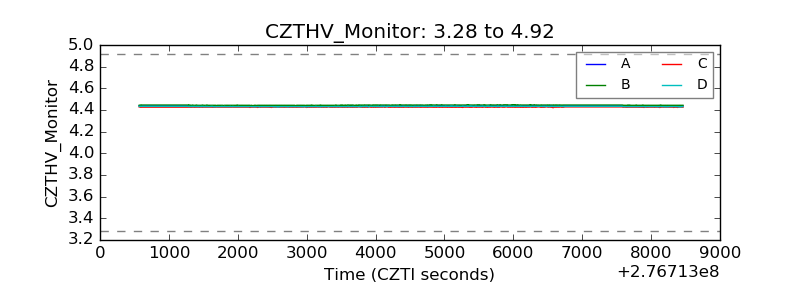 |
| D_VDD | 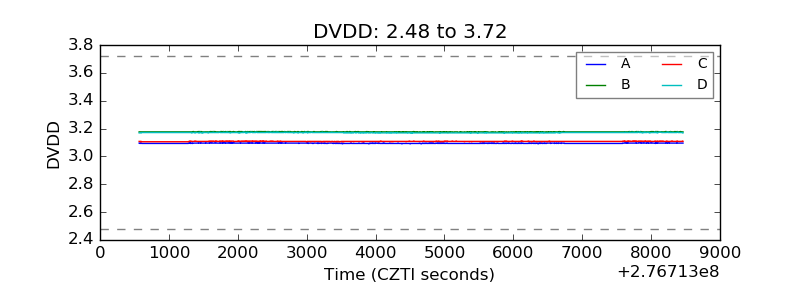 |
| Temperature 1 | 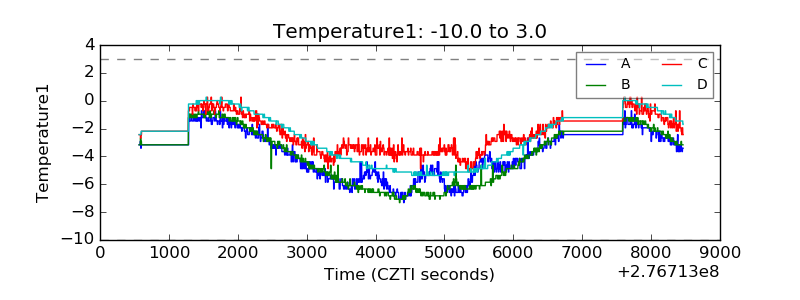 |
| Veto HV Monitor | 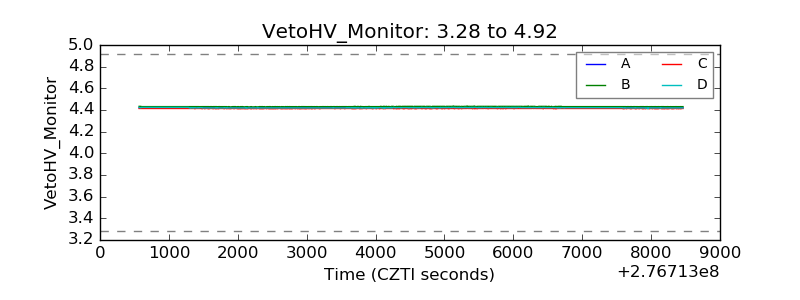 |
| Veto LLD | 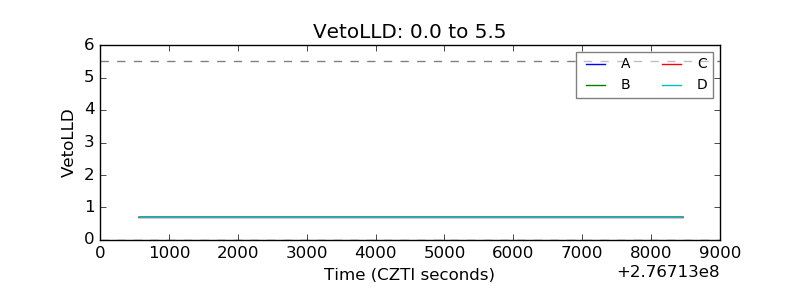 |
| Alpha Counter | 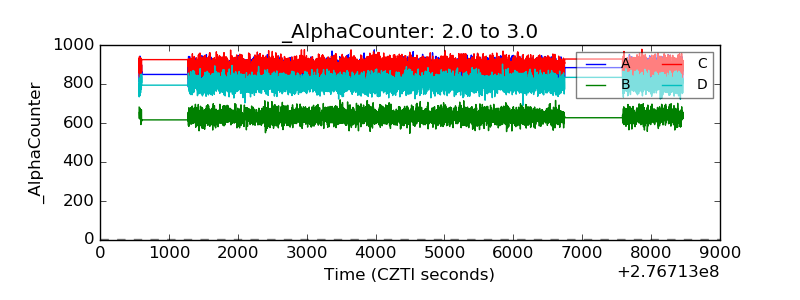 |
| _CPM_Rate | 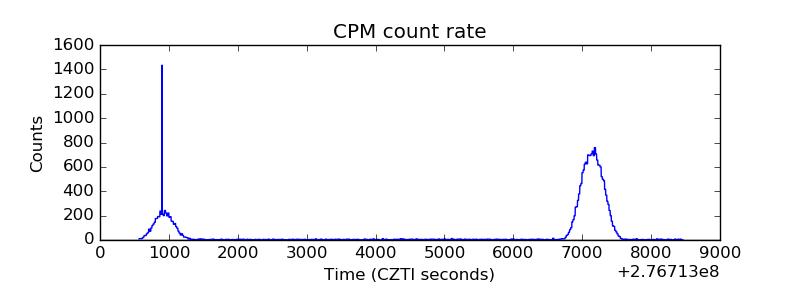 |
| CZT Counter | 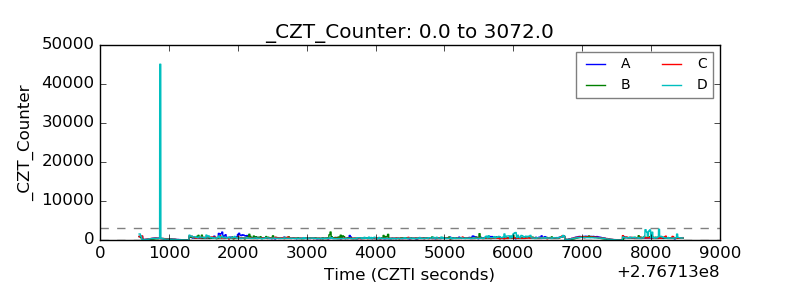 |
| +2.5 Volts monitor |  |
| +5 Volts monitor |  |
| _ROLL_ROT | 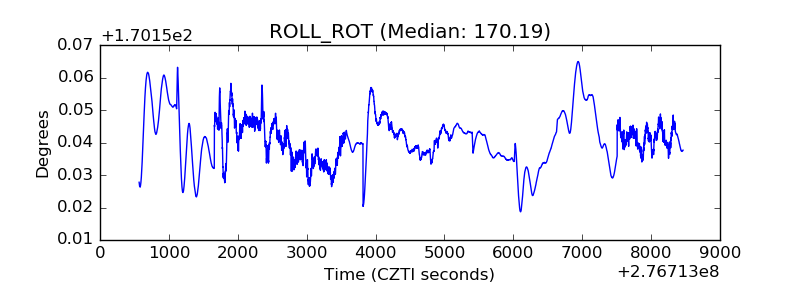 |
| _Roll_DEC | 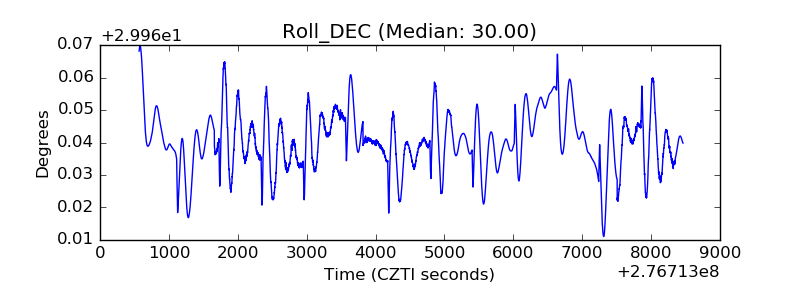 |
| _Roll_RA | 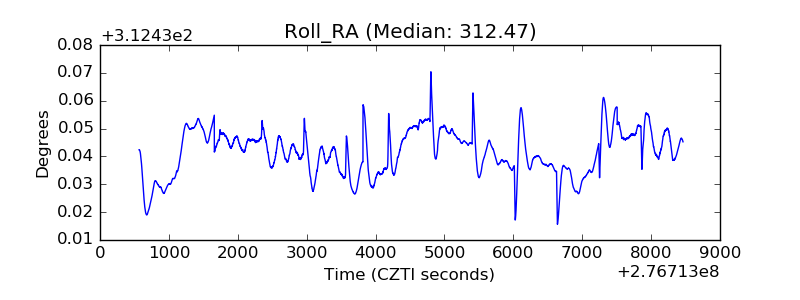 |
| Veto Counter | 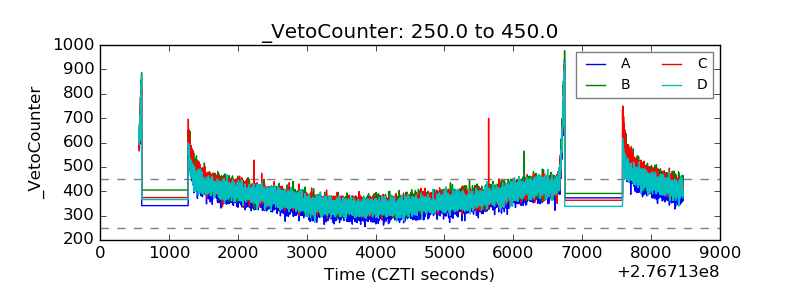 |