| Param | Original file | Final file |
|---|---|---|
| Filename | modeM0/AS1A05_069T04_9000002418_16380cztM0_level2.evt | modeM0/AS1A05_069T04_9000002418_16380cztM0_level2_quad_clean.evt |
| Size (bytes) | 1,272,885,120 | 198,685,440 |
| Size | 1.2 GB | 189.5 MB |
| Events in quadrant A | 10,120,601 | 1,222,830 |
| Events in quadrant B | 9,548,423 | 1,255,130 |
| Events in quadrant C | 8,950,697 | 1,215,866 |
| Events in quadrant D | 8,809,125 | 1,179,329 |
| Mode M0 | |||
|---|---|---|---|
| Quadrant | BADHDUFLAG | Total packets | Discarded packets |
| A | 0 | 41290 | 3 |
| B | 0 | 39094 | 3 |
| C | 0 | 37649 | 3 |
| D | 0 | 37939 | 3 |
| Mode M9 | |||
|---|---|---|---|
| Quadrant | BADHDUFLAG | Total packets | Discarded packets |
| A | 0 | 19 | 0 |
| B | 0 | 19 | 0 |
| C | 0 | 19 | 0 |
| D | 0 | 19 | 0 |
| Mode SS | |||
|---|---|---|---|
| Quadrant | BADHDUFLAG | Total packets | Discarded packets |
| A | 0 | 338 | 0 |
| B | 0 | 338 | 0 |
| C | 0 | 338 | 0 |
| D | 0 | 338 | 0 |
| Quadrant | Total seconds | Saturated seconds | Saturation percentage |
|---|---|---|---|
| A | 16587 | 728 | 4.388979% |
| B | 16587 | 416 | 2.507988% |
| C | 16587 | 479 | 2.887804% |
| D | 16587 | 344 | 2.073913% |
Noise dominated data is calculated using 1-second bins in cleaned event files. If a bin has >2000 counts, and if more than 50% of those come from <1% of pixels, then it is considered to be noise-dominated and hence unusable.
| Quadrant | # 1 sec bins | Bins with >0 counts | Bins with >2000 counts | High rate bins dominated by noise | Noise dominated (total time) | Noise dominated (detector-on time) | Marked lightcurve |
|---|---|---|---|---|---|---|---|
| A | 18563 | 16591 | 583 | 583 | 3.14% | 3.51% | 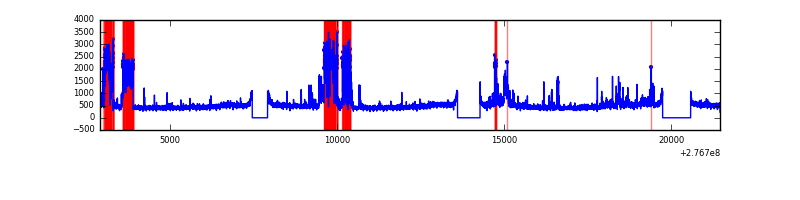 |
| B | 18563 | 16590 | 197 | 197 | 1.06% | 1.19% | 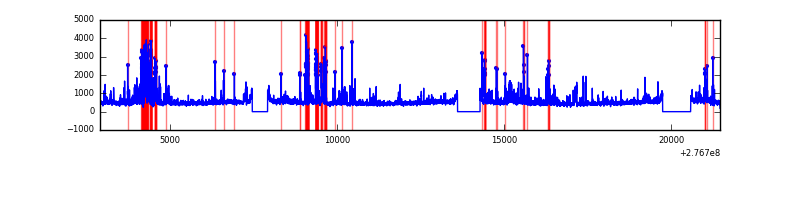 |
| C | 18563 | 16590 | 82 | 82 | 0.44% | 0.49% | 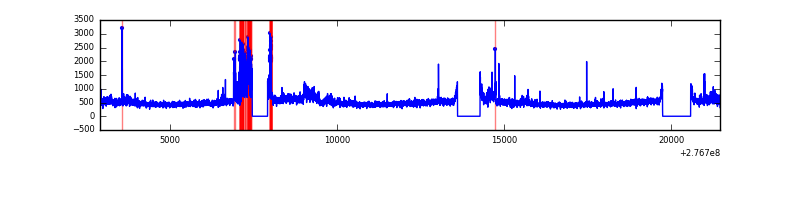 |
| D | 18563 | 16591 | 141 | 141 | 0.76% | 0.85% | 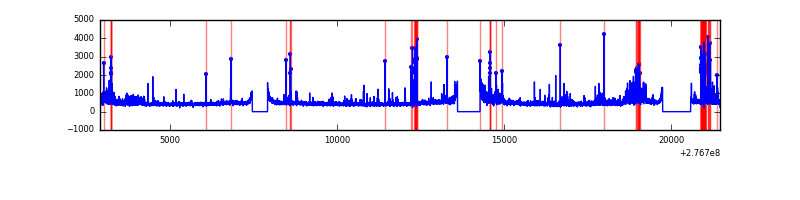 |
Top three noisy pixels from each quadrant. If the there are fewer than three noisy pixels in the level2.evt file, extra rows are filled as -1
| Pixel properties | Quadrant properties | ||||||
|---|---|---|---|---|---|---|---|
| Quadrant | DetID | PixID | Counts | Sigma | Mean | Median | Sigma |
| A | 15 | 174 | 2538451 | 6505.87 | 1935 | 1892 | 389.9 |
| A | 15 | 223 | 86065 | 215.89 | 1935 | 1892 | 389.9 |
| A | 9 | 143 | 33458 | 80.96 | 1935 | 1892 | 389.9 |
| B | 10 | 16 | 974435 | 2625.05 | 1952 | 1902 | 370.5 |
| B | 15 | 35 | 229569 | 614.52 | 1952 | 1902 | 370.5 |
| B | 0 | 189 | 145795 | 388.39 | 1952 | 1902 | 370.5 |
| C | 3 | 233 | 1336728 | 3056.52 | 1874 | 1885 | 436.7 |
| C | 14 | 238 | 285004 | 648.28 | 1874 | 1885 | 436.7 |
| C | 10 | 169 | 22430 | 47.04 | 1874 | 1885 | 436.7 |
| D | 1 | 52 | 663194 | 1425.13 | 1895 | 1839 | 464.1 |
| D | 12 | 218 | 508606 | 1092.02 | 1895 | 1839 | 464.1 |
| D | 12 | 110 | 277447 | 593.9 | 1895 | 1839 | 464.1 |
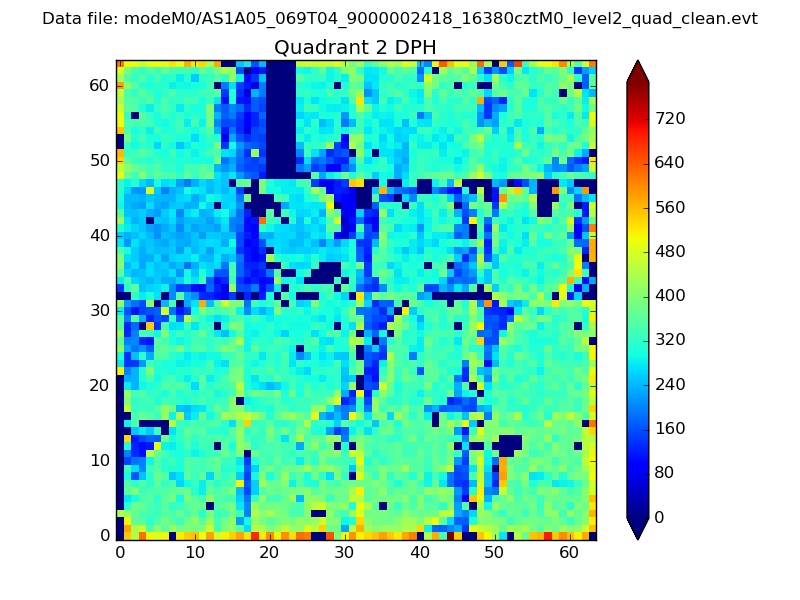
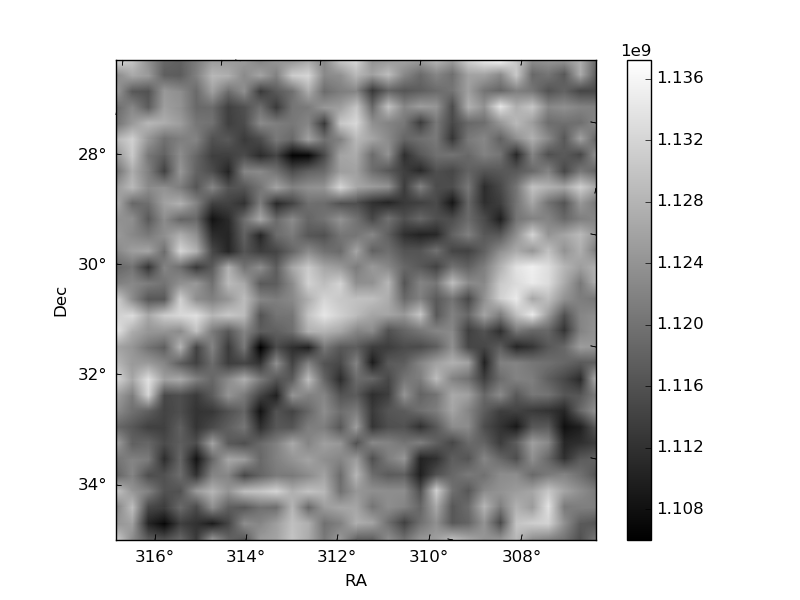
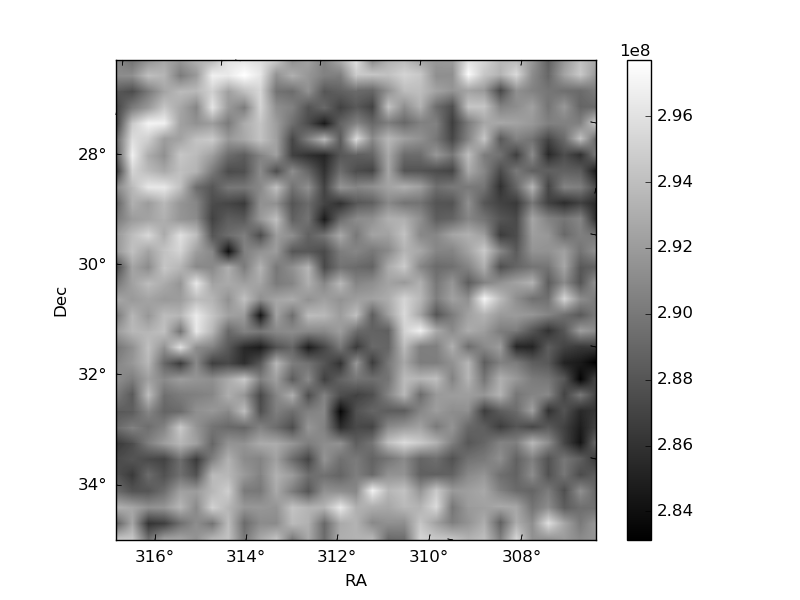
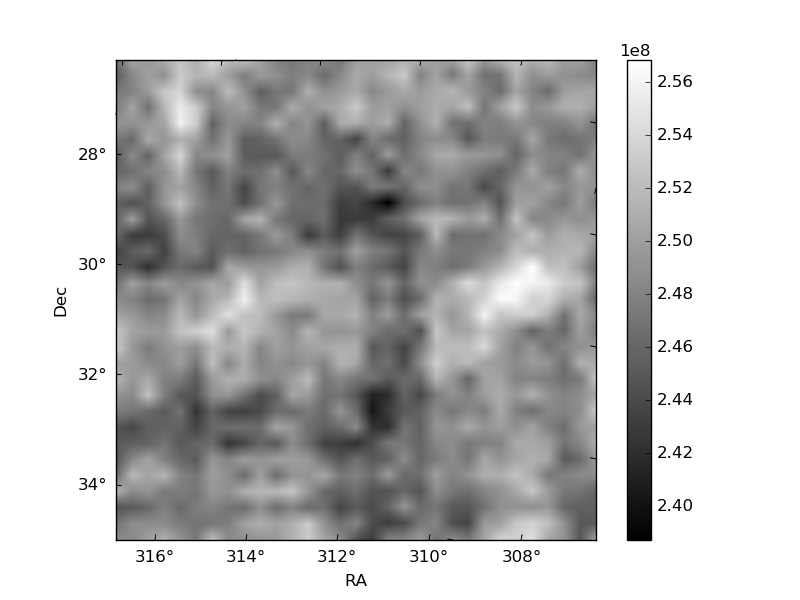
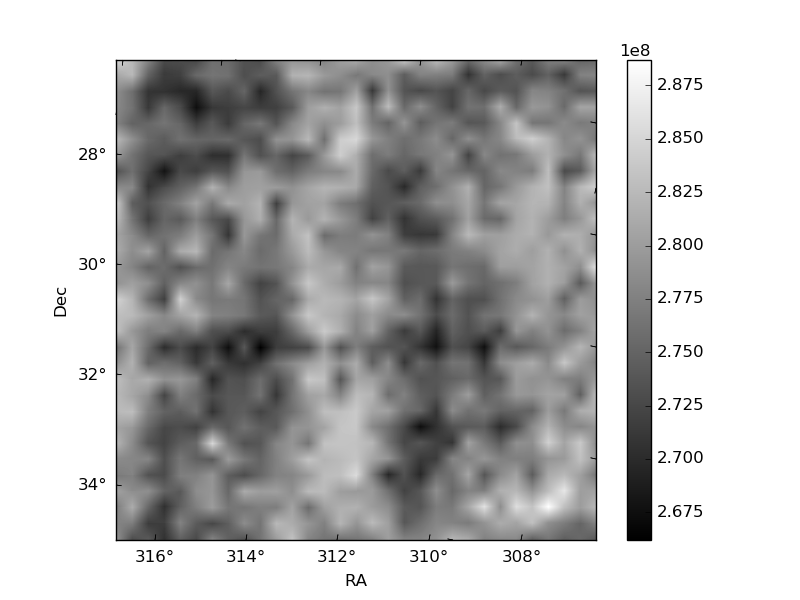
Histogram calculated using DETX and DETY for each event in the final _common_clean file
| Quadrant A | 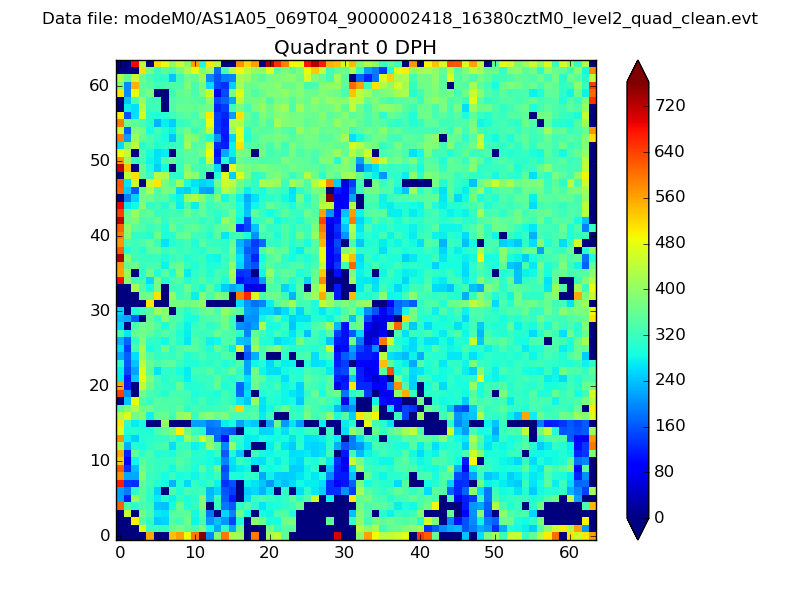 |
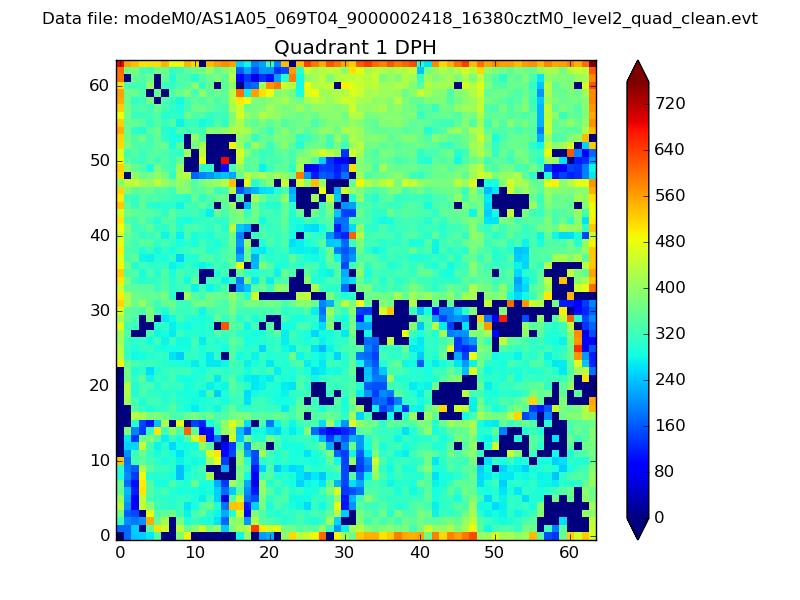 |
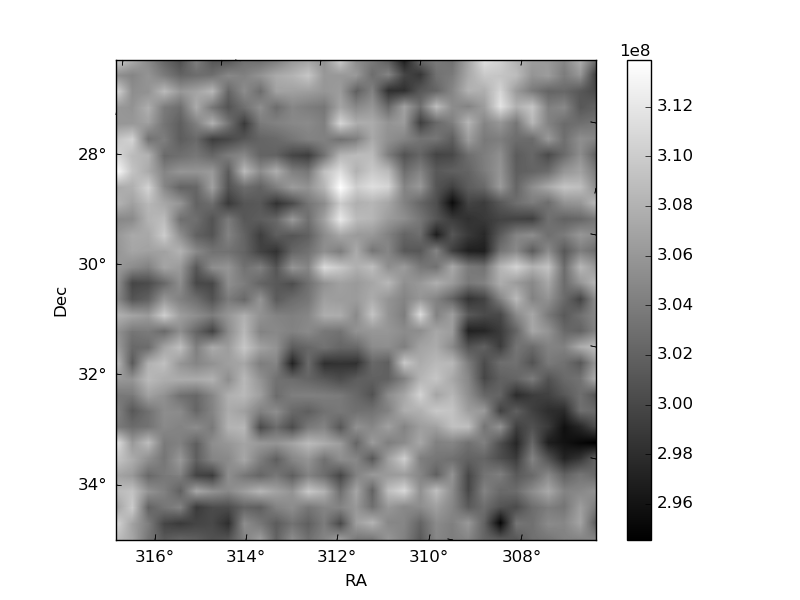
Quadrant B |
|---|---|---|---|
| Quadrant D | 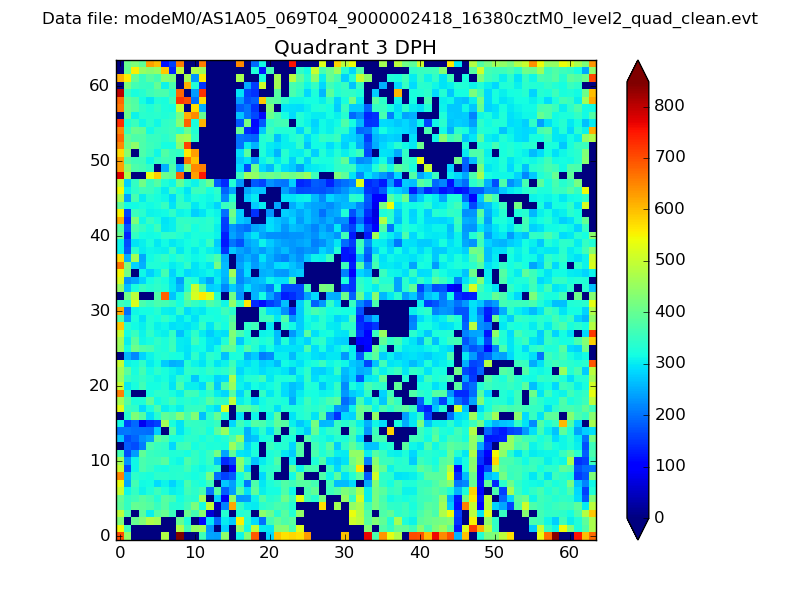 |
 |
Quadrant C |
| Plot type | Count rate plots | Images |
|---|---|---|
| Comparison with Poisson distribution Blue bars denote a histogram of data divided into 1 sec bins. Red curve is a Poisson curve with rate = median count rate of data. |
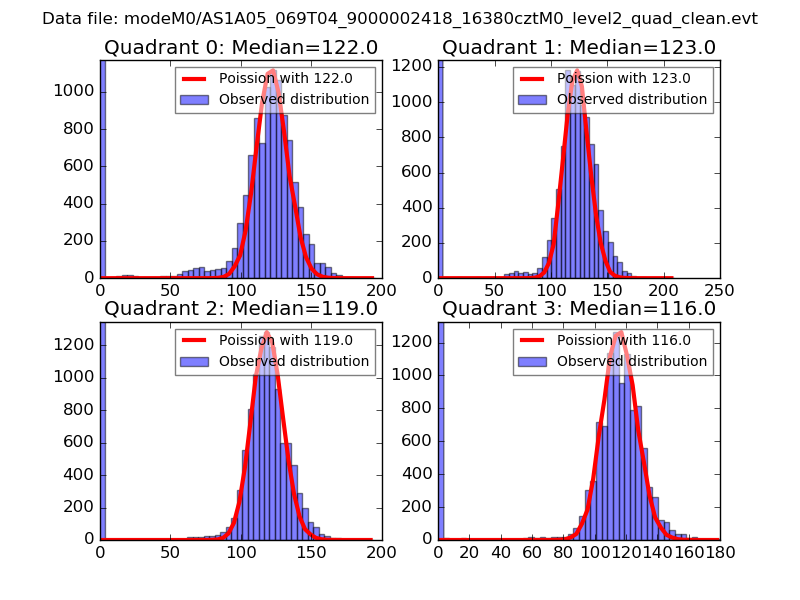 |
 |
| Quadrant-wise count rates Data is divided into 100 sec bins |
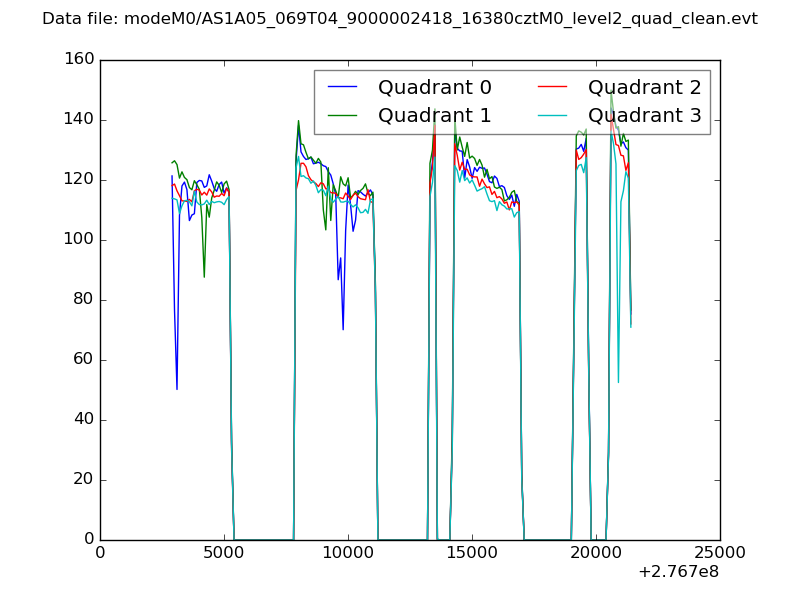 |
|
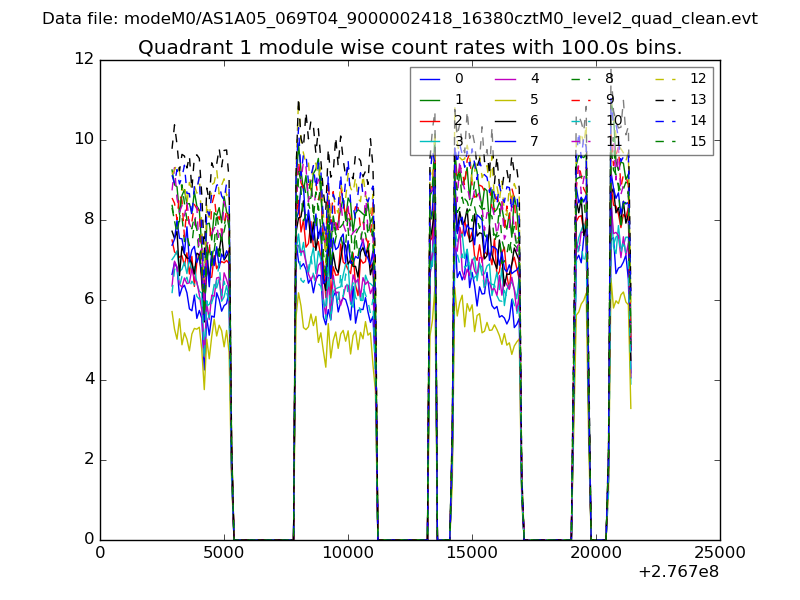
| Module-wise count rates for Quadrant A Data is divided into 100 sec bins |
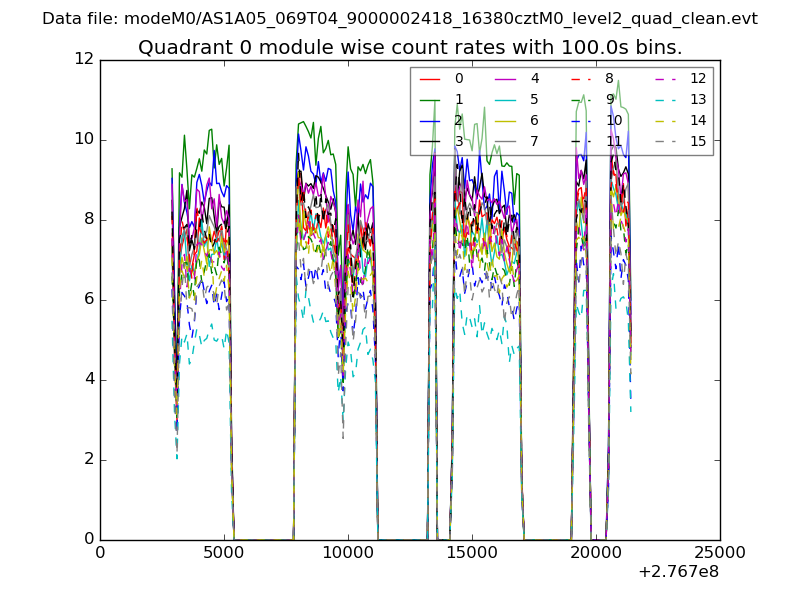 |
 |
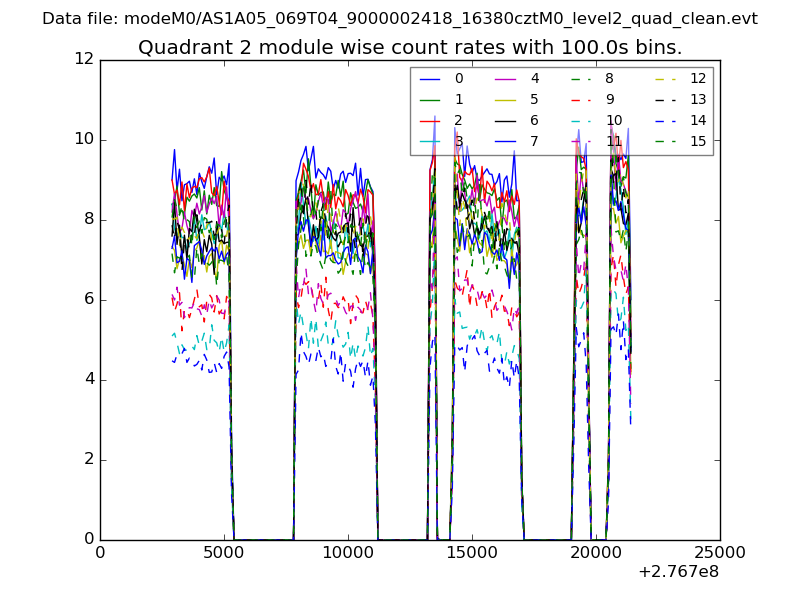
| Module-wise count rates for Quadrant B Data is divided into 100 sec bins |
 |
 |
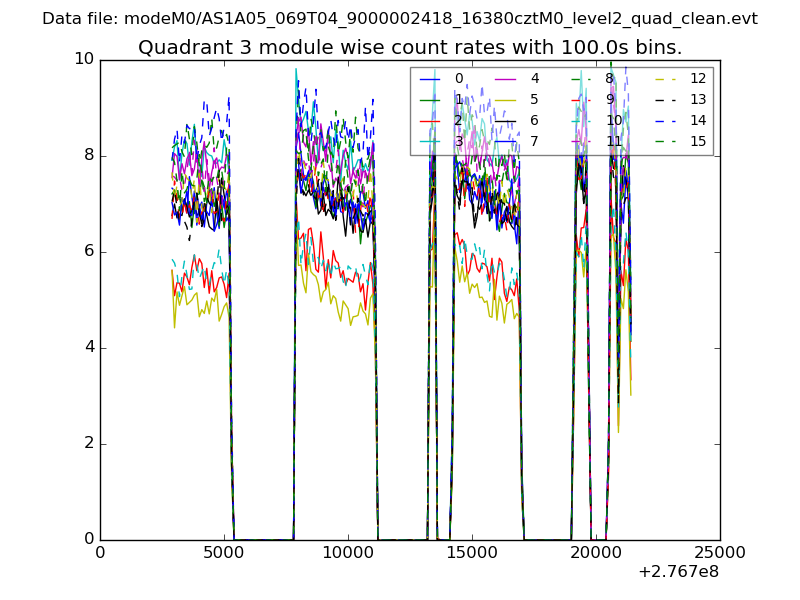
| Module-wise count rates for Quadrant C Data is divided into 100 sec bins |
 |
 |
| Module-wise count rates for Quadrant D Data is divided into 100 sec bins |
 |
 |
| Parameter | Plot |
|---|---|
| CZT HV Monitor |  |
| D_VDD | 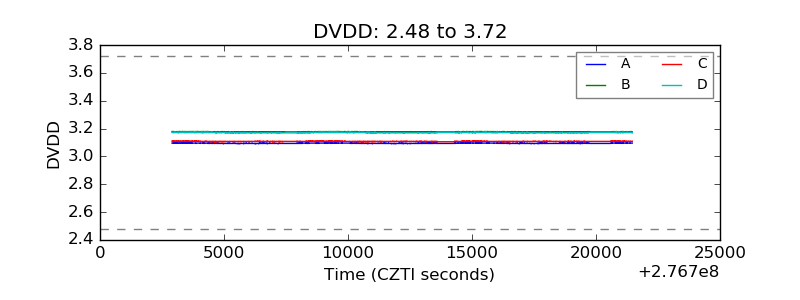 |
| Temperature 1 | 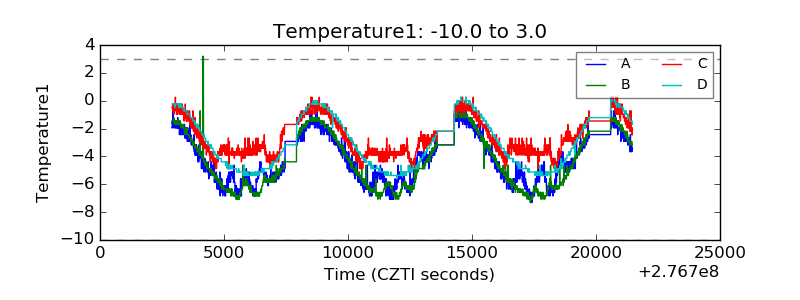 |
| Veto HV Monitor | 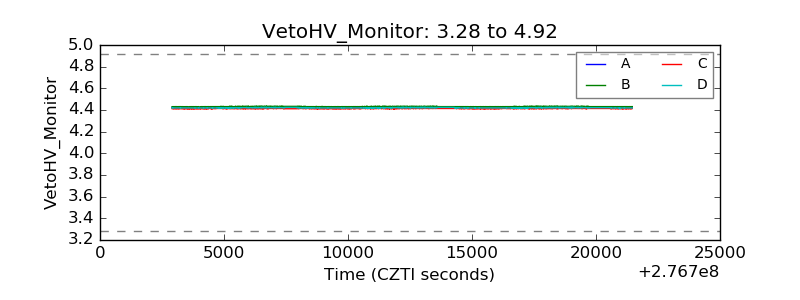 |
| Veto LLD |  |
| Alpha Counter | 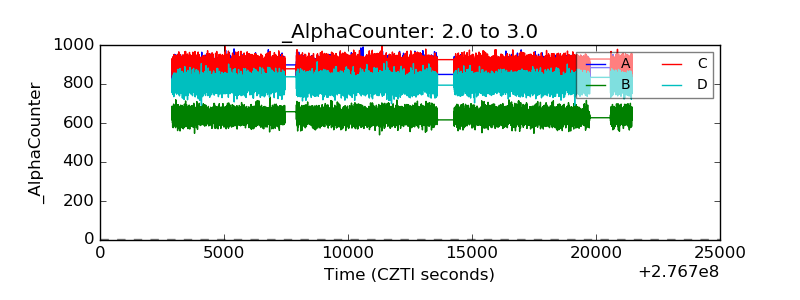 |
| _CPM_Rate | 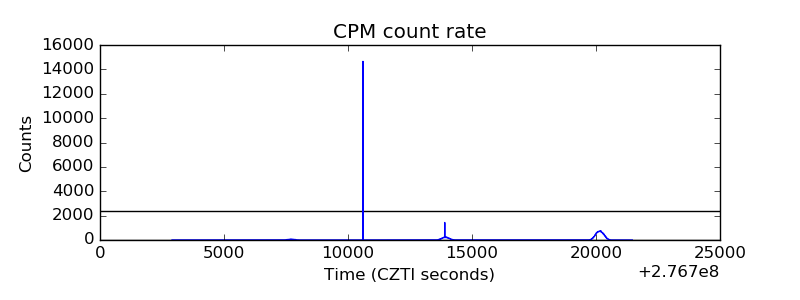 |
| CZT Counter | 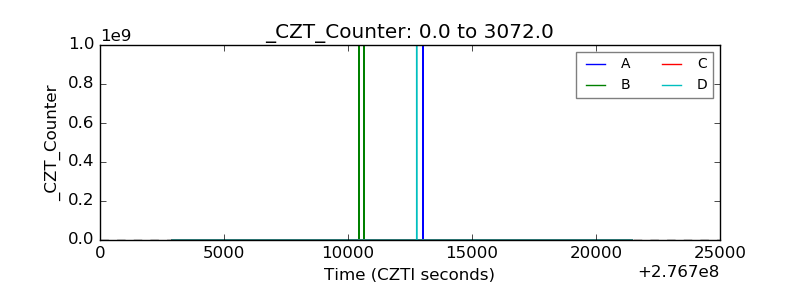 |
| +2.5 Volts monitor |  |
| +5 Volts monitor |  |
| _ROLL_ROT |  |
| _Roll_DEC |  |
| _Roll_RA | 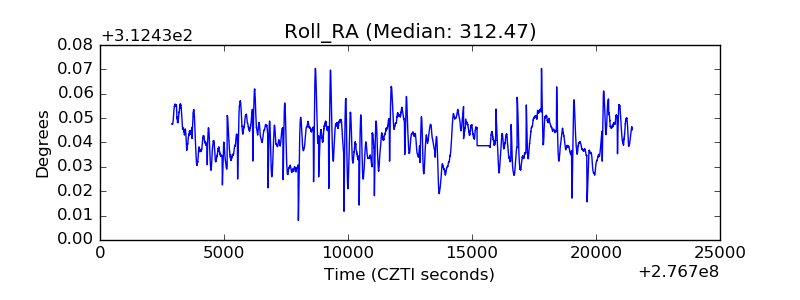 |
| Veto Counter | 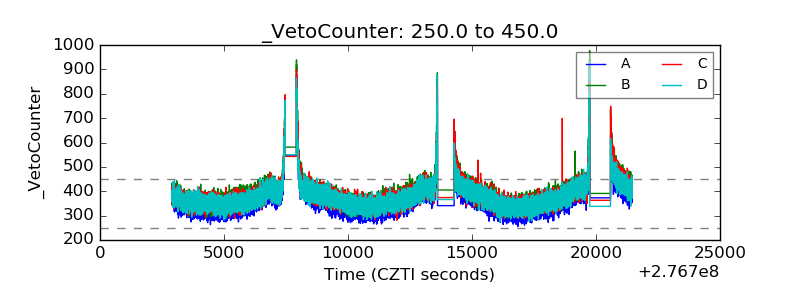 |