| Param | Original file | Final file |
|---|---|---|
| Filename | modeM0/AS1A05_069T05_9000002420cztM0_level2.fits | modeM0/AS1A05_069T05_9000002420cztM0_level2_quad_clean.evt |
| Size (bytes) | 640,198,080 | 590,014,080 |
| Size | 610.5 MB | 562.7 MB |
| Events in quadrant A | 3,941,740 | 3,495,078 |
| Events in quadrant B | 3,791,598 | 3,517,636 |
| Events in quadrant C | 3,821,044 | 3,312,119 |
| Events in quadrant D | 3,300,634 | 3,010,486 |
| Mode M9 | |||
|---|---|---|---|
| Quadrant | BADHDUFLAG | Total packets | Discarded packets |
| A | 0 | 103 | 0 |
| B | 0 | 103 | 0 |
| C | 0 | 103 | 0 |
| D | 0 | 103 | 0 |
| Mode SS | |||
|---|---|---|---|
| Quadrant | BADHDUFLAG | Total packets | Discarded packets |
| A | 0 | 1348 | 0 |
| B | 0 | 1348 | 0 |
| C | 0 | 1348 | 0 |
| D | 0 | 1348 | 0 |
| Mode M0 | |||
|---|---|---|---|
| Quadrant | BADHDUFLAG | Total packets | Discarded packets |
| A | 0 | 141908 | 0 |
| B | 0 | 152220 | 0 |
| C | 0 | 138371 | 0 |
| D | 0 | 155866 | 0 |
| Quadrant | Total seconds | Saturated seconds | Saturation percentage |
|---|---|---|---|
| A | 66095 | 1112 | 1.682427% |
| B | 66095 | 1438 | 2.175656% |
| C | 66095 | 997 | 1.508435% |
| D | 66095 | 1582 | 2.393524% |
Noise dominated data is calculated using 1-second bins in cleaned event files. If a bin has >2000 counts, and if more than 50% of those come from <1% of pixels, then it is considered to be noise-dominated and hence unusable.
| Quadrant | # 1 sec bins | Bins with >0 counts | Bins with >2000 counts | High rate bins dominated by noise | Noise dominated (total time) | Noise dominated (detector-on time) | Marked lightcurve |
|---|---|---|---|---|---|---|---|
| A | 76435 | 66090 | 0 | 0 | 0.00% | 0.00% |  |
| B | 76435 | 66091 | 0 | 0 | 0.00% | 0.00% |  |
| C | 76435 | 66094 | 0 | 0 | 0.00% | 0.00% |  |
| D | 76435 | 66089 | 0 | 0 | 0.00% | 0.00% |  |
Top three noisy pixels from each quadrant. If the there are fewer than three noisy pixels in the level2.evt file, extra rows are filled as -1
| Pixel properties | Quadrant properties | ||||||
|---|---|---|---|---|---|---|---|
| Quadrant | DetID | PixID | Counts | Sigma | Mean | Median | Sigma |
| A | 0 | 29 | 3663 | 10.64 | 1024 | 961 | 253.9 |
| A | 7 | 110 | 3224 | 8.91 | 1024 | 961 | 253.9 |
| A | 15 | 236 | 2948 | 7.83 | 1024 | 961 | 253.9 |
| B | 2 | 9 | 3034 | 10.59 | 1001 | 956 | 196.2 |
| B | 2 | 8 | 2596 | 8.36 | 1001 | 956 | 196.2 |
| B | 5 | 128 | 2524 | 7.99 | 1001 | 956 | 196.2 |
| C | 1 | 80 | 2960 | 7.79 | 1008 | 939 | 259.4 |
| C | 1 | 81 | 2925 | 7.66 | 1008 | 939 | 259.4 |
| C | 12 | 241 | 2565 | 6.27 | 1008 | 939 | 259.4 |
| D | 3 | 14 | 2457 | 6.32 | 942 | 854 | 253.6 |
| D | 6 | 231 | 2390 | 6.06 | 942 | 854 | 253.6 |
| D | 10 | 189 | 2368 | 5.97 | 942 | 854 | 253.6 |
Histogram calculated using DETX and DETY for each event in the final _common_clean file
| Quadrant A |  |
 |
Quadrant B |
|---|---|---|---|
| Quadrant D |  |
 |
Quadrant C |
| Plot type | Count rate plots | Images |
|---|---|---|
| Comparison with Poisson distribution Blue bars denote a histogram of data divided into 1 sec bins. Red curve is a Poisson curve with rate = median count rate of data. |
 |
 |
| Quadrant-wise count rates Data is divided into 100 sec bins |
 |
|
| Module-wise count rates for Quadrant A Data is divided into 100 sec bins |
 |
 |
| Module-wise count rates for Quadrant B Data is divided into 100 sec bins |
 |
 |
| Module-wise count rates for Quadrant C Data is divided into 100 sec bins |
 |
 |
| Module-wise count rates for Quadrant D Data is divided into 100 sec bins |
 |
 |
| Parameter | Plot |
|---|---|
| CZT HV Monitor |  |
| D_VDD | 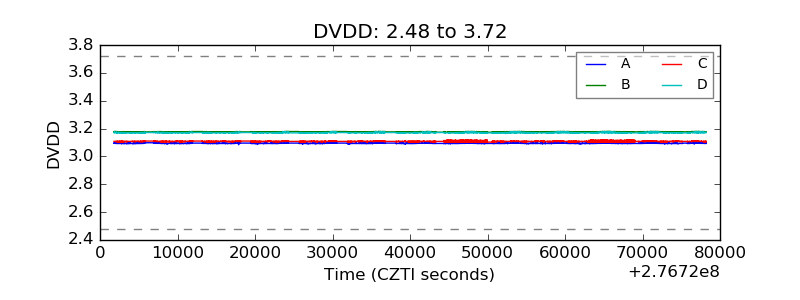 |
| Temperature 1 |  |
| Veto HV Monitor |  |
| Veto LLD |  |
| Alpha Counter |  |
| _CPM_Rate |  |
| CZT Counter |  |
| +2.5 Volts monitor |  |
| +5 Volts monitor |  |
| _ROLL_ROT |  |
| _Roll_DEC |  |
| _Roll_RA |  |
| Veto Counter |  |