| Param | Original file | Final file |
|---|---|---|
| Filename | modeM0/AS1A05_069T05_9000002420_16380cztM0_level2.evt | modeM0/AS1A05_069T05_9000002420_16380cztM0_level2_quad_clean.evt |
| Size (bytes) | 396,100,800 | 68,745,600 |
| Size | 377.8 MB | 65.6 MB |
| Events in quadrant A | 2,778,278 | 427,946 |
| Events in quadrant B | 3,050,430 | 439,463 |
| Events in quadrant C | 2,641,046 | 422,653 |
| Events in quadrant D | 3,154,291 | 408,713 |
| Mode M9 | |||
|---|---|---|---|
| Quadrant | BADHDUFLAG | Total packets | Discarded packets |
| A | 0 | 11 | 0 |
| B | 0 | 11 | 0 |
| C | 0 | 11 | 0 |
| D | 0 | 11 | 0 |
| Mode SS | |||
|---|---|---|---|
| Quadrant | BADHDUFLAG | Total packets | Discarded packets |
| A | 0 | 110 | 0 |
| B | 0 | 110 | 0 |
| C | 0 | 110 | 0 |
| D | 0 | 110 | 0 |
| Mode M0 | |||
|---|---|---|---|
| Quadrant | BADHDUFLAG | Total packets | Discarded packets |
| A | 0 | 11901 | 2 |
| B | 0 | 12611 | 1 |
| C | 0 | 11305 | 1 |
| D | 0 | 13031 | 1 |
| Quadrant | Total seconds | Saturated seconds | Saturation percentage |
|---|---|---|---|
| A | 5474 | 110 | 2.009499% |
| B | 5474 | 87 | 1.589331% |
| C | 5474 | 37 | 0.675923% |
| D | 5474 | 80 | 1.461454% |
Noise dominated data is calculated using 1-second bins in cleaned event files. If a bin has >2000 counts, and if more than 50% of those come from <1% of pixels, then it is considered to be noise-dominated and hence unusable.
| Quadrant | # 1 sec bins | Bins with >0 counts | Bins with >2000 counts | High rate bins dominated by noise | Noise dominated (total time) | Noise dominated (detector-on time) | Marked lightcurve |
|---|---|---|---|---|---|---|---|
| A | 6500 | 5476 | 87 | 87 | 1.34% | 1.59% | 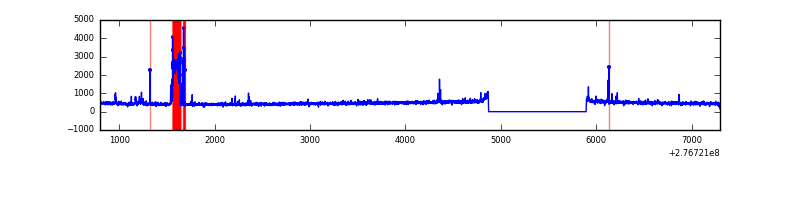 |
| B | 6500 | 5476 | 51 | 51 | 0.78% | 0.93% | 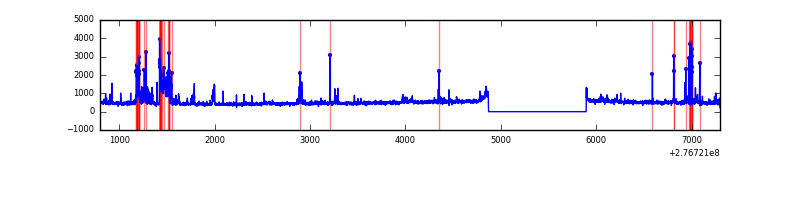 |
| C | 6500 | 5476 | 0 | 0 | 0.00% | 0.00% | 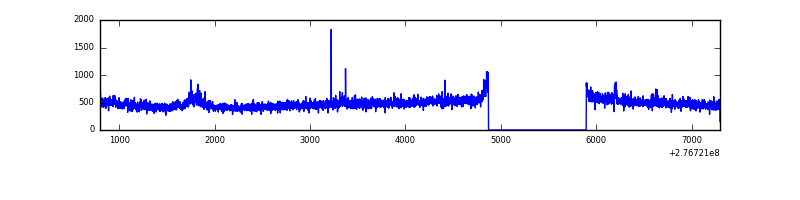 |
| D | 6500 | 5476 | 74 | 74 | 1.14% | 1.35% | 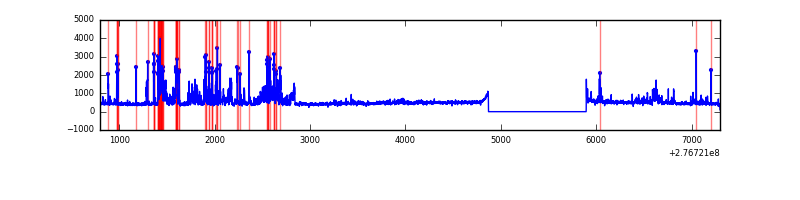 |
Top three noisy pixels from each quadrant. If the there are fewer than three noisy pixels in the level2.evt file, extra rows are filled as -1
| Pixel properties | Quadrant properties | ||||||
|---|---|---|---|---|---|---|---|
| Quadrant | DetID | PixID | Counts | Sigma | Mean | Median | Sigma |
| A | 15 | 174 | 269037 | 2077.99 | 634 | 618 | 129.2 |
| A | 9 | 143 | 32697 | 248.34 | 634 | 618 | 129.2 |
| A | 15 | 223 | 28911 | 219.03 | 634 | 618 | 129.2 |
| B | 10 | 16 | 228808 | 1850.06 | 643 | 628 | 123.3 |
| B | 15 | 35 | 146514 | 1182.83 | 643 | 628 | 123.3 |
| B | 0 | 189 | 64755 | 519.93 | 643 | 628 | 123.3 |
| C | 3 | 233 | 122742 | 842.74 | 619 | 624 | 144.9 |
| C | 14 | 238 | 95974 | 658.01 | 619 | 624 | 144.9 |
| C | 10 | 169 | 7153 | 45.06 | 619 | 624 | 144.9 |
| D | 2 | 122 | 427250 | 2776.7 | 622 | 604 | 153.7 |
| D | 12 | 218 | 281501 | 1828.14 | 622 | 604 | 153.7 |
| D | 12 | 110 | 37868 | 242.52 | 622 | 604 | 153.7 |
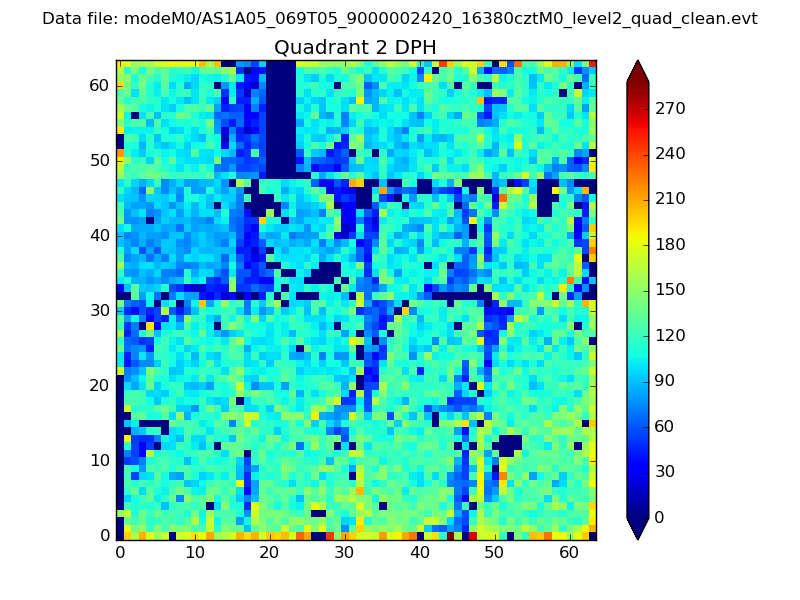
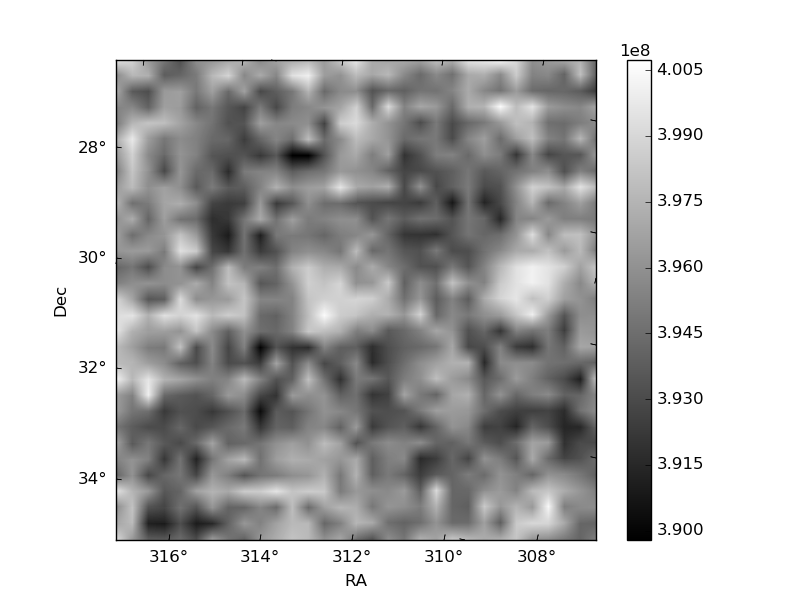
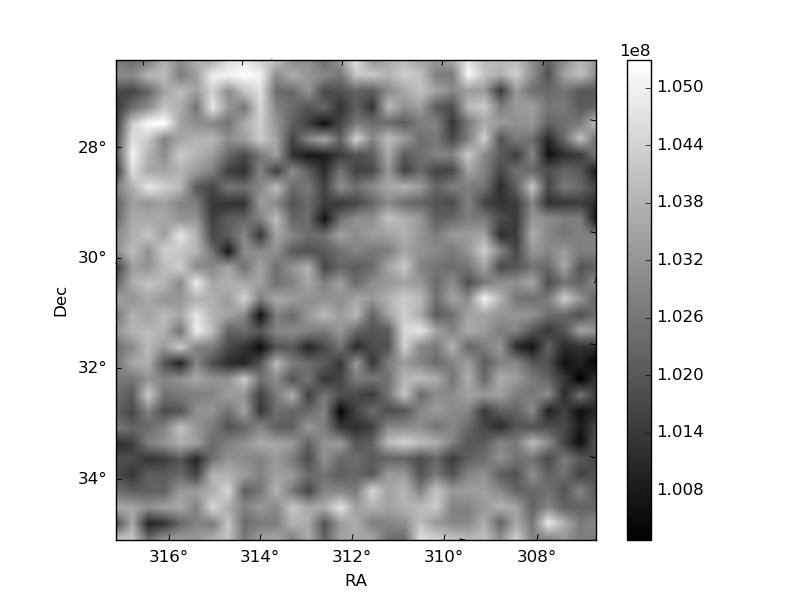
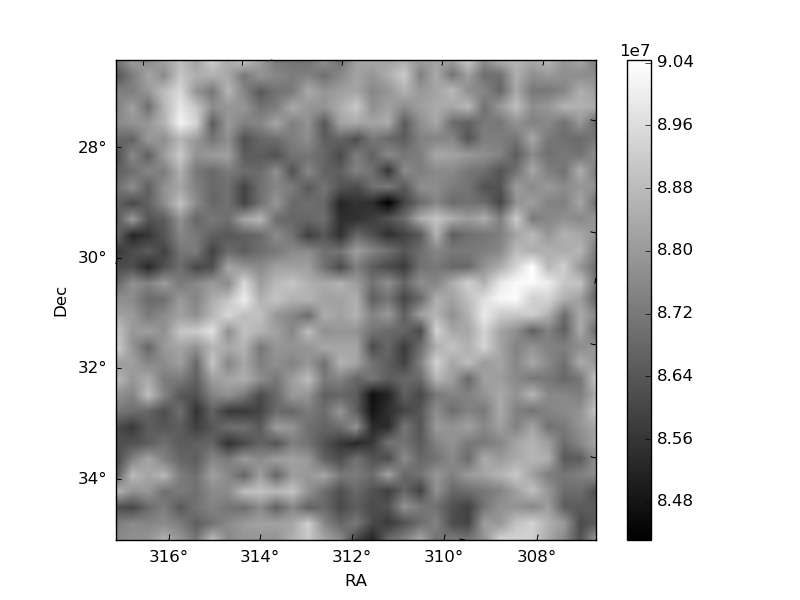
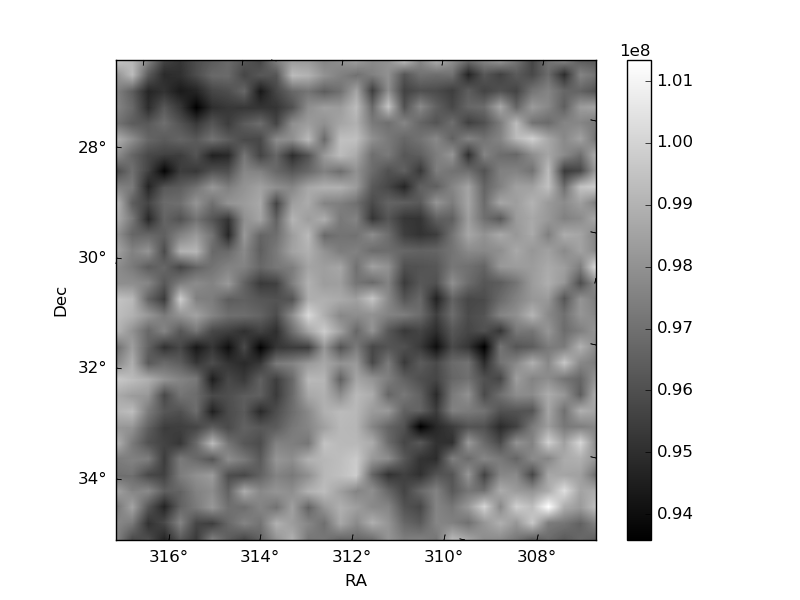
Histogram calculated using DETX and DETY for each event in the final _common_clean file
| Quadrant A | 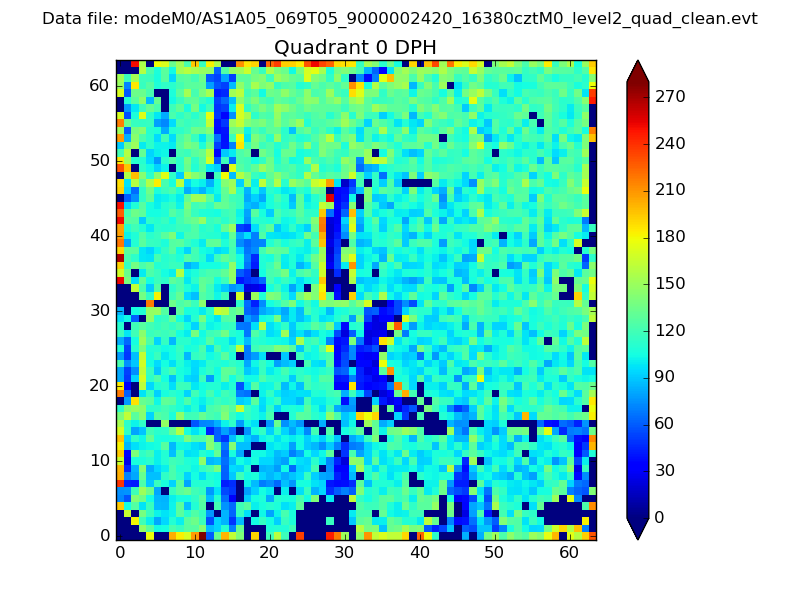 |
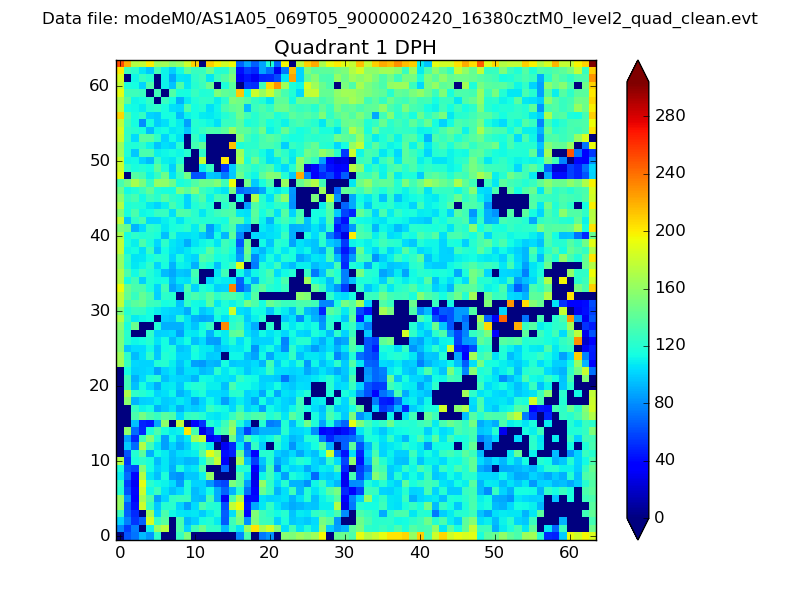 |
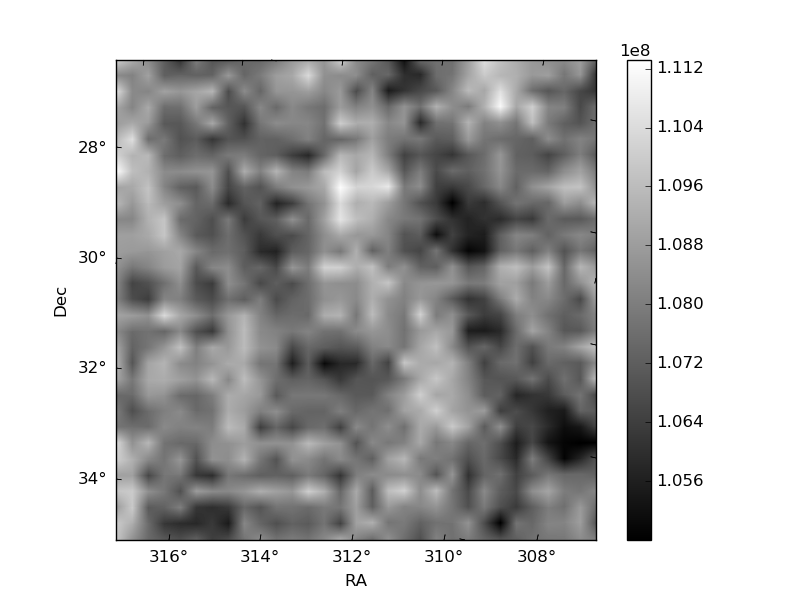
Quadrant B |
|---|---|---|---|
| Quadrant D | 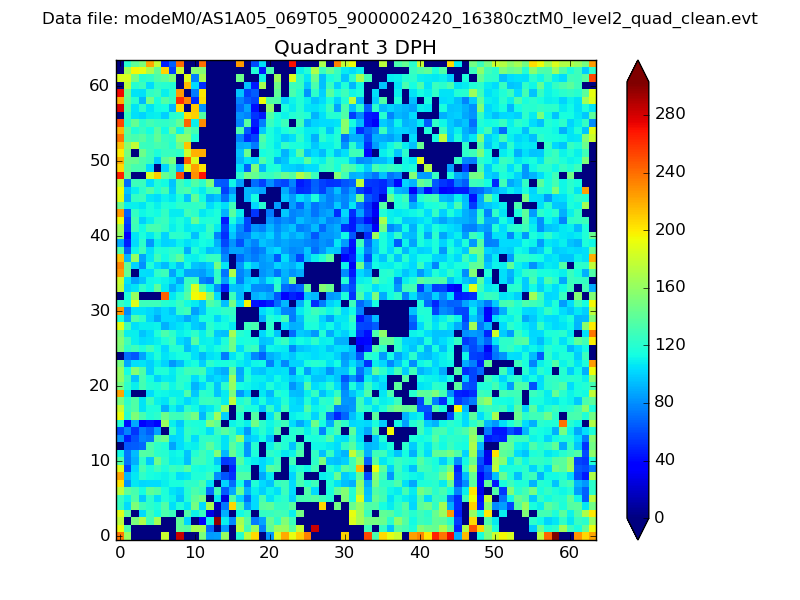 |
 |
Quadrant C |
| Plot type | Count rate plots | Images |
|---|---|---|
| Comparison with Poisson distribution Blue bars denote a histogram of data divided into 1 sec bins. Red curve is a Poisson curve with rate = median count rate of data. |
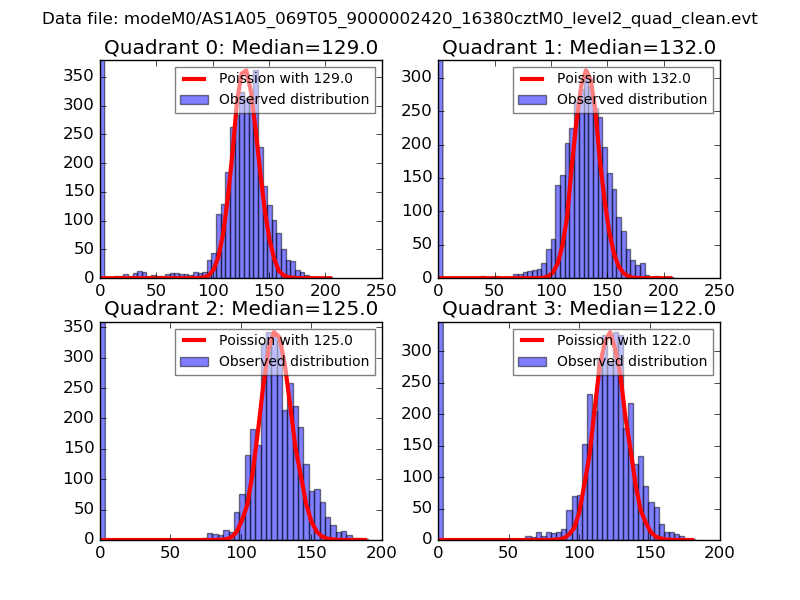 |
 |
| Quadrant-wise count rates Data is divided into 100 sec bins |
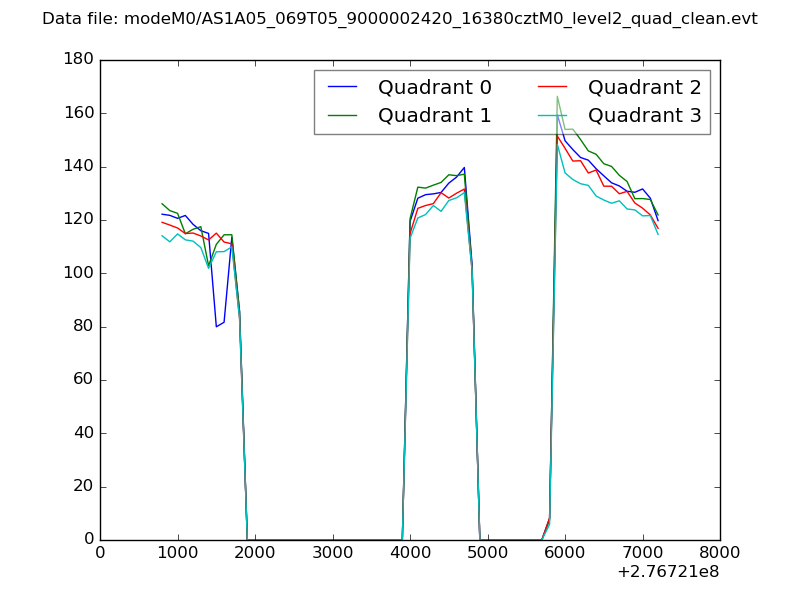 |
|
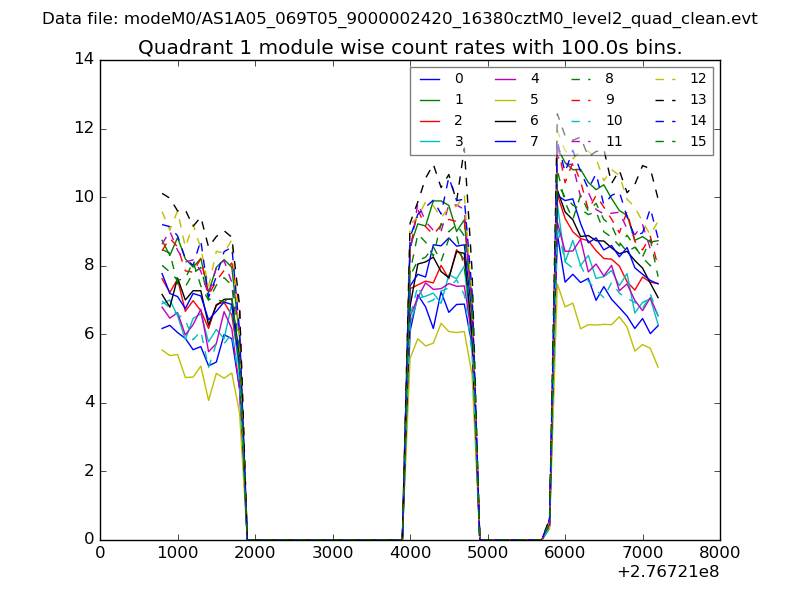
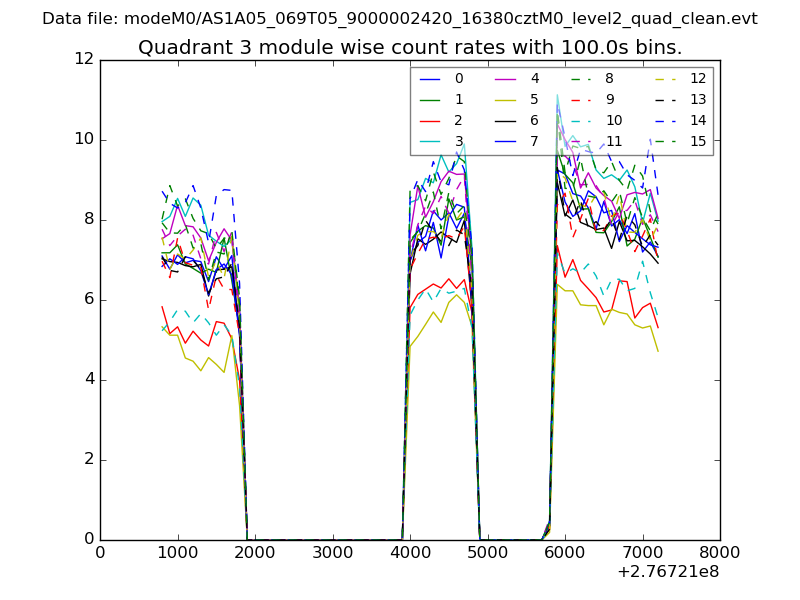
| Module-wise count rates for Quadrant A Data is divided into 100 sec bins |
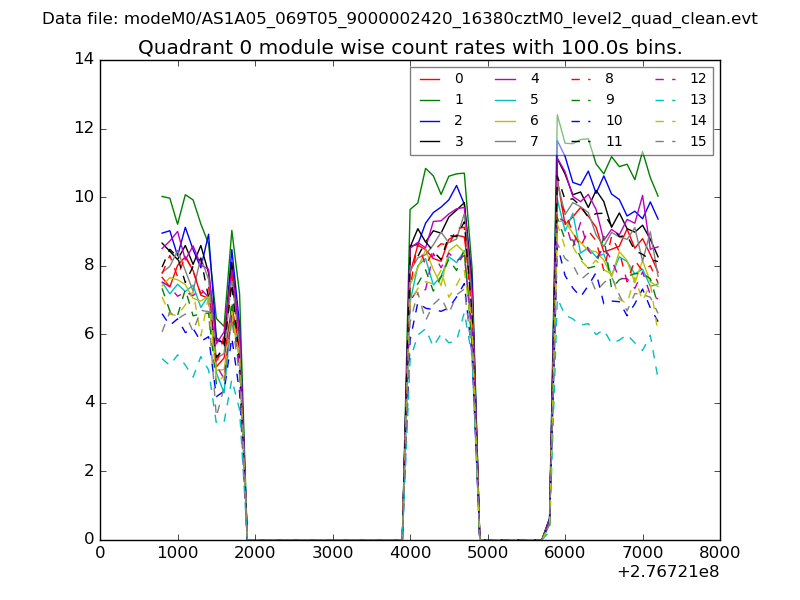 |
 |
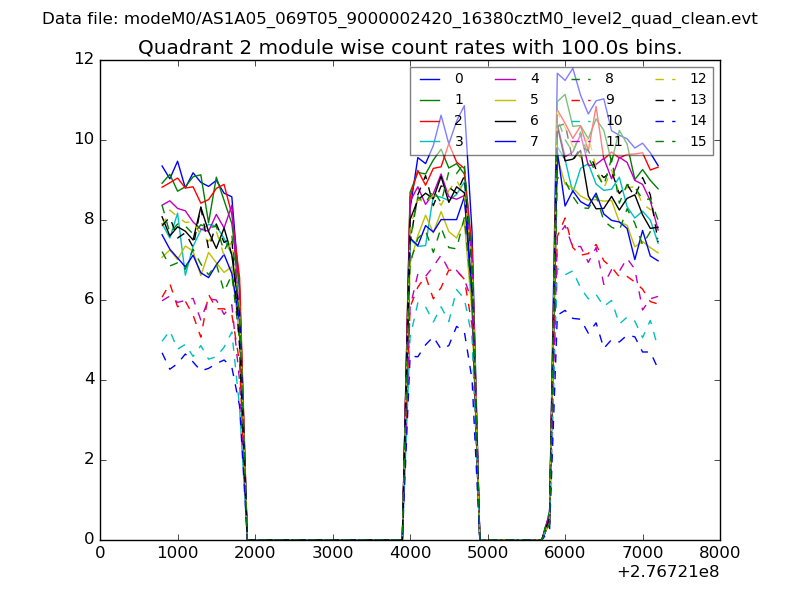
| Module-wise count rates for Quadrant B Data is divided into 100 sec bins |
 |
 |
| Module-wise count rates for Quadrant C Data is divided into 100 sec bins |
 |
 |
| Module-wise count rates for Quadrant D Data is divided into 100 sec bins |
 |
 |
| Parameter | Plot |
|---|---|
| CZT HV Monitor | 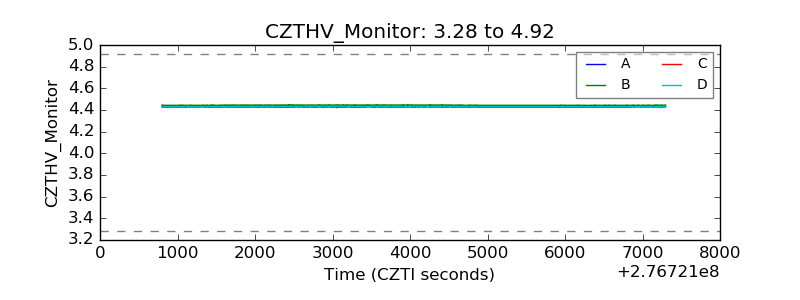 |
| D_VDD | 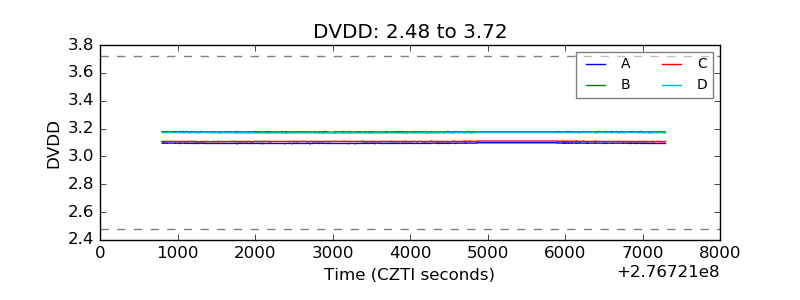 |
| Temperature 1 | 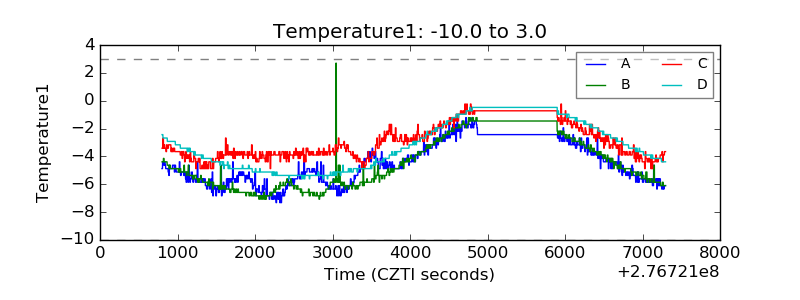 |
| Veto HV Monitor | 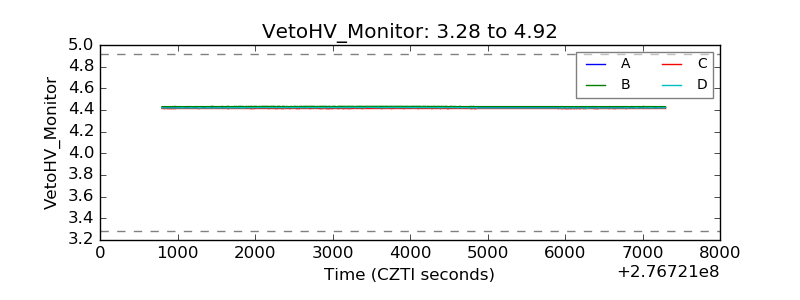 |
| Veto LLD | 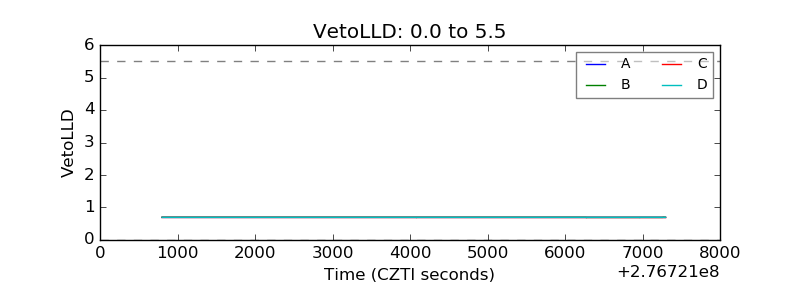 |
| Alpha Counter | 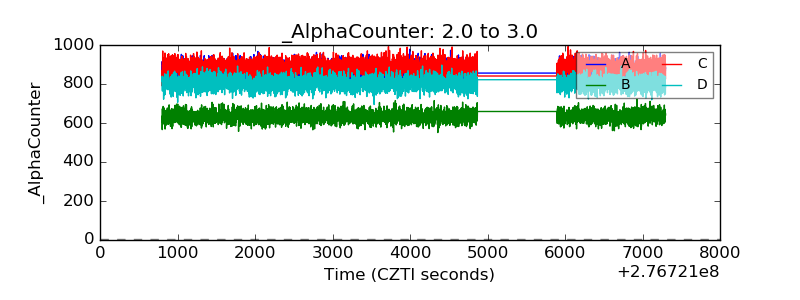 |
| _CPM_Rate | 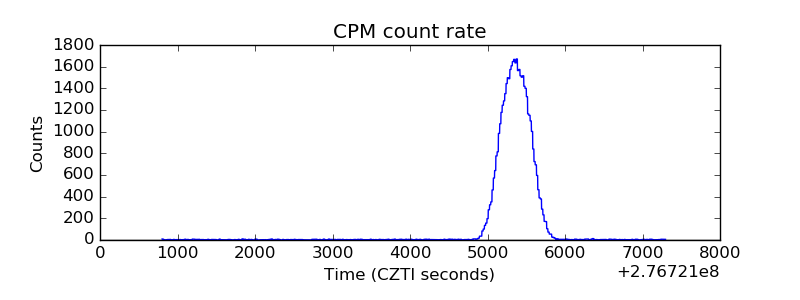 |
| CZT Counter | 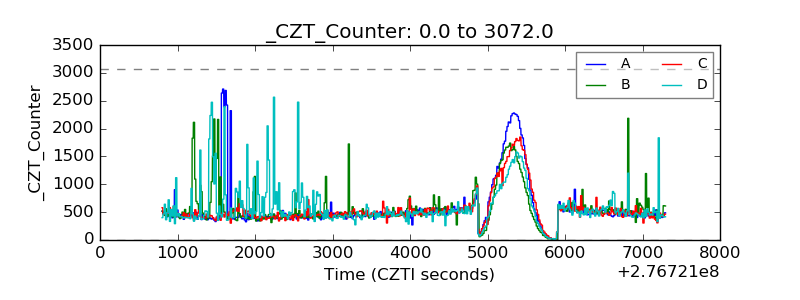 |
| +2.5 Volts monitor |  |
| +5 Volts monitor | 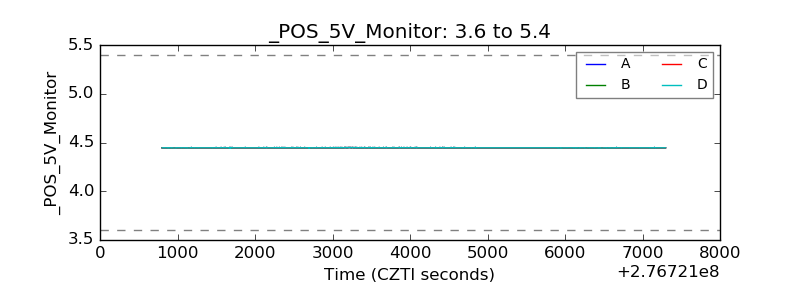 |
| _ROLL_ROT | 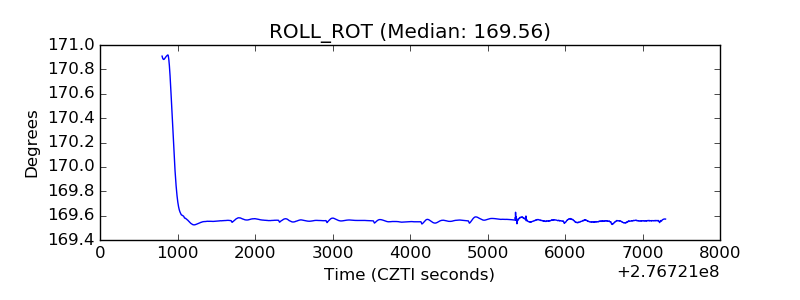 |
| _Roll_DEC | 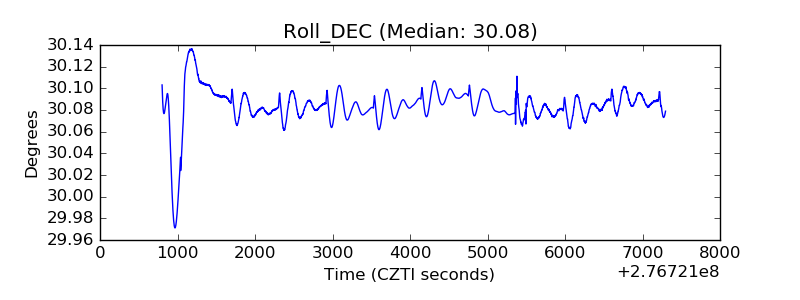 |
| _Roll_RA | 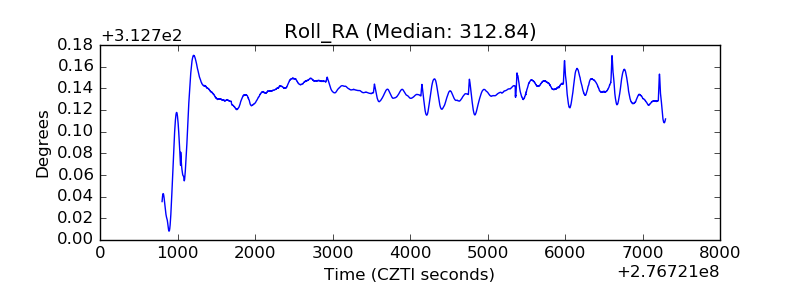 |
| Veto Counter | 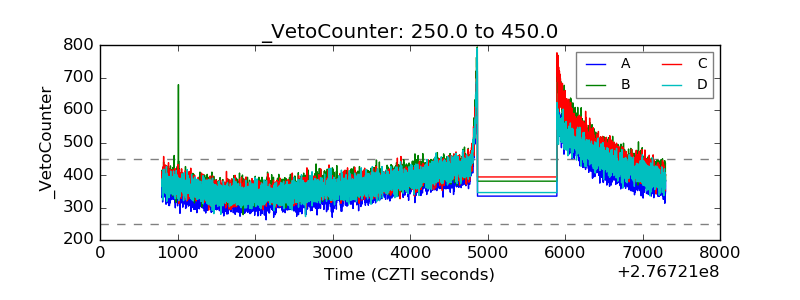 |