| Param | Original file | Final file |
|---|---|---|
| Filename | modeM0/AS1A05_069T05_9000002420_16383cztM0_level2.evt | modeM0/AS1A05_069T05_9000002420_16383cztM0_level2_quad_clean.evt |
| Size (bytes) | 441,322,560 | 87,212,160 |
| Size | 420.9 MB | 83.2 MB |
| Events in quadrant A | 3,084,233 | 563,362 |
| Events in quadrant B | 3,482,592 | 582,739 |
| Events in quadrant C | 3,135,220 | 545,966 |
| Events in quadrant D | 3,240,238 | 514,245 |
| Mode M9 | |||
|---|---|---|---|
| Quadrant | BADHDUFLAG | Total packets | Discarded packets |
| A | 0 | 19 | 0 |
| B | 0 | 19 | 0 |
| C | 0 | 19 | 0 |
| D | 0 | 20 | 0 |
| Mode SS | |||
|---|---|---|---|
| Quadrant | BADHDUFLAG | Total packets | Discarded packets |
| A | 0 | 126 | 0 |
| B | 0 | 126 | 0 |
| C | 0 | 126 | 0 |
| D | 0 | 126 | 0 |
| Mode M0 | |||
|---|---|---|---|
| Quadrant | BADHDUFLAG | Total packets | Discarded packets |
| A | 0 | 13096 | 3 |
| B | 0 | 14364 | 2 |
| C | 0 | 13108 | 2 |
| D | 0 | 13799 | 2 |
| Quadrant | Total seconds | Saturated seconds | Saturation percentage |
|---|---|---|---|
| A | 6230 | 13 | 0.208668% |
| B | 6230 | 45 | 0.722311% |
| C | 6230 | 41 | 0.658106% |
| D | 6230 | 105 | 1.685393% |
Noise dominated data is calculated using 1-second bins in cleaned event files. If a bin has >2000 counts, and if more than 50% of those come from <1% of pixels, then it is considered to be noise-dominated and hence unusable.
| Quadrant | # 1 sec bins | Bins with >0 counts | Bins with >2000 counts | High rate bins dominated by noise | Noise dominated (total time) | Noise dominated (detector-on time) | Marked lightcurve |
|---|---|---|---|---|---|---|---|
| A | 7496 | 6232 | 3 | 3 | 0.04% | 0.05% | 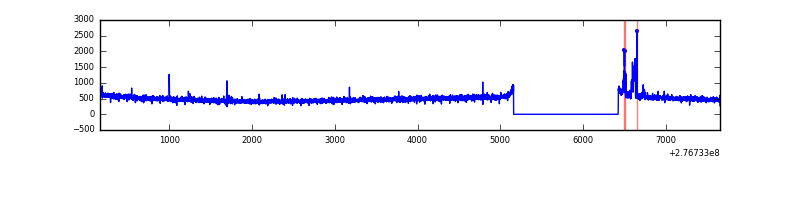 |
| B | 7496 | 6232 | 12 | 12 | 0.16% | 0.19% | 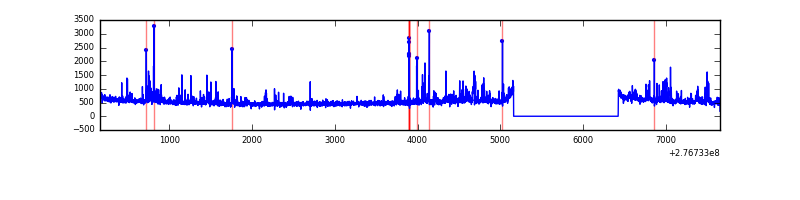 |
| C | 7496 | 6232 | 0 | 0 | 0.00% | 0.00% | 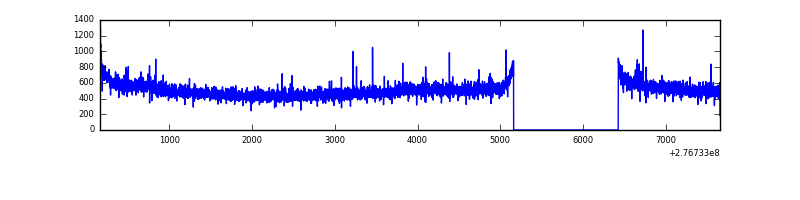 |
| D | 7496 | 6232 | 60 | 60 | 0.80% | 0.96% | 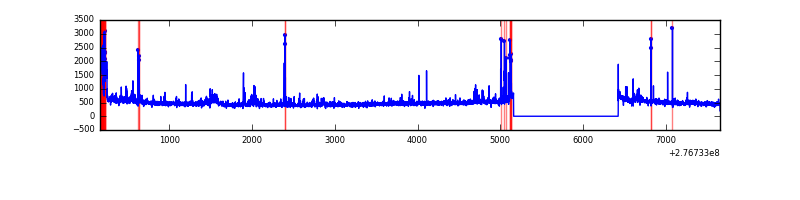 |
Top three noisy pixels from each quadrant. If the there are fewer than three noisy pixels in the level2.evt file, extra rows are filled as -1
| Pixel properties | Quadrant properties | ||||||
|---|---|---|---|---|---|---|---|
| Quadrant | DetID | PixID | Counts | Sigma | Mean | Median | Sigma |
| A | 15 | 174 | 66360 | 419.66 | 779 | 764 | 156.3 |
| A | 15 | 223 | 18610 | 114.17 | 779 | 764 | 156.3 |
| A | 0 | 226 | 6941 | 39.52 | 779 | 764 | 156.3 |
| B | 10 | 16 | 118327 | 792.29 | 789 | 770 | 148.4 |
| B | 15 | 35 | 87651 | 585.55 | 789 | 770 | 148.4 |
| B | 0 | 189 | 72390 | 482.69 | 789 | 770 | 148.4 |
| C | 14 | 238 | 116641 | 662.61 | 752 | 756 | 174.9 |
| C | 3 | 233 | 74559 | 421.99 | 752 | 756 | 174.9 |
| C | 10 | 169 | 10618 | 56.39 | 752 | 756 | 174.9 |
| D | 10 | 70 | 128714 | 701.85 | 742 | 719 | 182.4 |
| D | 12 | 218 | 99752 | 543.04 | 742 | 719 | 182.4 |
| D | 2 | 122 | 86182 | 468.63 | 742 | 719 | 182.4 |
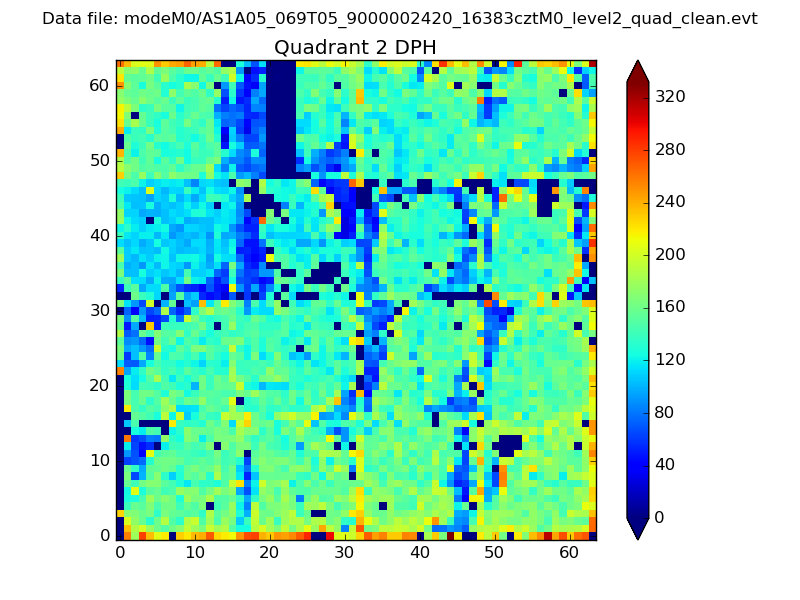
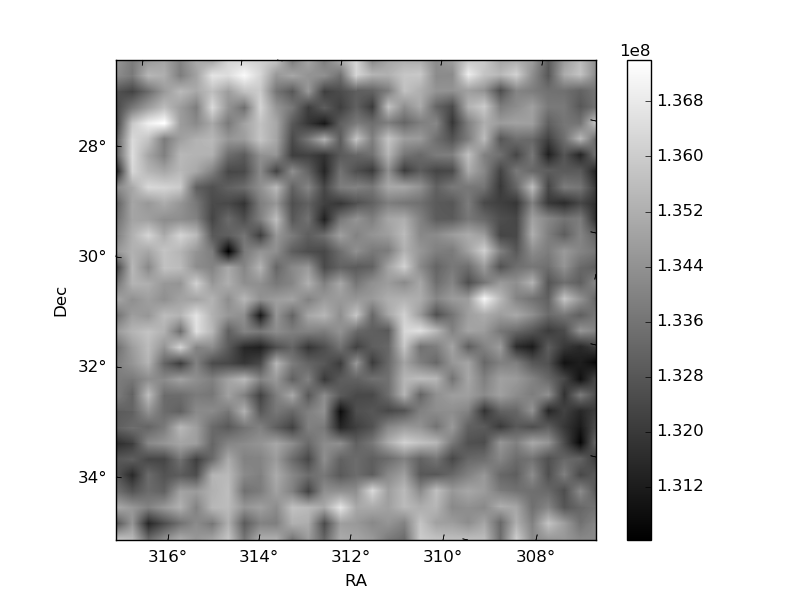
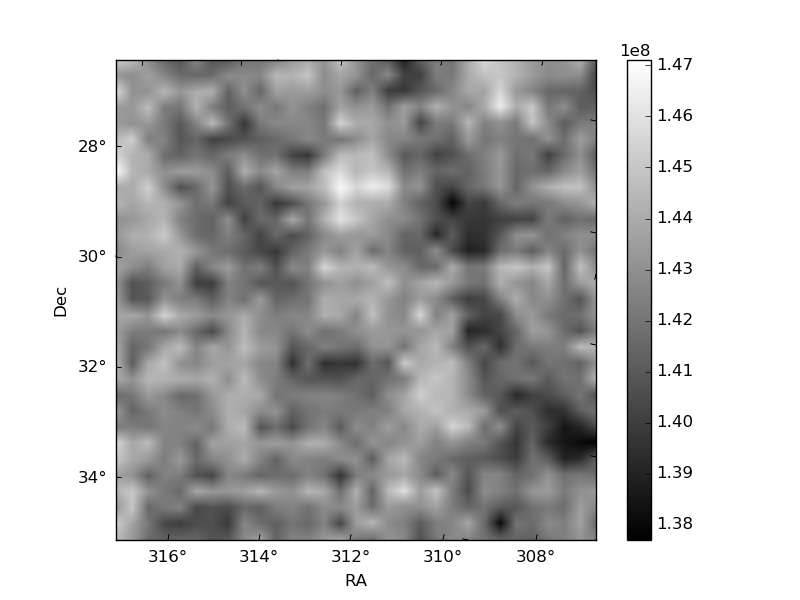
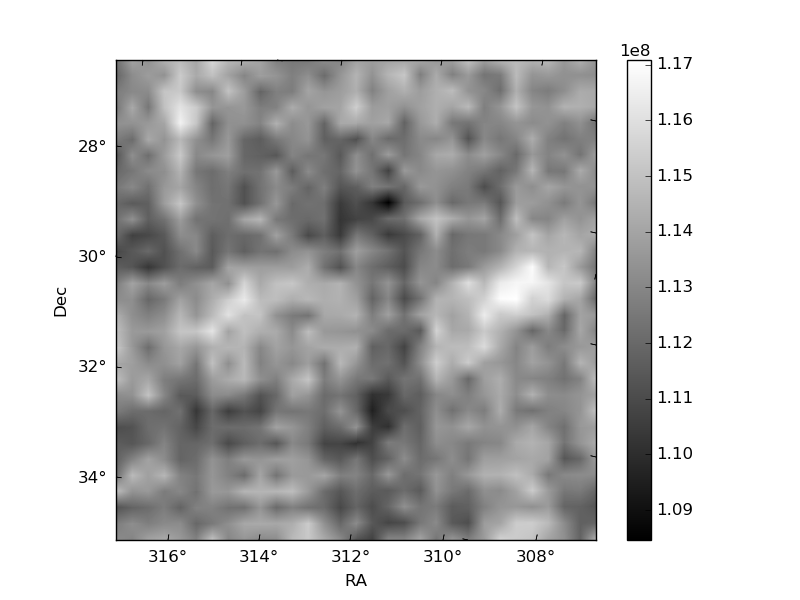
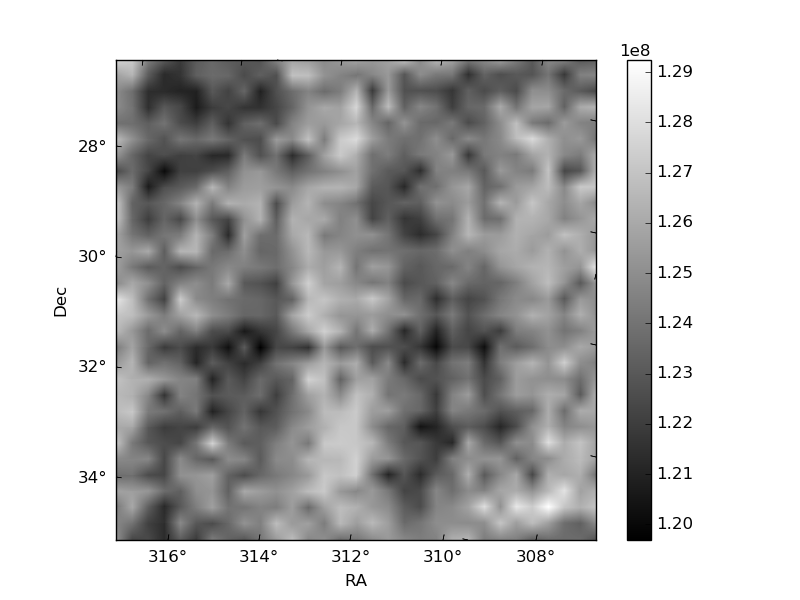
Histogram calculated using DETX and DETY for each event in the final _common_clean file
| Quadrant A | 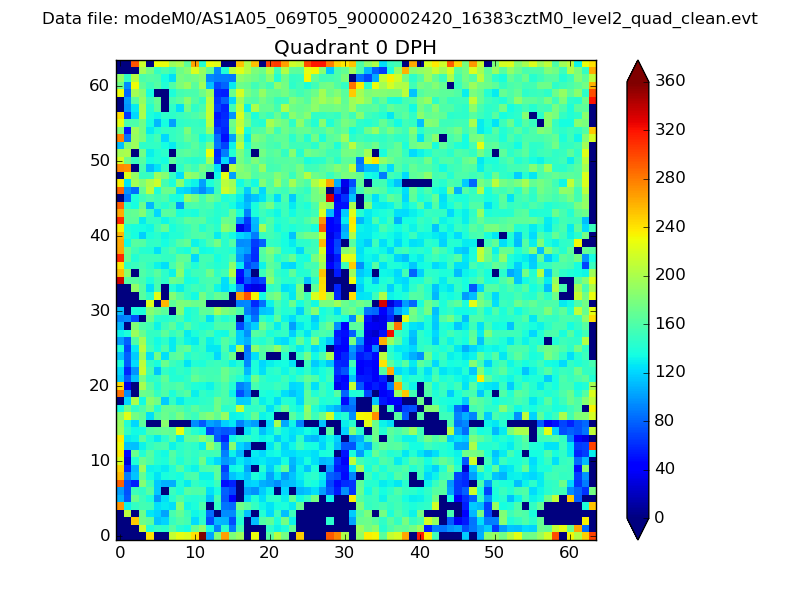 |
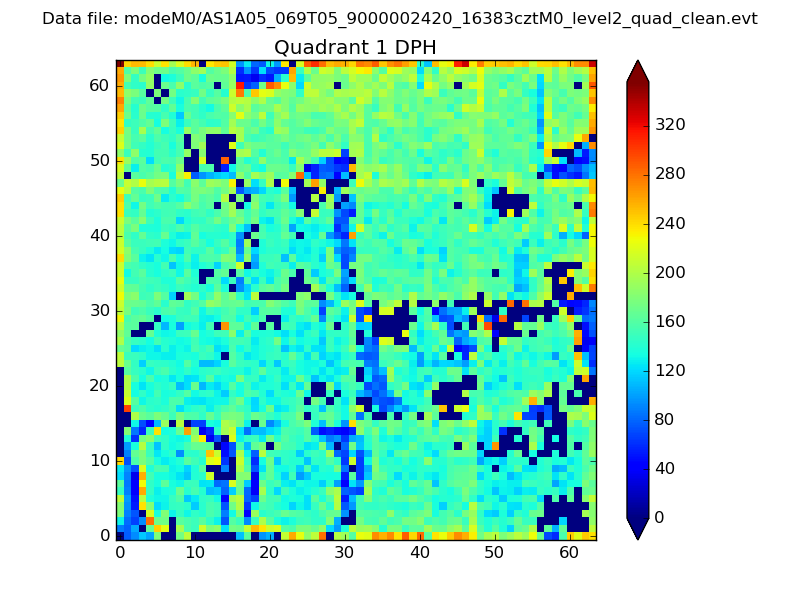 |
Quadrant B |
|---|---|---|---|
| Quadrant D | 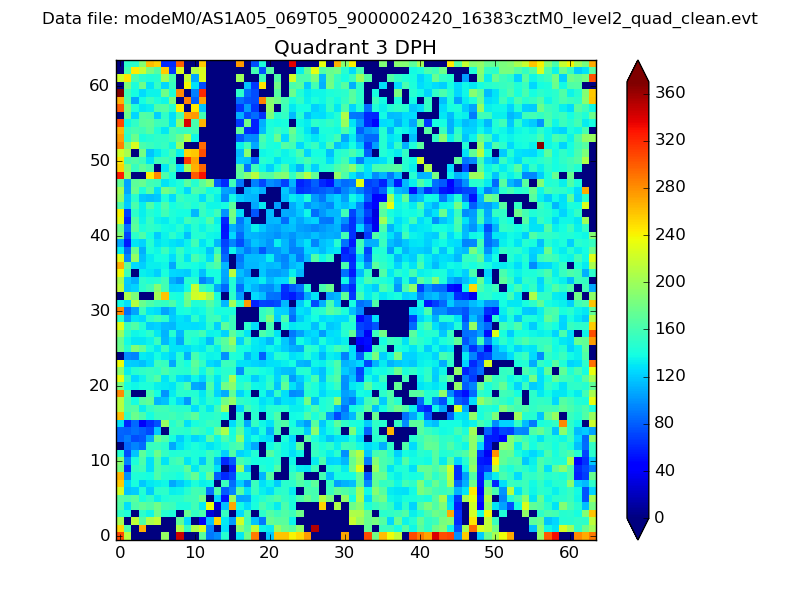 |
 |
Quadrant C |
| Plot type | Count rate plots | Images |
|---|---|---|
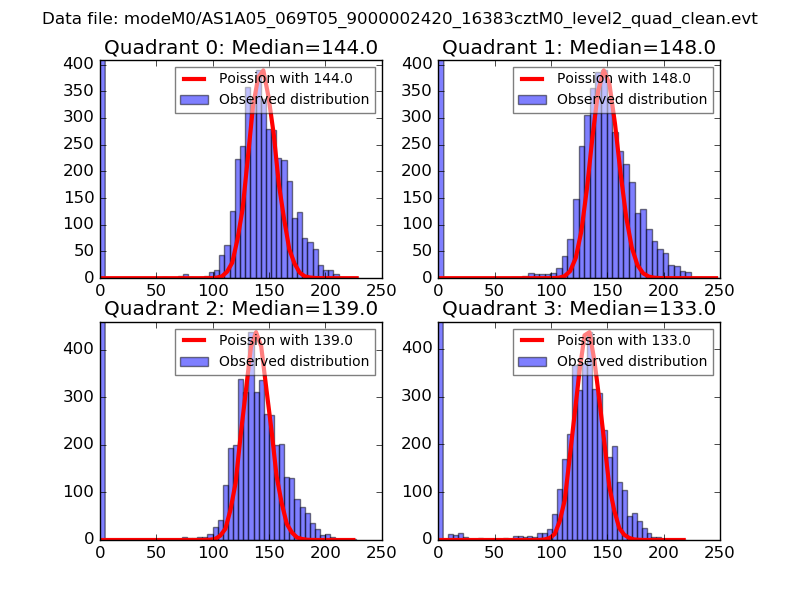
| Comparison with Poisson distribution Blue bars denote a histogram of data divided into 1 sec bins. Red curve is a Poisson curve with rate = median count rate of data. |
 |
 |
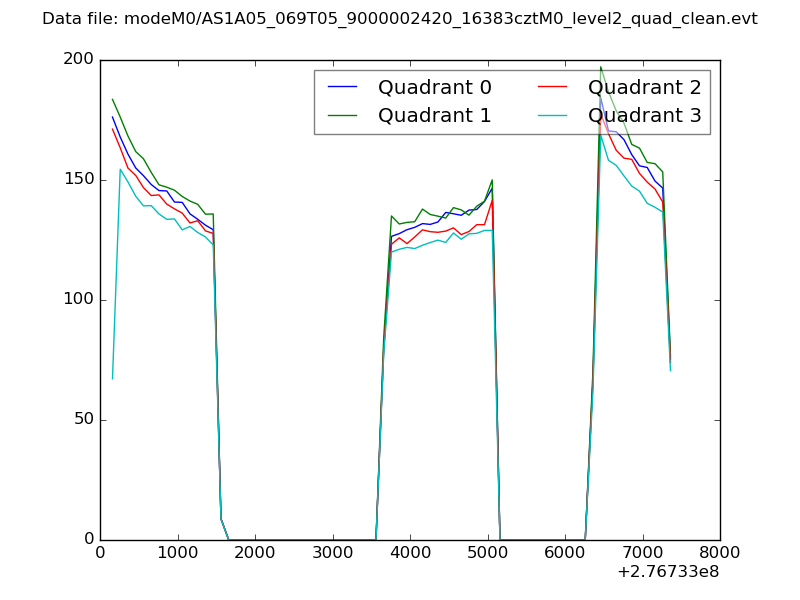
| Quadrant-wise count rates Data is divided into 100 sec bins |
 |
|
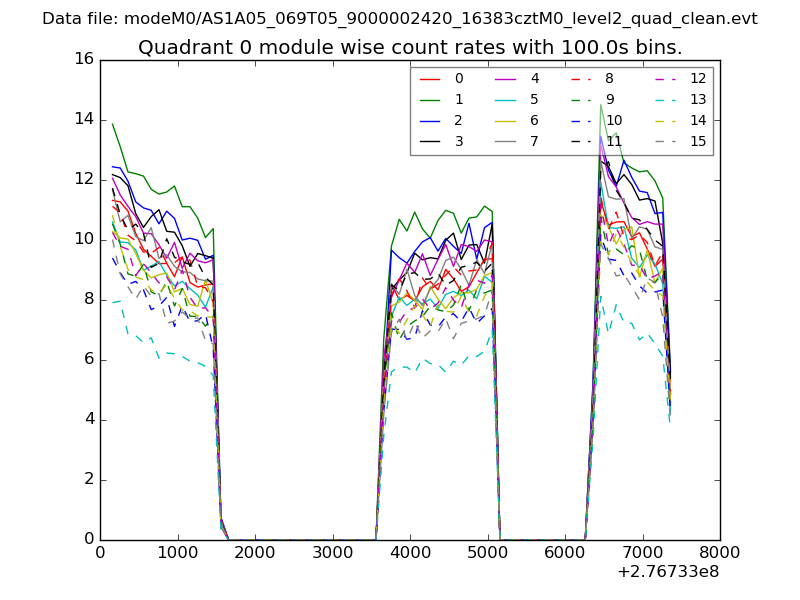
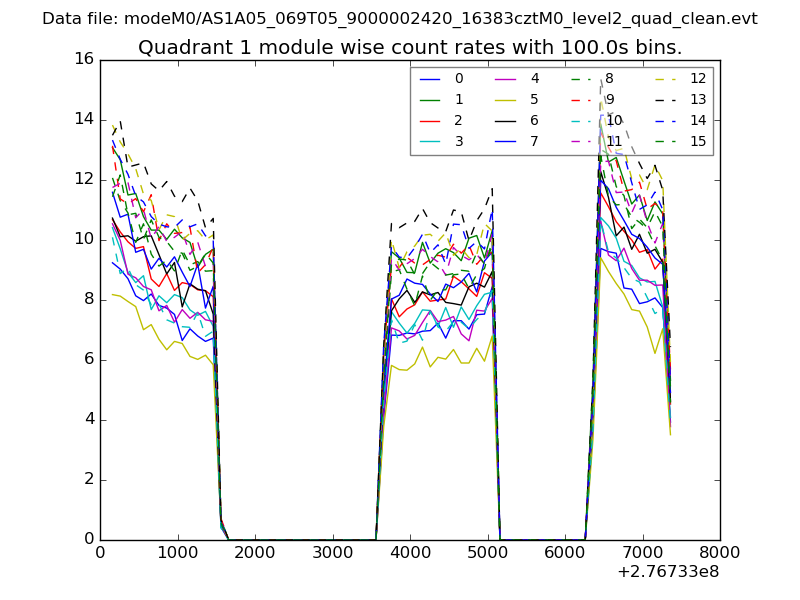
| Module-wise count rates for Quadrant A Data is divided into 100 sec bins |
 |
 |
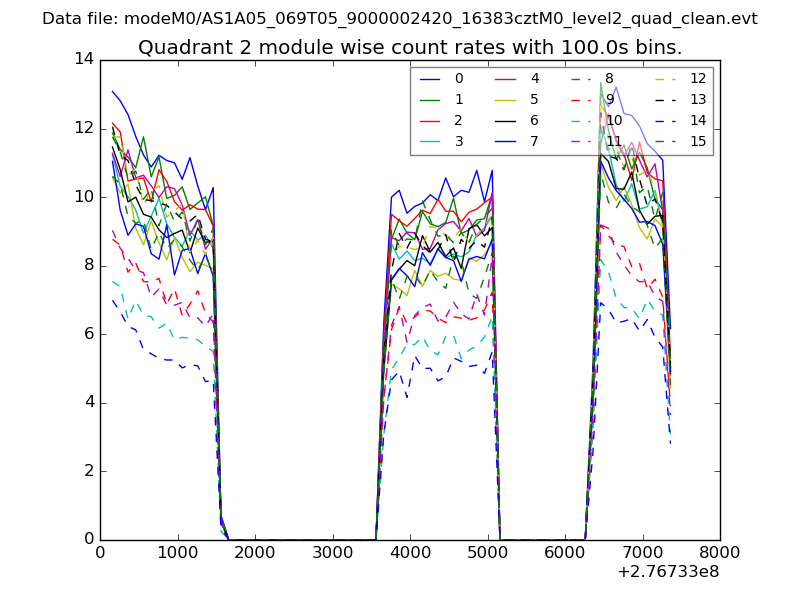
| Module-wise count rates for Quadrant B Data is divided into 100 sec bins |
 |
 |
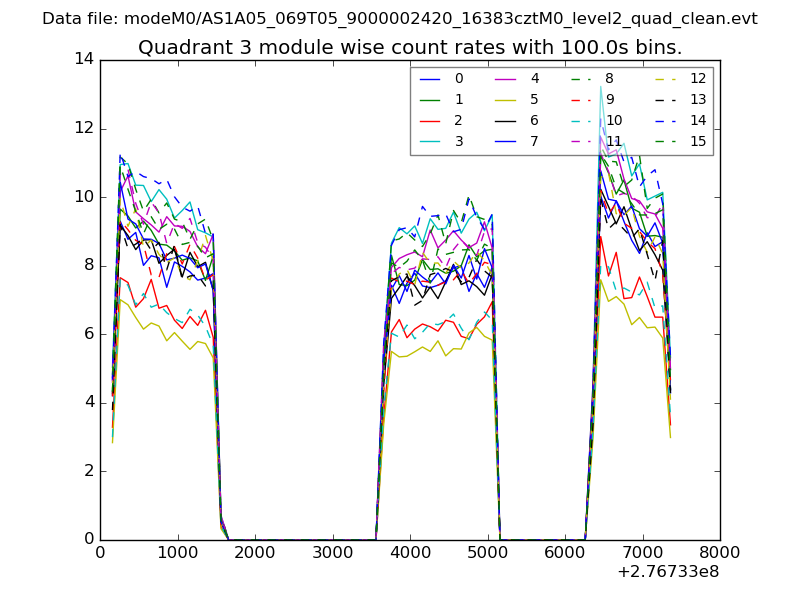
| Module-wise count rates for Quadrant C Data is divided into 100 sec bins |
 |
 |
| Module-wise count rates for Quadrant D Data is divided into 100 sec bins |
 |
 |
| Parameter | Plot |
|---|---|
| CZT HV Monitor | 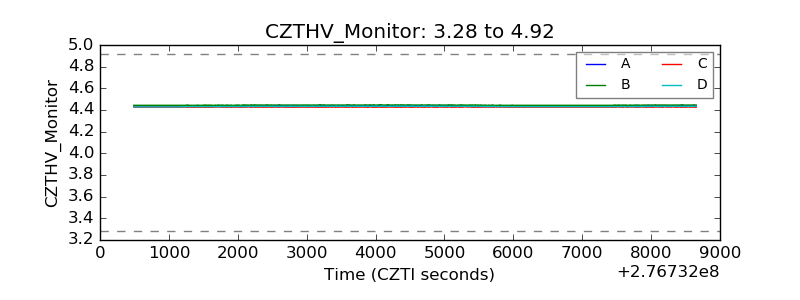 |
| D_VDD | 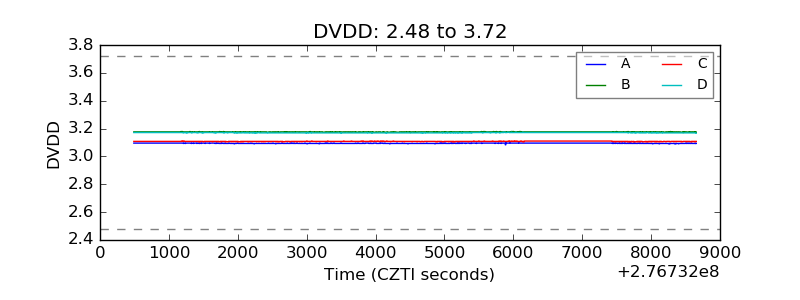 |
| Temperature 1 | 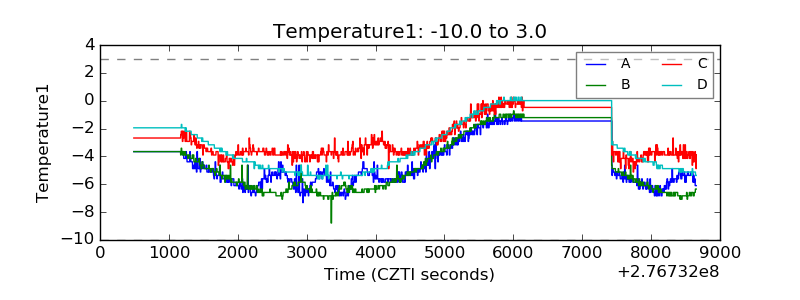 |
| Veto HV Monitor | 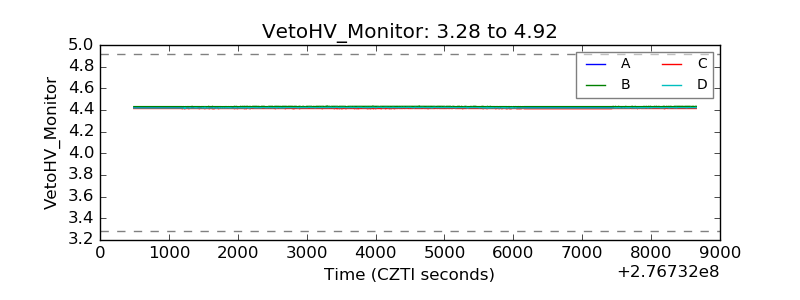 |
| Veto LLD | 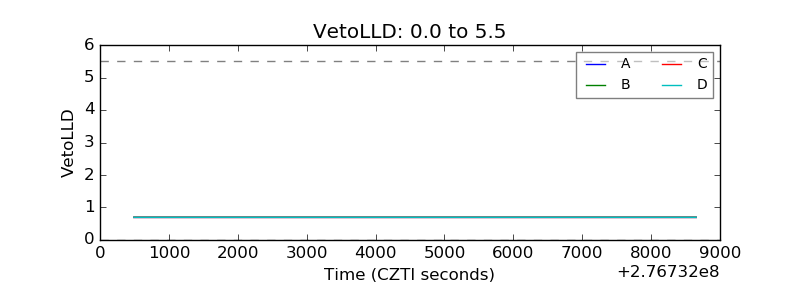 |
| Alpha Counter | 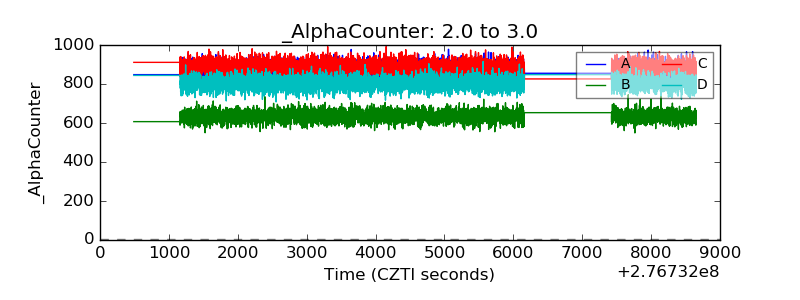 |
| _CPM_Rate |  |
| CZT Counter | 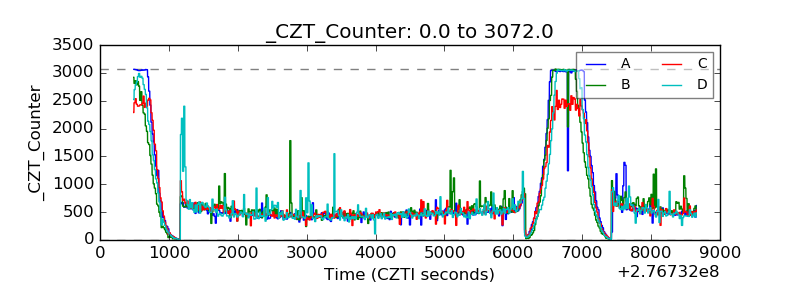 |
| +2.5 Volts monitor | 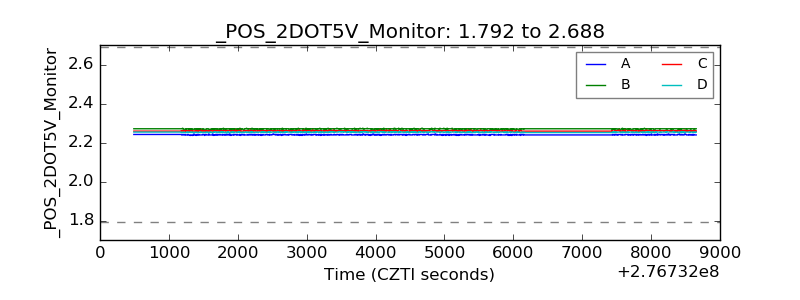 |
| +5 Volts monitor | 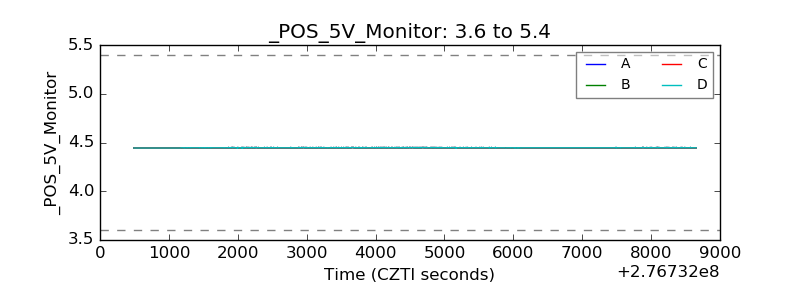 |
| _ROLL_ROT | 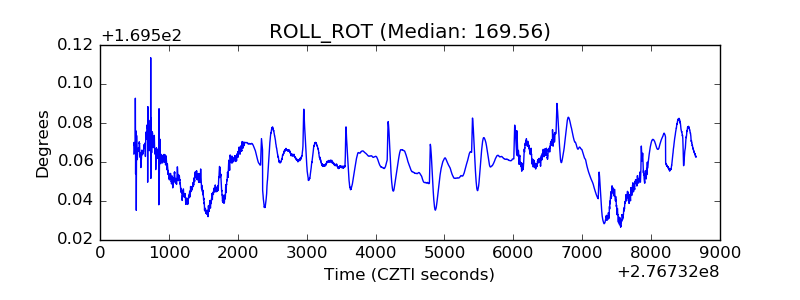 |
| _Roll_DEC | 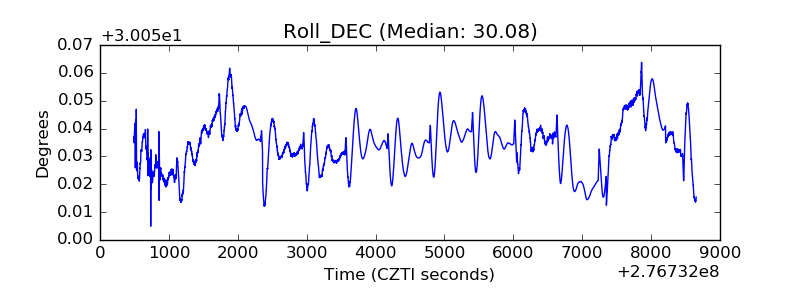 |
| _Roll_RA | 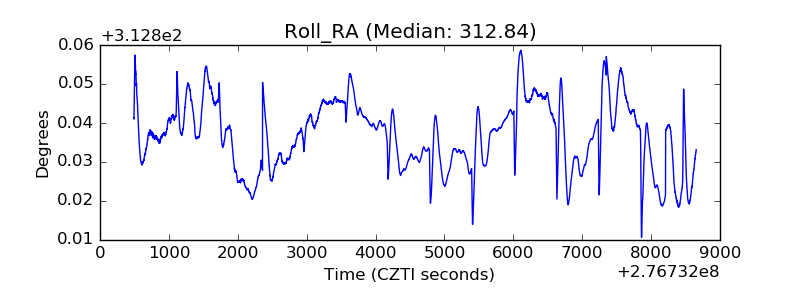 |
| Veto Counter | 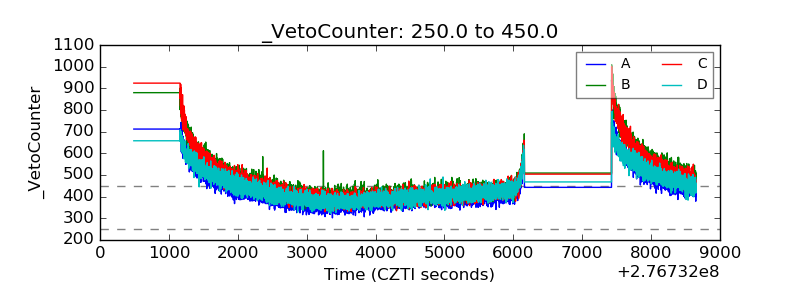 |