| Param | Original file | Final file |
|---|---|---|
| Filename | modeM0/AS1A05_069T05_9000002420_16384cztM0_level2.evt | modeM0/AS1A05_069T05_9000002420_16384cztM0_level2_quad_clean.evt |
| Size (bytes) | 476,112,960 | 79,162,560 |
| Size | 454.1 MB | 75.5 MB |
| Events in quadrant A | 3,281,985 | 506,159 |
| Events in quadrant B | 3,487,730 | 524,421 |
| Events in quadrant C | 3,128,796 | 490,498 |
| Events in quadrant D | 4,103,657 | 447,104 |
| Mode M9 | |||
|---|---|---|---|
| Quadrant | BADHDUFLAG | Total packets | Discarded packets |
| A | 0 | 19 | 0 |
| B | 0 | 19 | 0 |
| C | 0 | 19 | 0 |
| D | 0 | 20 | 0 |
| Mode SS | |||
|---|---|---|---|
| Quadrant | BADHDUFLAG | Total packets | Discarded packets |
| A | 0 | 126 | 0 |
| B | 0 | 126 | 0 |
| C | 0 | 126 | 0 |
| D | 0 | 126 | 0 |
| Mode M0 | |||
|---|---|---|---|
| Quadrant | BADHDUFLAG | Total packets | Discarded packets |
| A | 0 | 13535 | 3 |
| B | 0 | 14253 | 2 |
| C | 0 | 12971 | 2 |
| D | 0 | 16338 | 2 |
| Quadrant | Total seconds | Saturated seconds | Saturation percentage |
|---|---|---|---|
| A | 6138 | 71 | 1.156729% |
| B | 6138 | 52 | 0.847181% |
| C | 6138 | 48 | 0.782014% |
| D | 6138 | 350 | 5.702183% |
Noise dominated data is calculated using 1-second bins in cleaned event files. If a bin has >2000 counts, and if more than 50% of those come from <1% of pixels, then it is considered to be noise-dominated and hence unusable.
| Quadrant | # 1 sec bins | Bins with >0 counts | Bins with >2000 counts | High rate bins dominated by noise | Noise dominated (total time) | Noise dominated (detector-on time) | Marked lightcurve |
|---|---|---|---|---|---|---|---|
| A | 7479 | 6139 | 34 | 34 | 0.45% | 0.55% |  |
| B | 7479 | 6139 | 6 | 6 | 0.08% | 0.10% |  |
| C | 7479 | 6140 | 0 | 0 | 0.00% | 0.00% | 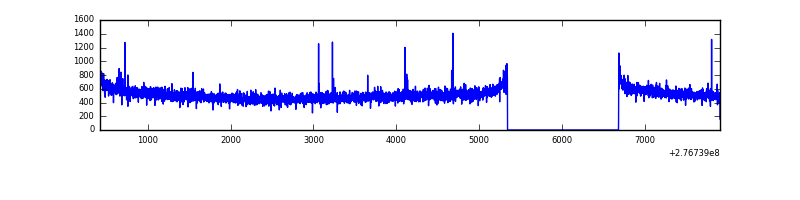 |
| D | 7479 | 6140 | 272 | 272 | 3.64% | 4.43% | 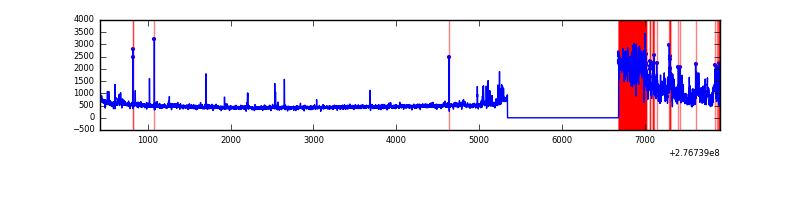 |
Top three noisy pixels from each quadrant. If the there are fewer than three noisy pixels in the level2.evt file, extra rows are filled as -1
| Pixel properties | Quadrant properties | ||||||
|---|---|---|---|---|---|---|---|
| Quadrant | DetID | PixID | Counts | Sigma | Mean | Median | Sigma |
| A | 15 | 174 | 232811 | 1466.38 | 789 | 775 | 158.2 |
| A | 15 | 223 | 11080 | 65.12 | 789 | 775 | 158.2 |
| A | 0 | 226 | 7144 | 40.25 | 789 | 775 | 158.2 |
| B | 15 | 35 | 103504 | 691.68 | 802 | 785 | 148.5 |
| B | 0 | 189 | 61931 | 411.74 | 802 | 785 | 148.5 |
| B | 10 | 16 | 55270 | 366.89 | 802 | 785 | 148.5 |
| C | 14 | 238 | 116874 | 654.13 | 761 | 766 | 177.5 |
| C | 3 | 233 | 34962 | 192.65 | 761 | 766 | 177.5 |
| C | 10 | 169 | 6914 | 34.64 | 761 | 766 | 177.5 |
| D | 2 | 122 | 1156340 | 6373.18 | 742 | 722 | 181.3 |
| D | 12 | 218 | 69781 | 380.86 | 742 | 722 | 181.3 |
| D | 1 | 52 | 22793 | 121.72 | 742 | 722 | 181.3 |
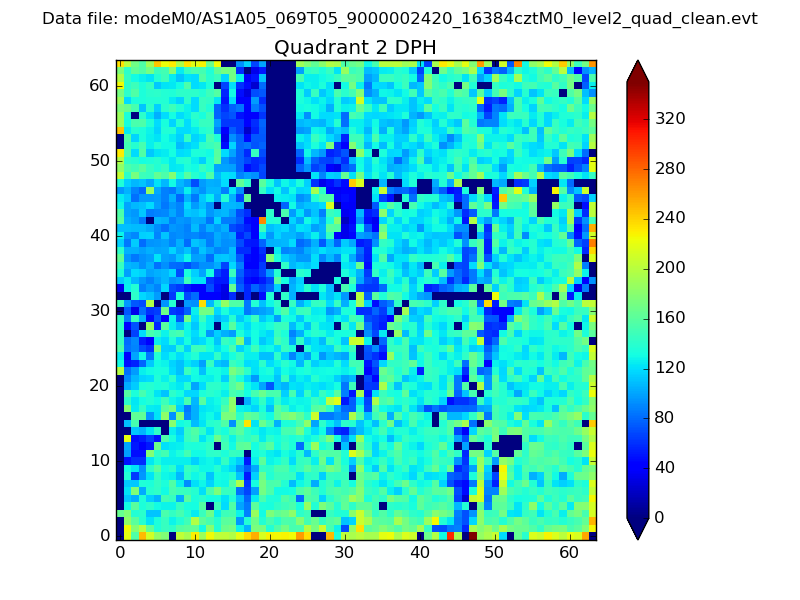
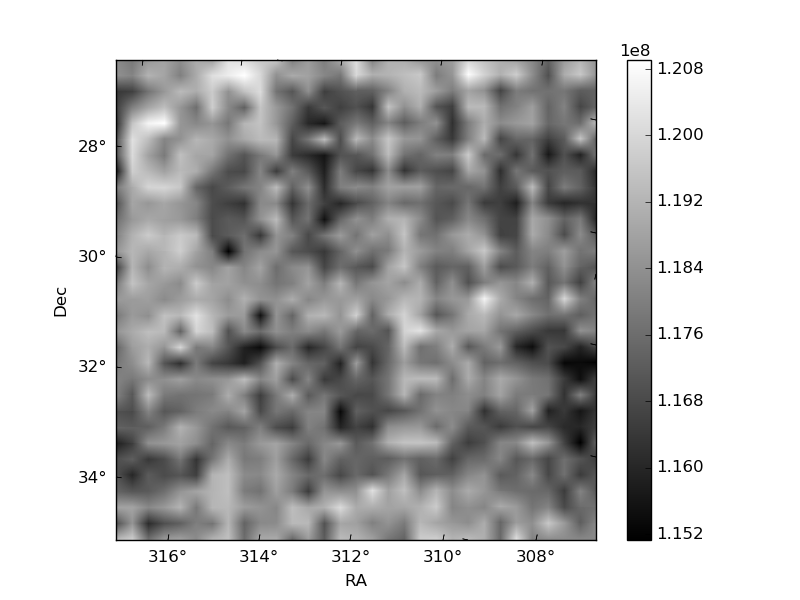
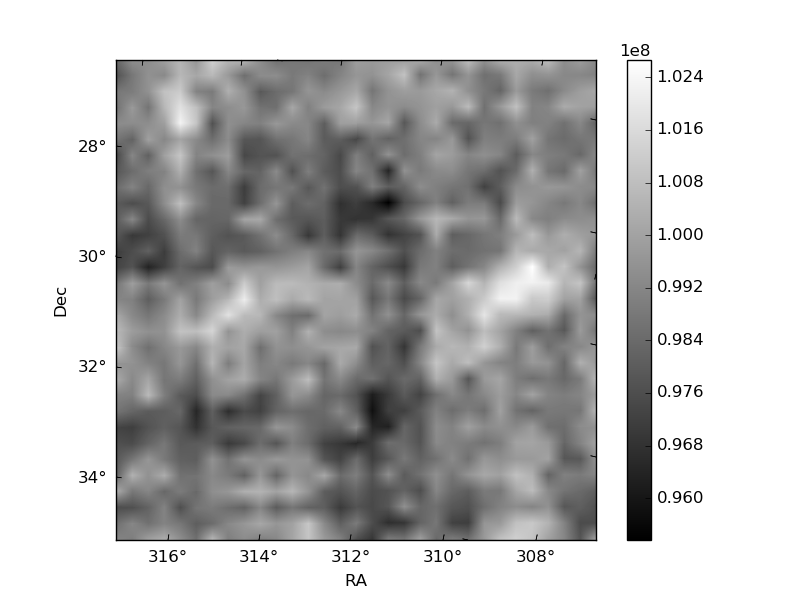
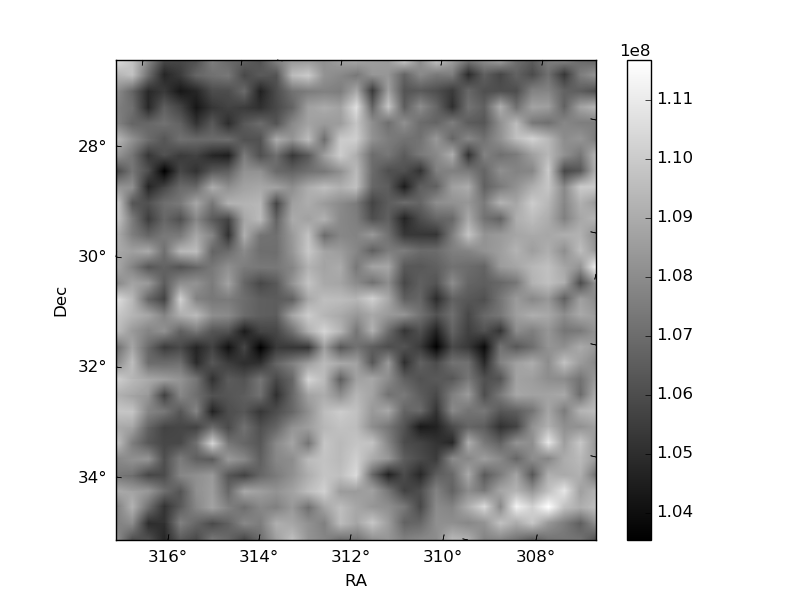
Histogram calculated using DETX and DETY for each event in the final _common_clean file
| Quadrant A | 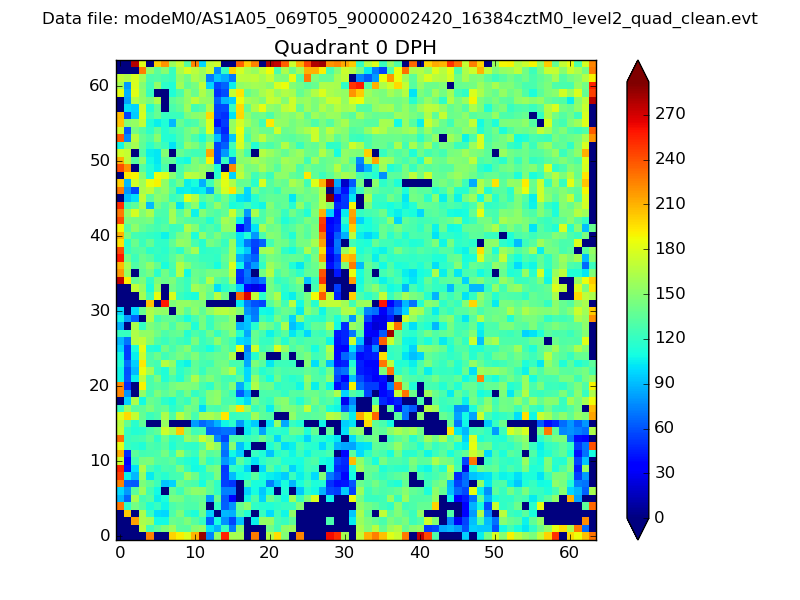 |
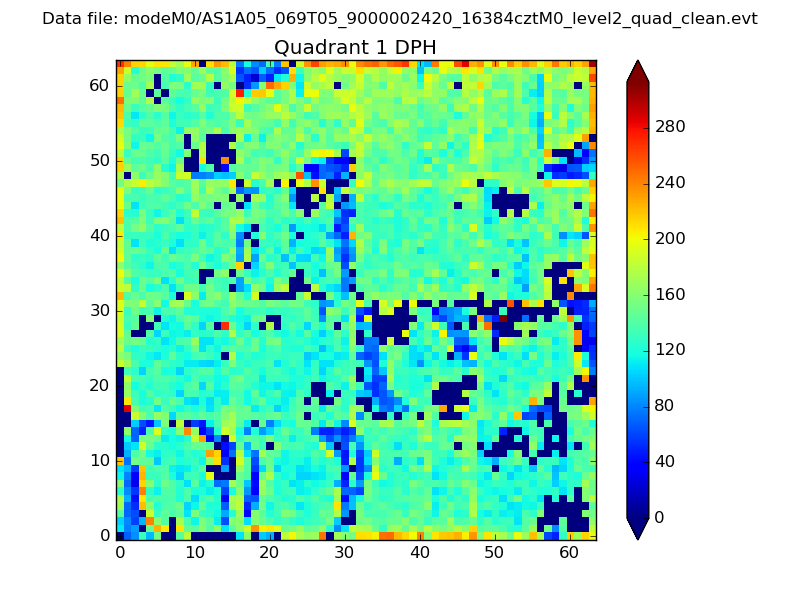 |
Quadrant B |
|---|---|---|---|
| Quadrant D | 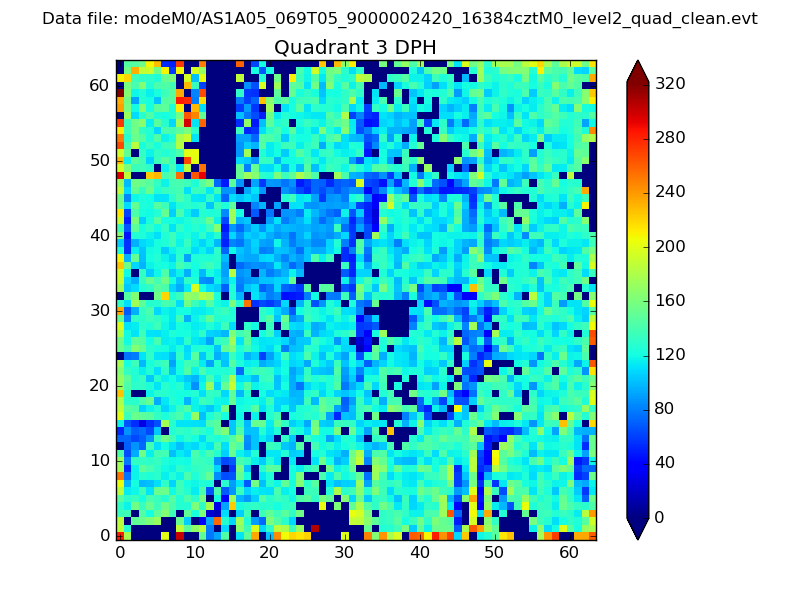 |
 |
Quadrant C |
| Plot type | Count rate plots | Images |
|---|---|---|
| Comparison with Poisson distribution Blue bars denote a histogram of data divided into 1 sec bins. Red curve is a Poisson curve with rate = median count rate of data. |
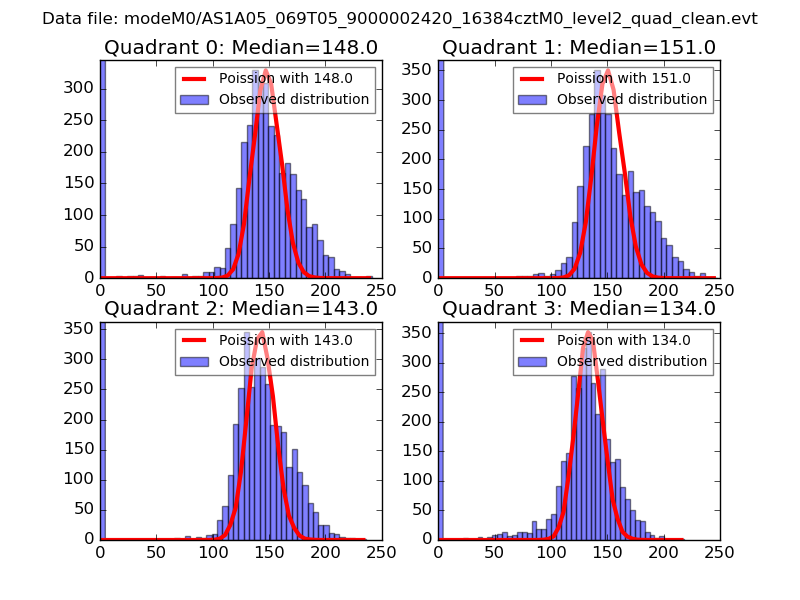 |
 |
| Quadrant-wise count rates Data is divided into 100 sec bins |
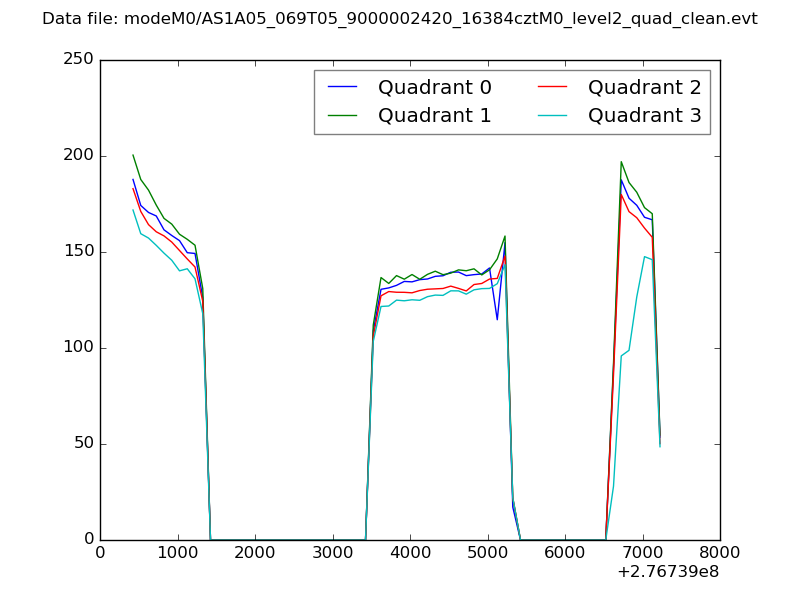 |
|
| Module-wise count rates for Quadrant A Data is divided into 100 sec bins |
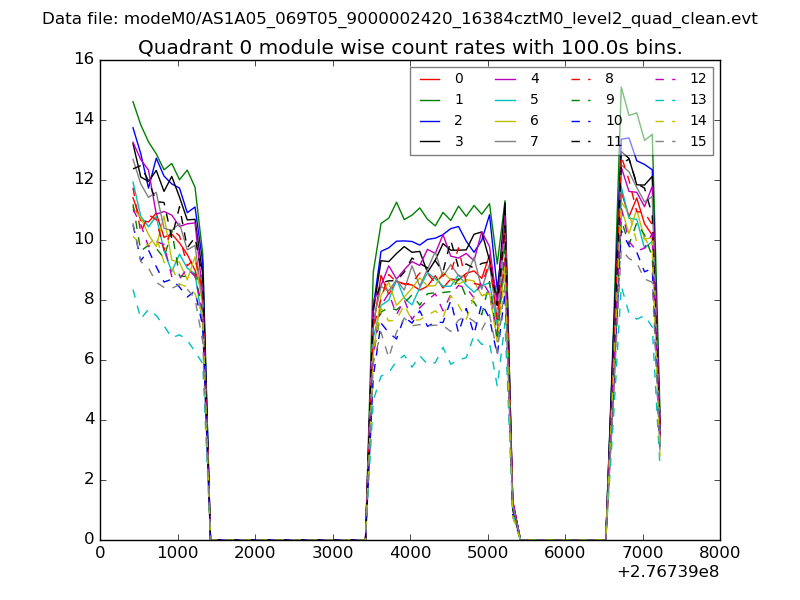 |
 |
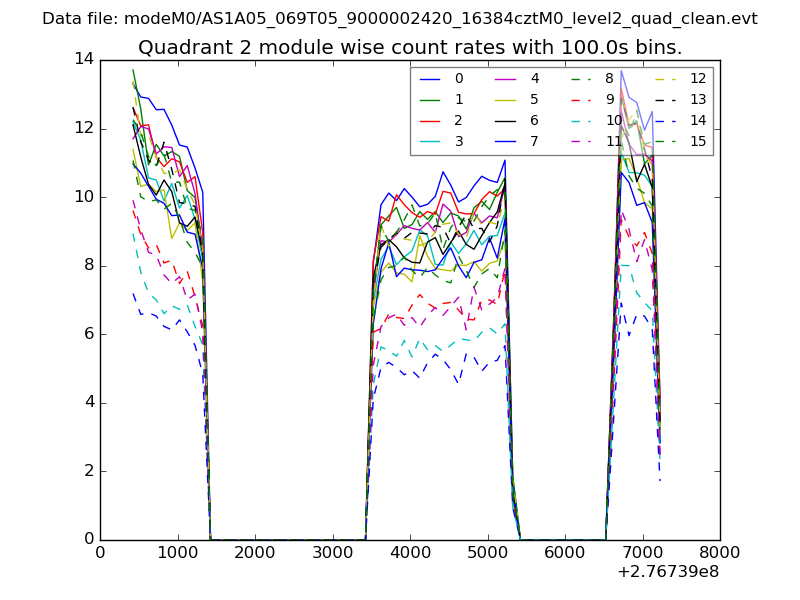
| Module-wise count rates for Quadrant B Data is divided into 100 sec bins |
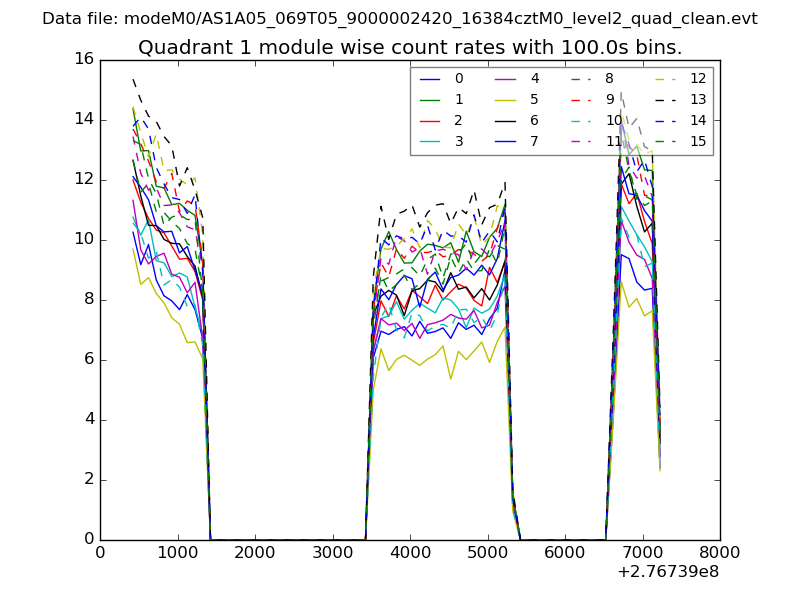 |
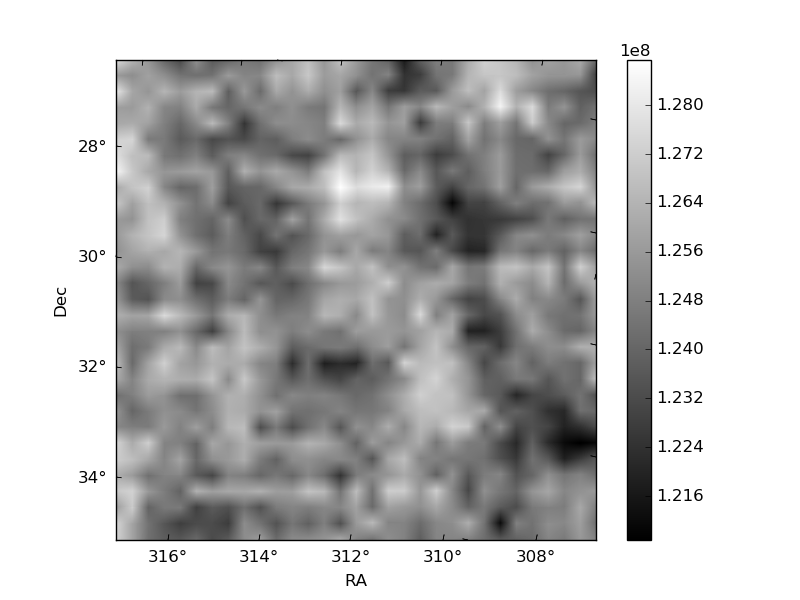 |
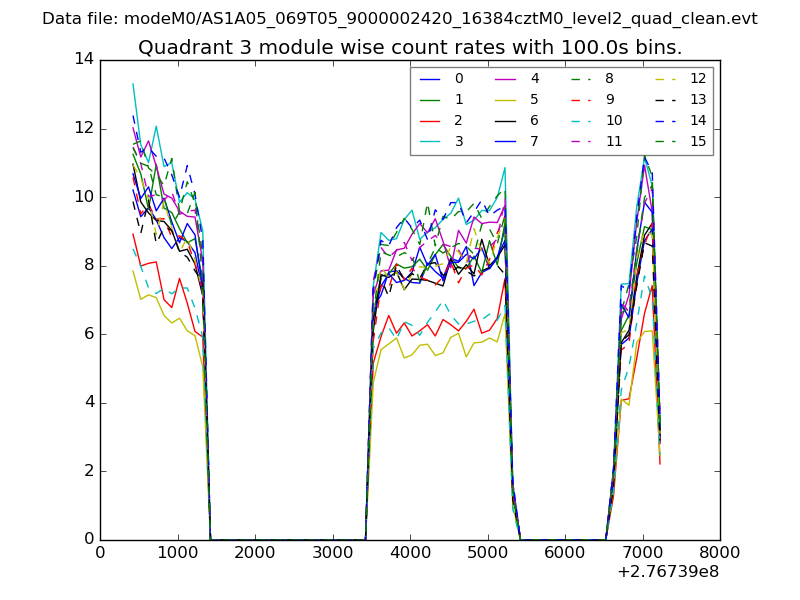
| Module-wise count rates for Quadrant C Data is divided into 100 sec bins |
 |
 |
| Module-wise count rates for Quadrant D Data is divided into 100 sec bins |
 |
 |
| Parameter | Plot |
|---|---|
| CZT HV Monitor | 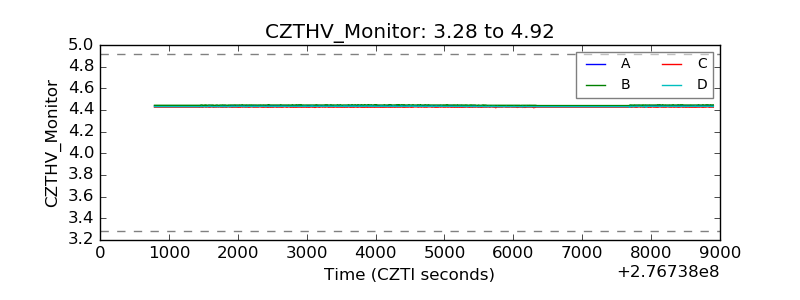 |
| D_VDD | 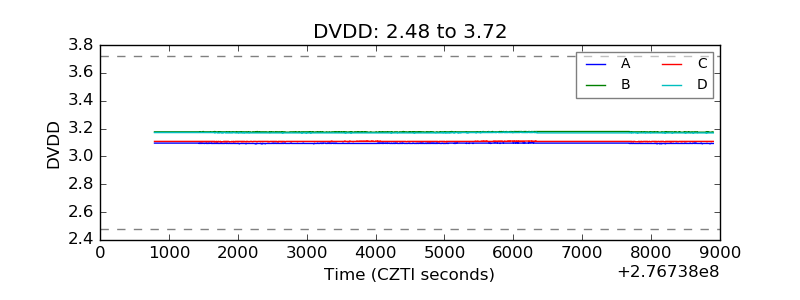 |
| Temperature 1 | 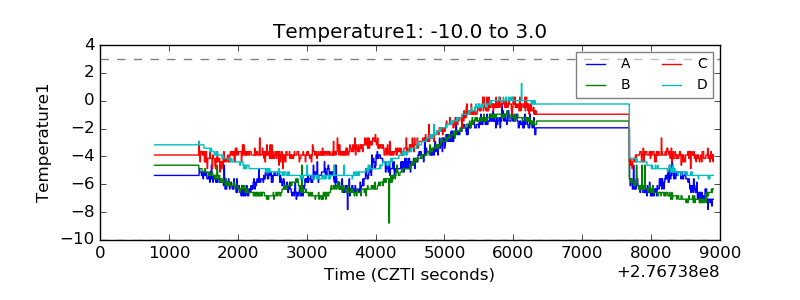 |
| Veto HV Monitor | 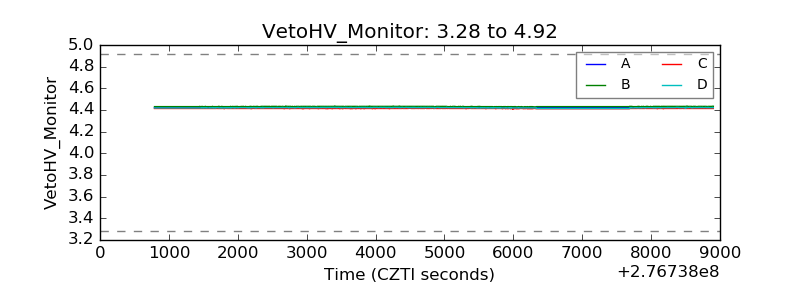 |
| Veto LLD | 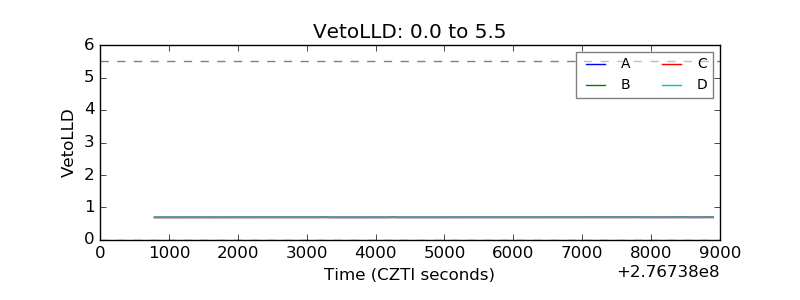 |
| Alpha Counter | 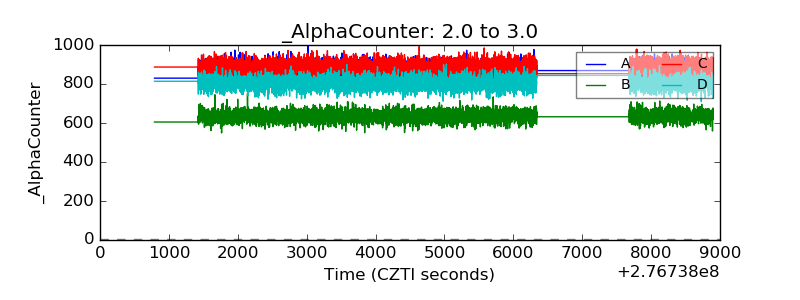 |
| _CPM_Rate | 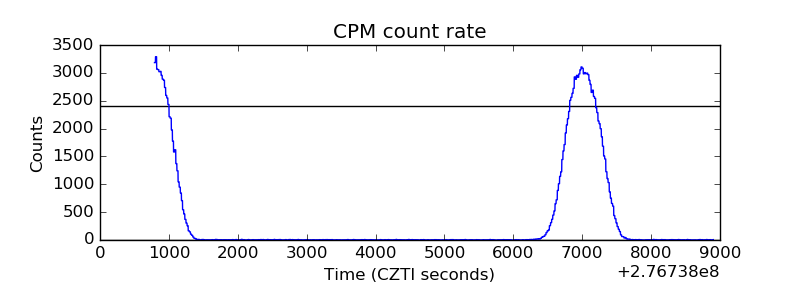 |
| CZT Counter | 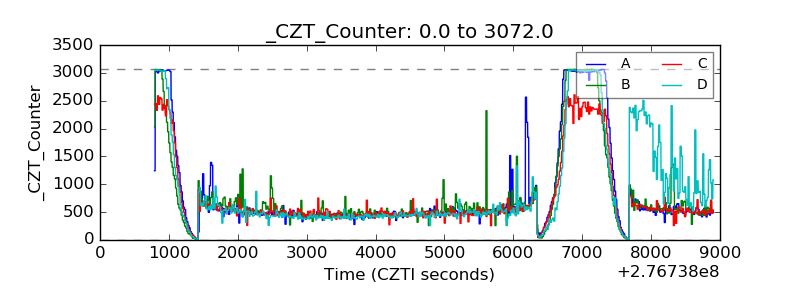 |
| +2.5 Volts monitor |  |
| +5 Volts monitor |  |
| _ROLL_ROT | 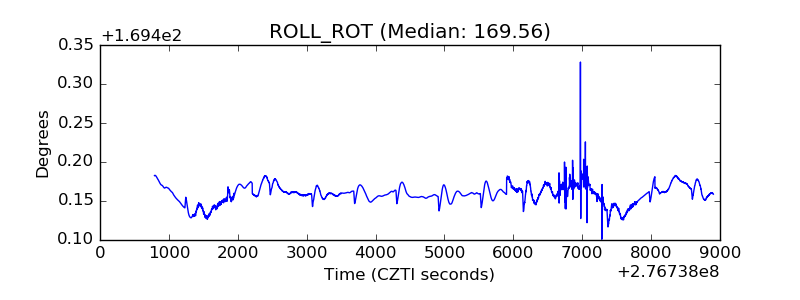 |
| _Roll_DEC | 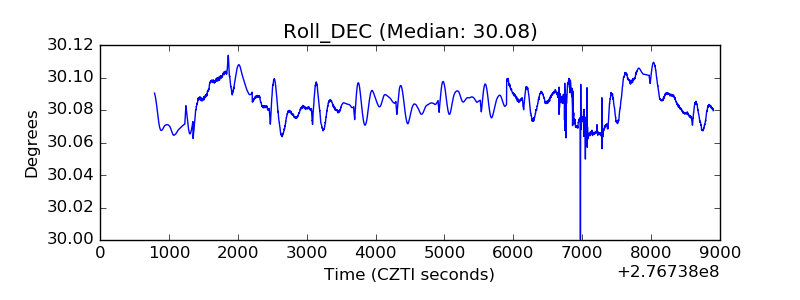 |
| _Roll_RA | 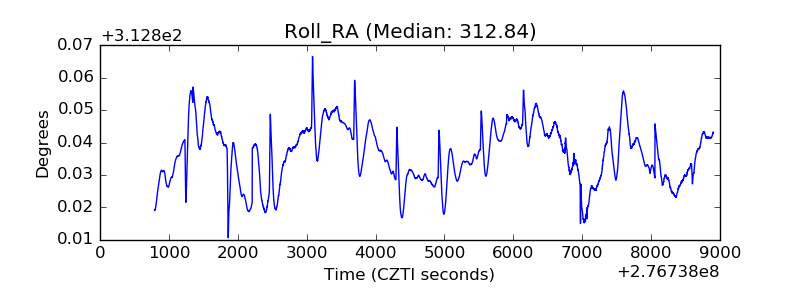 |
| Veto Counter | 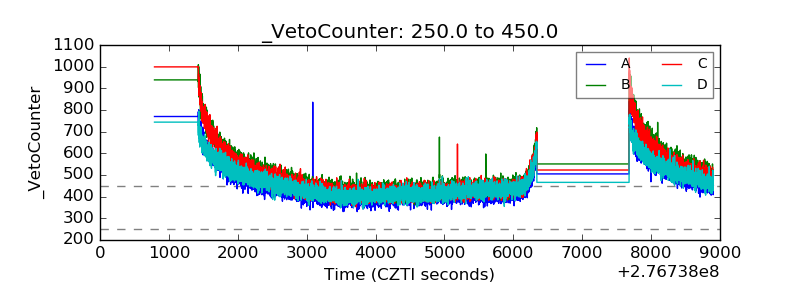 |